 Open Access Article
A dual-functional luminescent Tb(III) metal–organic framework for the selective sensing of acetone and TNP in water†
Nidhi Goel‡
 *ab and
Naresh Kumarc
aSchool of Physical Sciences, Jawaharlal Nehru University, Delhi 110067, India
bDepartment of Chemistry, Institute of Science, Banaras Hindu University, Varanasi 221005, India
cDiscipline of Biosciences and Biomedical Engineering, Indian Institute of Technology Indore, Simrol, Indore 453552, Madhya Pradesh, India
First published on 16th March 2018
Abstract
Herein, a novel water-stable luminescent terbium metal–organic framework, {[Tb(L1)(L2)0.5(NO3)(DMF)]·DMF}n (TPA-MOF), with 1,10-phenanthroline (phen) and 3,3′,5,5′-azobenzene-tetracarboxylic acid (H4abtc) ligands was solvothermally synthesized and structurally characterized. TPA-MOF possesses a two-dimensional (2D) extended framework featuring an 8-connected uninodal SP2-periodic net topology with the Schläfli point symbol of {3^12;4^14;5^2}. The π-electron rich luminescent TPA-MOF exhibits four characteristic emission bands of Tb3+ ion and acts as a selective and sensitive probe for acetone as well as the electron deficient 2,4,6-trinitrophenol (TNP). Moreover, gas sorption studies confirm that TPA-MOF displays ultra-micropores and adsorbs moderate amounts of N2 and CO2.
1. Introduction
The advancement of porous lanthanide metal–organic frameworks (Ln-MOFs) is a progressive area of research and has attracted significant attention in recent years not only due to the alluring topological structures but also the potential of Ln-MOFs as functional materials for catalysis, gas storage, separation, magnetism, drug delivery, luminescence, and nonlinear optics.1 The outstanding luminescence properties of Ln-MOFs, originating from ‘f–f’ transitions through the antenna effect of organic chromophores, make them more relevant candidates for chemical sensing.2 The selective and sensitive detection of hazardous materials is an important issue around the world. Small organic molecules (SOMs), particularly acetone, are air and water pollutants, and nitro-aromatic (NAC) explosives are the major components of various unexploded land mines worldwide.3 Among the numerous NAC explosives, 2,4,6-trinitrophenol (TNP) is a powerful explosive and toxic pollutant. Apart from this, its ingestion can cause critical health disorders such as skin allergies, anaemia, liver or kidney damage, and bladder tumour, which make it dangerous to human beings.4 Therefore, the fast detection of SOMs and NAC explosives is quite important for environmental safety, human health, and national security.5 Fluorescence quenching-based chemosensors have been extensively investigated for the detection of SOMs and NAC explosives due to their high sensitivity, cost efficiency, and portability.6 In the past few years, a very small number of luminescent Ln-MOFs have been discussed for the detection of acetone and TNP.7 In luminescent Ln-MOFs, delocalized π-electrons of organic chromophores increase electrostatic interactions between the MOF and electron-deficient NAC analytes; this results in fluorescence quenching of the initial intensity of the MOF. Moreover, the polymeric backbone of MOFs facilitates efficient exciton migration to intensify the sensitivity of MOFs in the detection.8 Hence, an appropriate choice of organic chromophores and metal ions plays a significant role in the fabrication of luminescent chemical sensors. In this regard, we have focused on the rigid 1,10-phenanthroline (phen) and 3,3′,5,5′-azobenzene-tetracarboxylic acid (H4abtc) ligands. Phen is a well-known light-harvesting organic chromophore, whereas H4abtc contains a photochromic azo group as well as a conjugated π-system that are beneficial to improve the luminescence properties.9 In addition, Ln-MOFs with 3,3′,5,5′-azobenzene-tetracarboxylic acid are quite less explored.10Herein, we present the synthesis of a new terbium metal–organic framework {[Tb(L1)(L2)0.5(NO3)(DMF)]·DMF}n (TPA-MOF) with phen (L1) and H4abtc (L2) organic ligands and its selective sensing for acetone and TNP through a fluorescence quenching mechanism. To the best of our knowledge, this is the first time that a phen and H4abtc ligands-based terbium metal–organic framework has been explored for the selective sensing of acetone and TNP in an aqueous solution.
2. Experimental
2.1. Materials and method
To perform all the experiments, reagents and solvents were procured from commercial sources and used without further purification. All solvents used were of standard spectroscopic grade. Tb(NO3)3·6H2O, 1,10-phenanthroline monohydrate (phen), nitrobenzene (NB), 1,3-dinitrobenzene (1,3-DNB), 4-nitrotoluene (4-NT), 2,4-dinitrotoluene (2,4-DNT), 2,4,6-trinitrotoluene (TNT), 4-nitrophenol (4-NP), 2,6-dinitrophenol (2,6-DNP), and 2,4,6-trinitrophenol (TNP) were purchased from Sigma-Aldrich Chemical Company, USA. 3,3′,5,5′-Azobenzene-tetracarboxylic acid (H4abtc) was synthesized according to a previous report with slight modifications11 and successfully characterized via infrared, NMR, and HRMS spectroscopy (Fig. S1–S4†). To carry out elemental analysis using Thermo Finnigan FLASH EA 1112, the purified ligand and MOF crystals were precisely dried under vacuum for a definite period. FT-IR spectra were obtained using a Bruker ALPHA FT-IR spectrometer in the wavelength range of 4000–400 cm−1. 1H and 13C NMR spectra were obtained using the JNM-ECZ500R/S1 500 MHz spectrometer, and the Bruker-Daltonics micrOTOF-Q II mass spectrometer was used to obtain HRMS. The Rigaku MiniFlex 600 XRD diffractometer with Cu Kα1 radiation (λ = 1.5406 Å) was used to obtain powder X-ray diffraction (PXRD) data at room temperature in the 2θ range of 5–50° at the scan speed of 5 deg per min. Thermogravimetry (TG) analysis was performed under N2 at 10 °C min−1 using Mettler Toledo TGA 1 together with Minichiller MT/230 and STARe software v13.00. The Shimadzu UV–2450 and Varian Cary Eclipse fluorescence spectrophotometers were used to obtain the absorption and fluorescence spectra, respectively. The emission spectrum of the solid sample was obtained using the Edinburgh FLS920 spectrophotometer.2.2. Synthesis of H4abtc (L2)
5-Nitroisophthalic acid (3.16 g, 15 mmol) and NaOH (4.88 g, 122 mmol) were dissolved in 40.0 mL water. Then, to this solution, dextrose (20 g) in 20 mL hot water was added slowly. The reaction mixture was refluxed at 85 °C for 24 h, and the resulting brown solution was cooled at 4 °C for 2–3 days to obtain a precipitate. The brown precipitate was filtered, dissolved in 50 mL water, and acidified with acetic acid, after which a yellow solid was obtained. The solid was filtered, washed with lots of hot water, and dried in air to afford 68.9% yield of the yellow powder. Anal. calcd. (%) for C16H10N2O8: C, 53.64; H, 2.81; N, 7.82; found: C, 53.51; H, 2.77; N, 7.69. FT-IR (KBr, cm−1): 3421, 3075, 2989, 2851, 2667, 2583, 1706, 1607, 1463, 1417, 1297, 1219, 1148, 1109, 930, 761, 683, 504. 1H NMR (500 MHz, DMSO-d6, ppm) δ: 8.53 (s, 2H, 4,6-H isoph.), 8.56 (s, 1H, 2-H isoph.), 13.56 (s, br, 2H, –COOH); 13C NMR (125 MHz, DMSO-d6, ppm) δ: 166.36, 152.198, 133.31, 133.02, 127.47. HRMS (ESI-TOF): m/z calculated for C16H10N2O8 381.0329 [M + nNa]; found 381.0322.2.3. Synthesis of TPA-MOF
A mixture of Tb(NO3)3·6H2O (0.09 g, 0.2 mmol), phen (0.04 g, 0.2 mmol), H4abtc (0.07 g, 0.2 mmol), triethylamine (0.08 g, 0.8 mmol), HNO3 (0.05 mL), DMF (5 mL), and H2O (0.5 mL) was magnetically stirred for 20 min at room temperature. The resulting mixture was placed in a Teflon-lined stainless-steel autoclave that was then heated at 120 °C for 72 h under autogenous pressure and then cooled down to room temperature at the rate of 1 °C h−1. Yellow-orange concave-shaped crystals were harvested in 61% yield (based on Tb3+)12 and washed with DMF/H2O and dried in air. Anal. calcd. (%) for C26H25N6O9Tb: C, 43.11; H, 3.48; N, 11.60. Found: C, 43.05; H, 3.41; N, 11.49. FT-IR (KBr, cm−1): 3426, 2925, 2366, 1612, 1442, 1384, 1321, 1256, 1141, 1103, 929, 779, 723, 670, 503.2.4. X-ray crystallography
The Bruker D8 Quest single crystal X-ray diffractometer with graphite monochromated MoKα radiation (λ = 0.71070 Å) and the PHOTON 100 CMOS detector were used to obtain the X-ray data. Lorentz-polarization and empirical absorption corrections were applied using the SAINT v7.34 and SADABS programs,13,14 respectively. The direct method was used to solve the crystal structure. Structure solution, refinement, data output, and other calculations were executed using the SHELXL 2014, PLATON 99, and SHELXTL program packages.15,16 Hydrogen atoms were placed at the geometrically calculated positions through a riding model, and non-hydrogen atoms were refined anisotropically. The DIAMOND software was used to create the crystal images and packing diagrams.17 Channel sizes were also calculated using the DIAMOND software,17 and the topology of the framework was explored using the TOPOS software.18 The crystallographic data, structure refinement parameters, selected bond lengths, and bond angles are listed in Table 1 and S1–S2.†| TPA-MOF | |
|---|---|
| a R1 = ∑‖Fo| − |Fc‖/∑|Fo|.b wR2 = {∑[w (Fo2 − Fc2)2]/∑w(Fo2)2}1/2. | |
| Formula | C26H25N6O9Tb |
| Mr | 724.45 |
| Crystal system | Triclinic |
| Space group | P![[1 with combining macron]](https://www.rsc.org/images/entities/char_0031_0304.gif) |
| A (Å) | 10.4848(4) |
| b (Å) | 10.6394(4) |
| c (Å) | 13.7737(5) |
| α (°) | 109.254(2) |
| β (°) | 100.428(2) |
| γ (°) | 108.162(2) |
| V (Å3) | 1307.48(9) |
| Z | 2 |
| DCalc (g cm−3) | 1.840 |
| μ (mm−1) | 2.772 |
| F (000) | 720 |
| θmax (°) | 2.145–28.315 |
| No. of unique reflections | 6491 |
| No. of observed reflections | 5654 |
| Data/restraints/parameters | 6491/0/383 |
| Goodness-of fit on F2 | 0.779 |
| Final R indices [I > 2σ(I)]a,b | |
| R1 | 0.0320 |
| wR2 | 0.0897 |
| R indices (all data) | |
| aR1 | 0.0432 |
| wR2 | 0.0897 |
| CCDC | 1533159 |
2.5. Computational analysis
Geometry optimization of the ligands (L1 and L2) and different nitroaromatic analytes was performed by applying the density functional theory (DFT) with the B3LYP/6-311G++ basis set in the Gaussian 09 program suite.19–21 The coordinates for geometry optimization are provided in the z-matrix form generated by GaussView 5.0. ChemCraft1.5 and GaussView 5.0 were also used to visualize the output files, perform theoretical calculations, and obtain electronic parameters for ligands (L1 and L2) and different nitro-aromatic analytes.2.6. Activation of the TPA-MOF
To conduct the gas adsorption measurements, a volumetric method using the Micromeritics ASAP 2020 instrument (0–1 bar pressure) and ultra-pure research-grade gases were used. The as-synthesized MOF was soaked in DCM for 12 h, and the supernatant DCM was poured off. Afterwards, fresh DCM was added to remove the free DMF present in the channel of the metal–organic framework, and this process was repeated several times. The resulting framework was dried under dynamic vacuum at 120 °C for 24 h. The observed metal–organic framework was free from lattice DMF molecules, as confirmed by the TG analysis.2.7. Preparation of the sample for photoluminescence sensing experiments
3. Results and discussion
Concave-shaped yellow crystals (yield 61%) of TPA-MOF were afforded from the stoichiometric combination of Tb(NO3)3·6H2O, L1, and L2 under solvothermal conditions (DMF/H2O) at 120 °C for 72 h and successfully characterized.3.1. Infrared spectrum
According to Fig. S5,† the FT-IR spectrum of TPA-MOF displays a transmittance peak at 1612 cm−1, which is due to the asymmetric stretching vibration of the carboxylic group (C![[double bond, length as m-dash]](https://www.rsc.org/images/entities/char_e001.gif) O). The weak absorption at 1442 cm−1 is ascribed to the νas(N
O). The weak absorption at 1442 cm−1 is ascribed to the νas(N![[double bond, length as m-dash]](https://www.rsc.org/images/entities/char_e001.gif) N) stretching vibration, whereas the aromatic C–H stretching band appears at 2925 cm−1 for L2 (H4abtc) in TPA-MOF. The C
N) stretching vibration, whereas the aromatic C–H stretching band appears at 2925 cm−1 for L2 (H4abtc) in TPA-MOF. The C![[double bond, length as m-dash]](https://www.rsc.org/images/entities/char_e001.gif) C and C
C and C![[double bond, length as m-dash]](https://www.rsc.org/images/entities/char_e001.gif) N ring stretching vibrations (1672–1384 cm−1) indicate the coordination of L1 (phen) to the Tb3+ metal centre. The bands in the region 1321–1256 cm−1 and 723, 779, and 847 cm−1 are attributed to the strong C–N stretching transmittance and out-of-plane hydrogen deformation vibrations of L1, respectively. The X-ray crystallographic analysis further confirmed the coordination behaviour of L1 and L2 with Tb3+.
N ring stretching vibrations (1672–1384 cm−1) indicate the coordination of L1 (phen) to the Tb3+ metal centre. The bands in the region 1321–1256 cm−1 and 723, 779, and 847 cm−1 are attributed to the strong C–N stretching transmittance and out-of-plane hydrogen deformation vibrations of L1, respectively. The X-ray crystallographic analysis further confirmed the coordination behaviour of L1 and L2 with Tb3+.
3.2. Structure elucidation
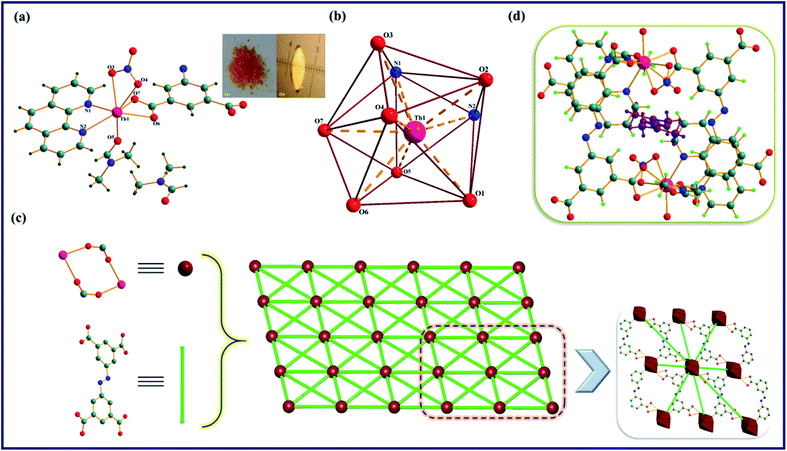
The TPA-MOF crystallizes in a triclinic system with the P![[1 with combining macron]](https://www.rsc.org/images/entities/char_0031_0304.gif) space group, and the asymmetric unit consists of one Tb3+ ion, one L1, half of an L2, one nitrate, one coordinated DMF, and one free DMF molecule in its lattice (Table 1, Fig. 1a and S6a in the ESI†). Tb3+ ion is nine coordinated and has a slightly distorted tricapped trigonal prism geometry with the TbO7N2 chromophore satisfied by four O atoms (O1, O2, O6, and O7) from three different tetra-carboxylate anions (abtc4−), two N atoms (N1 and N2) from the phen ligand, and three O atoms (O3, O4, and O5) from nitrate and coordinated DMF molecules with the bond distances of Tb1-O1, 2.284(2) Å; Tb1-O2, 2.347(3) Å; Tb1-O6, 2.486(3) Å; Tb1-O7, 2.401(3) Å; Tb1-N1, 2.537(3) Å; Tb1-N2, 2.599(3) Å; Tb1-O3, 2.537(3) Å; Tb1-O4, 2.474(3) Å; and Tb1-O5, 2.360(3) Å (Fig. 1b and S6b†). Further, the single crystal X-ray structure analysis suggests that the ligand L2 coordinates to Tb3+ ion in two different modes: one L2 acts as a bidentate ligand, whereas the other two are in a chelating-bridging mode (μ2-O), which may be corroborated from the disparity in the Tb–O bond distances of the coordinated abtc4−, and one bridged abtc4− exhibits a shorter distance than the other (Table S1, ESI†). Moreover, two proximate Tb3+ ions are conjugated to each other through two chelated tetra-carboxylate anions (abtc4−) to form a wheel-shaped (Tb2(COO)2) dimer with the Tb⋯Tb distance of 5.673 Å; this dimer is coupled with eight other identical dimeric units through bridged abtc4− ions and propagates a 2D extended metal–organic framework along the [100] plane with a pore size of 4 Å (Fig. 1c and S7, ESI†). As shown in Fig. 1d and S8,† TPA-MOF exhibits micro-channels with the dimensions of ∼10.64 × 6.03 Å2 along the ‘a’ axis that are incorporated by guest (DMF) molecules. Moreover, the PLATON analysis manifests that this MOF possesses moderately solvent-accessible voids of 17.5% (228.9 Å3 out of 1307.5 Å3) of its total volume. Thus, this entire metal–organic framework may be simplified as an 8-connected uninodal net having an SP2-periodic net topology with the Schläfli point symbol of {3^12;4^14;5^2} (Fig. 1c).
space group, and the asymmetric unit consists of one Tb3+ ion, one L1, half of an L2, one nitrate, one coordinated DMF, and one free DMF molecule in its lattice (Table 1, Fig. 1a and S6a in the ESI†). Tb3+ ion is nine coordinated and has a slightly distorted tricapped trigonal prism geometry with the TbO7N2 chromophore satisfied by four O atoms (O1, O2, O6, and O7) from three different tetra-carboxylate anions (abtc4−), two N atoms (N1 and N2) from the phen ligand, and three O atoms (O3, O4, and O5) from nitrate and coordinated DMF molecules with the bond distances of Tb1-O1, 2.284(2) Å; Tb1-O2, 2.347(3) Å; Tb1-O6, 2.486(3) Å; Tb1-O7, 2.401(3) Å; Tb1-N1, 2.537(3) Å; Tb1-N2, 2.599(3) Å; Tb1-O3, 2.537(3) Å; Tb1-O4, 2.474(3) Å; and Tb1-O5, 2.360(3) Å (Fig. 1b and S6b†). Further, the single crystal X-ray structure analysis suggests that the ligand L2 coordinates to Tb3+ ion in two different modes: one L2 acts as a bidentate ligand, whereas the other two are in a chelating-bridging mode (μ2-O), which may be corroborated from the disparity in the Tb–O bond distances of the coordinated abtc4−, and one bridged abtc4− exhibits a shorter distance than the other (Table S1, ESI†). Moreover, two proximate Tb3+ ions are conjugated to each other through two chelated tetra-carboxylate anions (abtc4−) to form a wheel-shaped (Tb2(COO)2) dimer with the Tb⋯Tb distance of 5.673 Å; this dimer is coupled with eight other identical dimeric units through bridged abtc4− ions and propagates a 2D extended metal–organic framework along the [100] plane with a pore size of 4 Å (Fig. 1c and S7, ESI†). As shown in Fig. 1d and S8,† TPA-MOF exhibits micro-channels with the dimensions of ∼10.64 × 6.03 Å2 along the ‘a’ axis that are incorporated by guest (DMF) molecules. Moreover, the PLATON analysis manifests that this MOF possesses moderately solvent-accessible voids of 17.5% (228.9 Å3 out of 1307.5 Å3) of its total volume. Thus, this entire metal–organic framework may be simplified as an 8-connected uninodal net having an SP2-periodic net topology with the Schläfli point symbol of {3^12;4^14;5^2} (Fig. 1c).
3.3. PXRD and thermogravimetric analysis
To validate the phase purity of the bulk material, powder X-ray diffraction was carried out, which confirmed that the experimental PXRD of the synthesized material was consistent with the corresponding simulated XRD pattern of the TPA-MOF (Fig. S9a, ESI†). TG analysis was conducted to examine the thermal stability of the TPA-MOF in the range of 25–800 °C under a N2 atmosphere at the heating rate of 10 °C min−1 (Fig. S10, ESI†). The thermogram displays the first weight loss (calculated 10%; observed 9.2%) corresponding to the release of free DMF molecules in the temperature range of 45–105 °C. The TPA-MOF was stable up to 185 °C, and the second weight loss (calculated 18.5%; observed 17.9%) was observed between 185 °C and 350 °C. In this step, the coordinated nitrate and DMF molecules are released. A sharp decrease is observed in the plot after 400 °C, which is attributed to the decomposition of the remaining framework.3.4. Gas sorption studies
Gas sorption studies were performed on the activated TPA-MOF at different temperatures. N2 adsorption shows a reversible type-I isotherm at 77 K, which is an important feature of microporous materials. As shown in Fig. 2a, the TPA-MOF adsorbs a moderate amount of N2 with an uptake of 13.6 cm3 g−1, and the Brunauer–Emmett–Teller (BET) surface area is found to be 179.3 m2 g−1. In addition, the sorption of N2 at 273 K is significantly less, which shows only a maximum uptake of 4.8 cm3 g−1 at 1 atmospheric pressure. This can be justified due to the small pore size (4 Å), solvent accessible void (228.9 Å3), and comparable kinetic diameter of N2 (3.64 Å). Furthermore, the low-pressure adsorption isotherms for CO2 were measured at 273 and 298 K. At 273 K, the uptake amount of CO2 is 32.5 cm3 g−1, whereas at 298 K, the uptake amount of CO2 is 17.1 cm3 g−1 (Fig. 2b). However, the pore sizes are ultra-microporous (0.4 nm) and still accessible to N2 and CO2; this is in good agreement with the conformational resilience of the L2 linker and concomitant flexibility of the porous framework. Although N2 (3.64 Å) and CO2 (3.3 Å) have similar kinetic diameters, the azo group (N![[double bond, length as m-dash]](https://www.rsc.org/images/entities/char_e001.gif) N) in L2 is responsible for the higher uptake of CO2 than N2, which provides potential coordination sites for CO2 that facilitate dipole–quadrupole interactions. This narrow pore accessibility implies extremely slow adsorption kinetics.
N) in L2 is responsible for the higher uptake of CO2 than N2, which provides potential coordination sites for CO2 that facilitate dipole–quadrupole interactions. This narrow pore accessibility implies extremely slow adsorption kinetics.
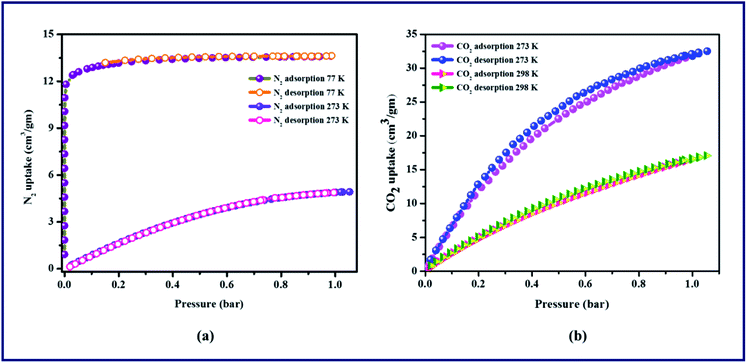 | ||
| Fig. 2 Gas adsorption isotherms of TPA-MOF: (a) N2 adsorption and desorption at 77 K and 273 K, (b) CO2 adsorption and desorption at 273 K and 298 K. | ||
3.5. Luminescence studies
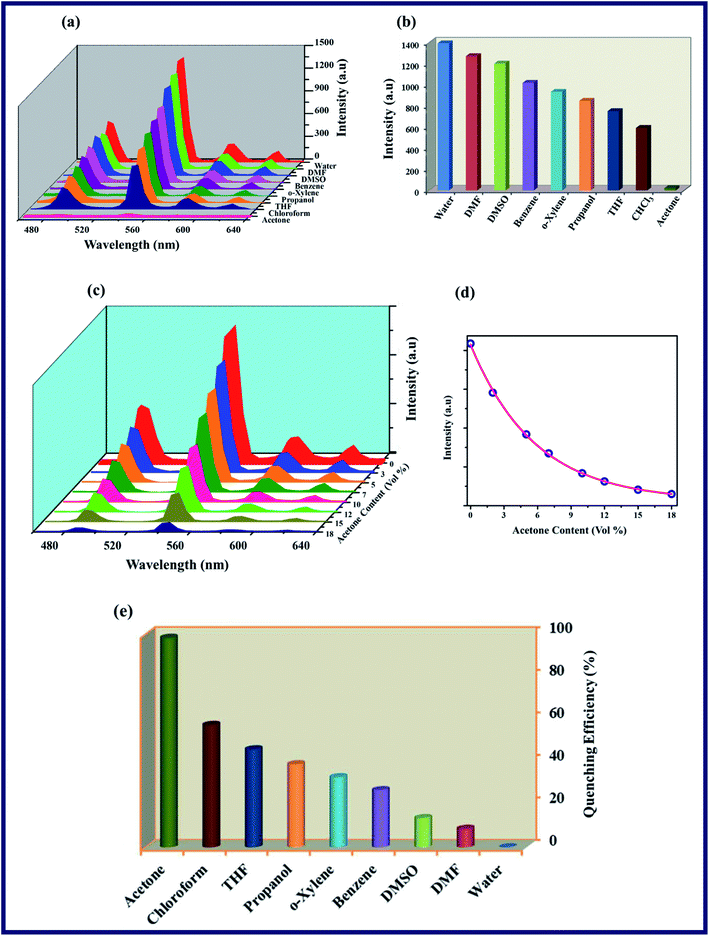
To investigate the luminescence properties of the TPA-MOF, the photo-luminescence spectra of the free ligands (L1 and L2) and TPA-MOF in the aqueous phase were measured at room temperature. The emission spectra of L1 and L2 display peaks at 361 (λex = 264 nm) and 388 nm (λex = 322 nm), respectively, which may be attributed to π → π* and n → π* transitions, whereas TPA-MOF exhibits four characteristic transitions of Tb3+ ion in the solid and solution states (λex = 264 nm) at 488 (5D4 → 7F6), 544 (5D4 → 7F5), 583 (5D4 → 7F4), and 619 nm (5D4 → 7F3), which can be associated with the existence of an efficient ligand-to-metal energy transfer process (Fig. S11 and S12, ESI†). Thus, the emissive nature of the water-stable TPA-MOF in the solid as well as aqueous phase prompted us to explore its potential for the sensing of SOMs and NAC explosives. The crystallinity of TPA-MOF in water was also confirmed via the PXRD analysis of the synthesized material dispersed for 4 days at 300 K (Fig. S9a†). Fig. 3a–c reveal that the luminescence intensity greatly depends on the solvent molecules such as DMF, DMSO, THF, CHCl3, propanol, acetone, benzene, and o-xylene, but exhibits a prominent fluorescence quenching effect by the gradual addition of acetone in a dispersed aqueous solution of TPA-MOF, and its luminescence almost vanishes at an acetone content of 18% (v/v). The plot of fluorescence intensity (5D4 → 7F5, 544 nm) versus acetone content (vol%) displays a first-order exponential decay (Fig. 3d), which indicates that the acetone quenching behaviour (98.4% QE; QE = quenching efficiency) of TPA-MOF is controlled by a diffusion process22 (Fig. 3e). We also performed the fluorescence quenching titration with chloroform, but no distinctive quenching effect was observed even at the chloroform content of 80% (v/v), as shown in Fig. S13.† The mechanism for the impressive quenching effect of acetone may also be elucidated based on the binding interactions of the –N![[double bond, length as m-dash]](https://www.rsc.org/images/entities/char_e001.gif) N– group of L2. The small size as well as strong intermolecular interactions (N⋯O) of acetone with L2 could be responsible for the notable fluorescence quenching of the TPA-MOF.7
N– group of L2. The small size as well as strong intermolecular interactions (N⋯O) of acetone with L2 could be responsible for the notable fluorescence quenching of the TPA-MOF.7
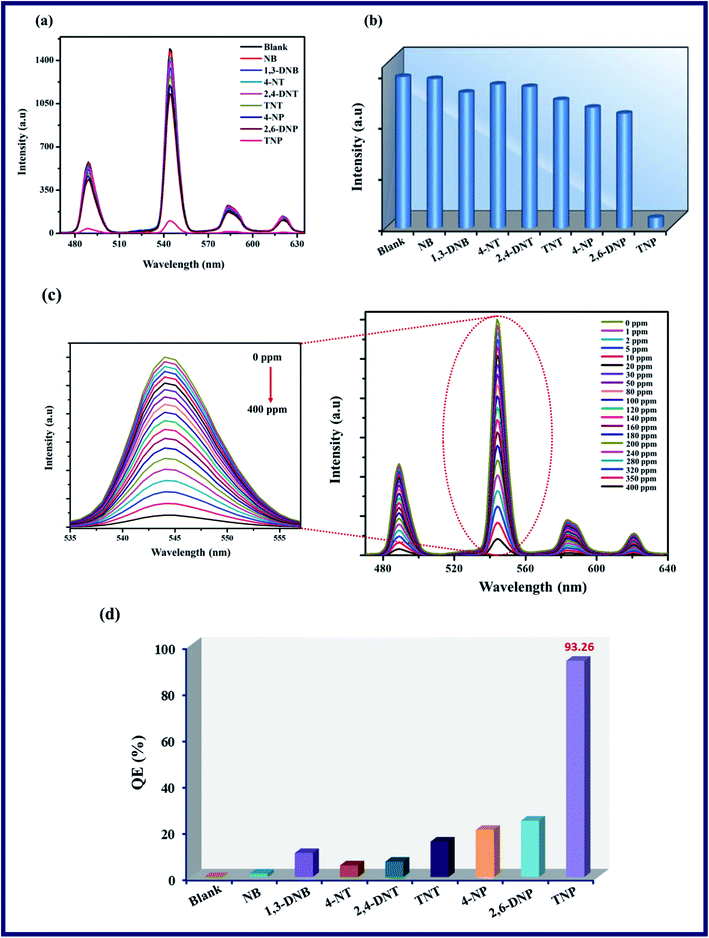
To evaluate the selective and sensing behaviour of TPA-MOF, a fluorescence quenching titration was performed with the addition of selected NAC explosives such as NB, 1,3-DNB, 4-NT, 2,4-DNT, TNT, 4-NP, 2,6-DNP, and TNP. Remarkable quenching in the fluorescence intensity was observed in the presence of TNP as compared to the case of other molecules (Fig. 4a and b). According to Fig. 4c, the fluorescence intensity progressively decreased with a steady increase in the concentration of TNP in the dispersed solution of TPA-MOF in water, and ultimately, the fluorescence intensity was almost totally quenched at 400 ppm of TNP with a quenching efficiency of 93.26%, as calculated according to η = (F0 − F)/F0 × 100%, where F0 and F are the luminescence intensities of the TPA-MOF before and after the addition of TNP, respectively. In contrast, the other NAC explosives exhibited minimal effects on the fluorescence intensity of TPA-MOF (Fig. 4d).
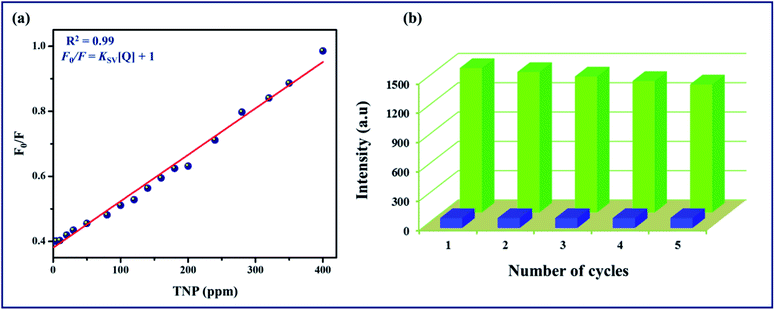
Furthermore, the quenching constant of TPA-MOF with TNP was determined using the Stern–Volmer equation (F0/F = Ksv[Q] + 1, where Ksv is the quenching constant and Q is the concentration of TNP), and the SV plot exhibited a nearly linear curve at very low concentrations (Fig. 5a). The very slight arc in the SV plot may be possibly due to mixed static and dynamic photo-induced electron transfer.23 From the fitted curve, the quenching constant was computed to be 15.97 ppm−1 (5.67 × 10⁵ M−1, ESI†). These results definitely establish the potential of TPA-MOF as a highly selective chemosensor for TNP, which is crucial for environmental monitoring. To the best of our knowledge, intense selective detection of TNP using a terbium metal–organic framework in an aqueous solution has not been reported to date (Table S4†). Moreover, the sensing ability of 2D TPA-MOF can be regenerated, and it can be reused for a significant number of cycles by centrifuging the dispersed solution after use and washing several times with diethyl ether (Fig. 5b). The results demonstrated that the initial fluorescence intensity was approximately recovered over repeated cycles, which suggested a high photostability of TPA-MOF for explosive detection applications. PXRD analysis also confirmed the retention of the structure even after immersing the TPA-MOF in an aqueous solution of TNP for 72 h and its reproducibility after five cycles (Fig. 6 and S9b, ESI†).
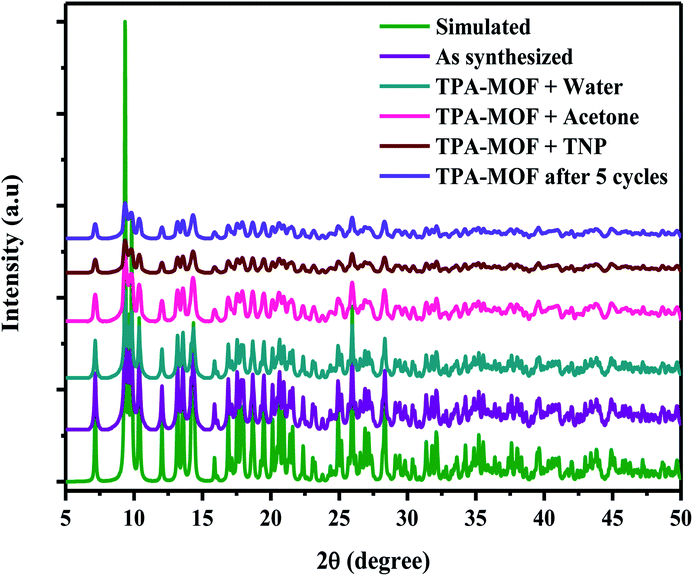 | ||
| Fig. 6 PXRD spectra obtained after immersion in H2O (4 days), acetone, and TNP for 72 h and recycled sample after five cycles. | ||
The encapsulation of TNP into the pores of TPA-MOF is ruled out due to the existence of very small pores (0.4 nm) within this MOF, which has been investigated via crystallographic and gas adsorption studies (Fig. S7† and 2). The dispersible nature of the finely ground TPA-MOF in water may be the reason for the adsorption of TNP on the surface of the MOF, which promotes fluorescence quenching and photo-induced electron transfer from the excited TPA-MOF to the electron-deficient TNP through interspecies contacts.24 These observations were also investigated using the HOMO and LUMO orbital energies of L1, L2, and NAC explosives, as calculated by the density functional theory (ESI†). According to Fig. 7, the lowest unoccupied molecular orbital (LUMO) of L1 (−1.67052 eV) lies at a higher energy level than those of L2 (−3.4398 eV) and selected NAC analytes (−2.42 to −4.05 eV). However, both ligands (L1 and L2) have higher LUMO energies than TNP; thus, electrons can move easily from the excited TPA-MOF (electron donor) to the electron-deficient analytes (electron acceptor), and this facilitates fluorescence quenching.25
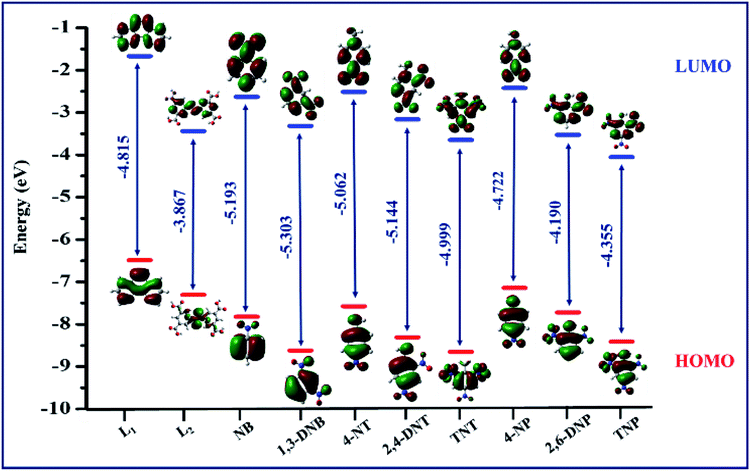 | ||
| Fig. 7 HOMO (red) and LUMO (blue) energy level diagram for the ligands (L1 and L2) and NAC analytes. | ||
However, the electron-withdrawing ability of TNP is very poor; this demonstrates that the photo-induced electron transfer is not the sole mechanism.7 A long-range energy transfer mechanism also plays a major role in the quenching of the fluorescence intensity that may be attributed to the electrostatic interaction between TNP and TPA-MOF.26 The ligand L1 forms an intermolecular hydrogen bonded complex with TNP that is involved in the diffusion of TNP over TPA-MOF; this leads to excellent quenching through appropriate host–guest interactions;26 thus, both photo-induced electron and energy transfer mechanisms occur in the fluorescence quenching of the present TPA-MOF.
4. Conclusions
In summary, a dual-functional, 2D luminescent Tb(III) metal–organic framework (TPA-MOF) with an SP2-periodic net topology using phen and H4abtc ligands was synthesized. The water-stable TPA-MOF displays a strong fluorescence emission, which may be due to the antenna effect. This indicates emphatic energy transfer from the ligands to Tb3+ ion and shows not only excellent fluorescence quenching by the gradual addition of acetone but also significant selective sensing towards TNP over other nitro-aromatic explosives. This sensing ability demonstrates the distinguished application of TPA-MOF as an efficient fluorescent sensor for the detection of small organic pollutant molecules as well as nitro-aromatic analytes, and its advantages make it highly feasible for practical use.Conflicts of interest
There are no conflicts to declare.Acknowledgements
N. G gratefully acknowledges the financial support received from the Department of Science and Technology, New Delhi, Government of India (Fast Track Project No. SB/FT/CS-059/2012). N. G is highly thankful to N. K who carried out the computational analysis. Author also thanks JNU, New Delhi, BHU, Varanasi, and IIT Indore for providing instrumental facilities.References
- (a) H. C. Zhou, J. R. Long and O. M. Yaghi, Chem. Rev., 2012, 112, 673–674 CrossRef CAS PubMed; (b) Y. Cui, Y. Yue, G. Qian and B. Chen, Chem. Rev., 2012, 112, 1126–1162 CrossRef CAS PubMed; (c) T. Kundu, S. Mitra, P. Patra, A. Goswami, D. Diaz and R. Banerjee, Chem.–Eur. J., 2014, 20, 10514–10518 CrossRef CAS PubMed; (d) J. Liu, L. Chen, H. Cui, J. Zhang, L. Zhang and C.-Y. Su, Chem. Soc. Rev., 2014, 43, 6011–6061 RSC; (e) R. J. Blagg, L. Ungur, F. Tuna, J. Speak, P. Comar, D. Collison, W. Wernsdorfer, E. J. McInnes, L. F. Chibotaru and R. E. Winpenny, Nat. Chem., 2013, 5, 673–678 CrossRef CAS PubMed; (f) X. Liang, F. Zhang, H. Zhao, W. Ye, L. Long and G. Zhu, Chem. Commun., 2014, 50, 6513–6516 RSC; (g) L.-N. Sun, J. Yu, H. Peng, J. Z. Zhang, L.-Y. Shi and O. S. Wolfbeis, J. Phys. Chem. C, 2010, 114, 12642–12648 CrossRef CAS; (h) L. Sun, T. Liu, Y. Qiu, J. Liu, L. Shi and O. S. Wolfbeis, Microchim. Acta, 2014, 181, 775–781 CrossRef CAS.
- (a) S. V. Eliseeva and J.-C. G. Bunzli, Chem. Soc. Rev., 2010, 39, 189–227 RSC; (b) Z. Dou, J. Yu, Y. Cui, Y. Yang, Z. Wang, D. Yang and G. Qian, J. Am. Chem. Soc., 2014, 136, 5527–5530 CrossRef CAS PubMed; (c) Q. L. Zhu and Q. Xu, Chem. Soc. Rev., 2014, 43, 5468–5512 RSC.
- (a) D. Vallero, Fundamentals of Air Pollution, Academic Press, Cambridge, 4th edn, 2007 Search PubMed; (b) M. E. Germain and M. J. Knapp, Chem. Soc. Rev., 2009, 38, 2543–2555 RSC.
- (a) J. Akhavan, Chemistry of Explosives, Royal Society of Chemistry, London, 2nd edn, 2004 Search PubMed; (b) P. G. Thorne and T. F. Jenkins, Field Anal. Chem. Technol., 1997, 1, 165–170 CrossRef; (c) K. M. Wollin and H. H. Dieter, Arch. Environ. Contam. Toxicol., 2005, 49, 18–26 CrossRef CAS PubMed; (d) R. Mantha, K. E. Taylor, N. Biswas and J. K. Bewtra, Environ. Sci. Technol., 2001, 35, 3231–3236 CrossRef CAS PubMed; (e) F. D. Marvin-Sikkema and J. A. de Bont, Appl. Microbiol. Biotechnol., 1994, 42, 499–507 CrossRef CAS PubMed; (f) G. He, H. Peng, T. Liu, M. Yang, Y. Zhang and Y. Fang, J. Mater. Chem., 2009, 19, 7347–7353 RSC; (g) N. Goel and N. Kumar, Inorg. Chim. Acta, 2017, 463, 14–19 CrossRef CAS.
- (a) Z. Hu, B. J. Deibert and J. Li, Chem. Soc. Rev., 2014, 43, 5815–5840 RSC; (b) Y. Salinas, R. Martinez-Manez, M. D. Marcos, F. Sancenon, A. M. Costero, M. Parra and S. Gil, Chem. Soc. Rev., 2012, 41, 1261–1296 RSC; (c) S. Mukherjee, A. V. Desai, A. I. Inamdar, B. Manna and S. K. Ghosh, Cryst. Growth Des., 2015, 15, 3493–3497 CrossRef CAS.
- (a) W. Xue, Y. Zhang, J. Duan, D. Liu, Y. Ma, N. Shi, S. Chen, L. Xie, Y. Qian and W. Huang, J. Mater. Chem. C, 2015, 3, 8193–8199 RSC; (b) B. Gole, A. K. Bar and P. S. Mukherjee, Chem. Commun., 2011, 47, 12137–12139 RSC; (c) X. Deng and D. Wu, RSC Adv., 2014, 4, 42066–42070 RSC.
- (a) L. Z. Yang, J. Wang, A. M. Kirillov, W. Dou, C. Xu, R. Fang, C. L. Xu and W. S. Liu, CrystEngComm, 2016, 18, 6425–6436 RSC; (b) W. Liu, X. Huang, C. Xu, C. Chen, L. Yang, W. Dou, W. Chen, H. Yang and W. Liu, Chem.–Eur. J., 2016, 22, 18769–18776 CrossRef CAS PubMed; (c) J. H. Qin, B. Ma, X. F. Liu, H. L. Lu, X. Y. Dong, S. Q. Zang and H. Hou, Dalton Trans., 2015, 44, 14594–14603 RSC; (d) R. Fu, S. Hu and X. Wu, J. Mater. Chem. A, 2017, 5, 1952–1956 RSC; (e) J. Qin, B. Ma, X. F. Liu, H. L. Lu, X. Y. Dong, S. Q. Zang and H. Hou, J. Mater. Chem. A, 2015, 3, 12690–12697 RSC; (f) J. D. Xiao, L. G. Qiu, F. Ke, Y. P. Yuan, G. S. Xu, Y. M. Wang and X. Jiang, J. Mater. Chem. A, 2013, 1, 8745–8752 RSC; (g) G. X. Wen, M. L. Han, X. Q. Wu, Y. P. Wu, W. W. Dong, J. Zhao, D. S. Li and L. F. Ma, Dalton Trans., 2016, 45, 15492–15499 RSC; (h) S. Wang, T. Cao, H. Yan, Y. Li, J. Lu, R. Ma, D. Li, J. Dou and J. Bai, Inorg. Chem., 2016, 55, 5139–5151 CrossRef CAS PubMed; (i) H. Li, W. Shi, K. Zhao, Z. Niu, H. Li and P. Cheng, Chem.–Eur. J., 2013, 19, 3358–3365 CrossRef CAS PubMed.
- (a) J. S. Yang and T. M. Swager, J. Am. Chem. Soc., 1998, 120, 5321–5322 CrossRef CAS; (b) A. Rose, Z. Zhu, C. F. Madigan, T. M. Swager and V. Bulovic, Nature, 2005, 434, 876–879 CrossRef CAS PubMed; (c) S. W. Thomas, G. D. Joly and T. M. Swager, Chem. Rev., 2007, 107, 1339–1386 CrossRef CAS PubMed.
- (a) D. Liu, H. Yu, Z. Wang and Q. Nie, Polym. Int., 2010, 59, 937–944 CrossRef CAS; (b) S. Zhang, J. Ma, X. Zhang, E. Duan and P. Cheng, Inorg. Chem., 2015, 54, 586–595 CrossRef CAS PubMed.
- (a) P. Y. Du, W. Gu and X. Liu, CrystEngComm, 2016, 18, 5140–5148 RSC; (b) P. Y. Du, H. Li, X. Fu, W. Gu and X. Liu, Dalton Trans., 2015, 44, 13752–13759 RSC; (c) S. Zhang, E. Duan and P. Cheng, J. Mater. Chem. A, 2015, 3, 7157–7252 RSC.
- A. Lan, M. Padmanabhan, K. Li, H. Wu, T. J. Emge, M. Hong and J. Li, Inorg. Chim. Acta, 2011, 366, 68–75 CrossRef CAS.
- (a) S. Sanram, J. Boonmak and S. Youngme, Inorg. Chim. Acta, 2018, 469, 11–19 CrossRef CAS; (b) S.-N. Zhao, X. Z. Song, M. Zhu, X. Meng, L. L. Wu, S. Y. Song, C. Wang and H.-J. Zhang, RSC Adv., 2015, 5, 93–98 RSC.
- SAINT version 7.34, software for the integration of CCD detector system, Bruker analytical X-ray systems, Madison, Wisconsin, USA, 2004 Search PubMed.
- G. M. Sheldrick, SADABS Version 2.10, Program for Adsorption Corrections, Institute for Inorganic Chemistry, University of Göttingen, Germany, 1996 Search PubMed.
- G. M. Sheldrick, Acta Crystallogr., Sect. A: Found. Crystallogr., 1990, 46, 467–473 CrossRef.
- G. M. Sheldrick, SHELXTL-NT Version 6.12, Reference Manual, University of Göttingen, Germany, 2000 Search PubMed.
- B. Klaus, DIAMOND Version 1.2c, University of Bonn, Bonn, Germany, 1999 Search PubMed.
- V. A. Blatov, IUCrCompComm. Newsletter, 2006, 7, 4–38 Search PubMed.
- Gaussian 03, Rev. C.02, Gaussian, Inc., Wallingford CT, 2004 Search PubMed.
- P. C. Hariharan and J. A. Pople, Theor. Chim. Acta, 1973, 28, 213–222 CrossRef CAS.
- A. Frisch, A. B. Nielsen and A. J. Holder, GaussView Users Manual, Gaussian Inc., Wallingford CT, 2003 Search PubMed.
- (a) S. Dang, X. Min, W. Yang, F. Y. Yi, H. You and Z. M. Sun, Chem.–Eur. J., 2013, 9, 17172–17179 CrossRef PubMed; (b) X. Wang, L. Zhang, J. Yang, F. Liu, F. Dai, R. Wang and D. Sun, J. Mater. Chem. A, 2015, 3, 12777–12785 RSC; (c) J. M. Zhou, W. Shi, H. M. Li, H. Li and P. Cheng, J. Phys. Chem. C, 2014, 118, 416–426 CrossRef CAS.
- (a) D. Masih, S. M. Aly, E. Alarousu and O. F. Mohammed, J. Mater. Chem. A, 2015, 3, 6733–6738 RSC; (b) A. O. El-Ballouli, E. Alarousu, M. Bernardi, S. M. Aly, A. P. Lagrow, O. M. Bakr and O. F. Mohammed, J. Am. Chem. Soc., 2014, 136, 6952–6959 CrossRef CAS PubMed; (c) K. Acharyya and P. S. Mukherjee, Chem. Commun., 2014, 50, 15788–15791 RSC.
- (a) D. Singh and C. M. Nagaraja, Dalton Trans., 2014, 43, 17912–17915 RSC; (b) D. Singh and C. M. Nagaraja, Cryst. Growth Des., 2015, 15, 3356–3365 CrossRef CAS; (c) T. K. Kim, J. H. Lee, D. Moon and H. R. Moon, Inorg. Chem., 2013, 52, 589–595 CrossRef CAS PubMed.
- (a) X. Zhou, H. Li, H. Xiao, L. Li, Q. Zhao, T. Yang, J. Zuo and W. Huang, Dalton Trans., 2013, 42, 5718–5723 RSC; (b) Y. N. Gong, L. Jiang and T. B. Lu, Chem. Commun., 2013, 49, 11113–11115 RSC; (c) G. Y. Wang, C. Song, D. M. Kong, W. J. Ruan, Z. Chang and Y. Li, J. Mater. Chem. A, 2014, 2, 2213–2220 RSC.
- (a) B. Joarder, A. V. Desai, P. Samanta, S. Mukherjee and S. K. Ghosh, Chem.–Eur. J., 2015, 21, 965–969 CrossRef CAS PubMed; (b) S. S. Nagarkar, A. V. Desai and S. K. Ghosh, Chem. Commun., 2014, 50, 8915–8918 RSC; (c) J. Ye, L. Zhao, R. F. Bogale, Y. Gao, X. Wang, X. Qian, S. Guo, J. Zhao and G. Ning, Chem.–Eur. J., 2015, 21, 2029–2037 CrossRef CAS PubMed; (d) N. Goel and U. P. Singh, J. Phys. Chem. A, 2013, 117, 10428–10437 CrossRef CAS PubMed.
Footnotes |
| † Electronic supplementary information (ESI) available: FT-IR, 1H and 13C NMR, HRMS, crystal structures, TG pattern, UV-vis and fluorescence studies, crystallographic bond lengths, bond angles, and DFT data. CCDC 1533159. For ESI and crystallographic data in CIF or other electronic format see DOI: 10.1039/c7ra13494k |
| ‡ Present address: Department of Chemistry, Institute of Science, Banaras Hindu University, Varanasi 221005, Uttar Pradesh, India. Email: E-mail: nidhigoel.chem@bhu.ac.in. |
| This journal is © The Royal Society of Chemistry 2018 |

