 Open Access Article
Creative Commons Attribution 3.0 Unported Licence
Synthesis and spectroscopic studies of functionalized graphene quantum dots with diverse fluorescence characteristics
Varun A. Chhabraab,
Rajnish Kaurc,
Naveen Kumarad,
Akash Deep *d,
Changanamkandath Rajesh*b and
Ki-Hyun Kim
 *e
*e
aCentre for Development of Advanced Computing(C-DAC), Phase VIII, Mohali 160071, India
bSri Guru Granth Sahib World University (SGGSWU), Fatehgarh Sahib 140406, India. E-mail: rajeshc@sggswu.org
cDepartment of Physics, Panjab University, Sector 14, Chandigarh, 160014, India
dCentral Scientific Instruments Organization (CSIR-CSIO), Sector 30 C, Chandigarh, 160030, India. E-mail: dr.akashdeep@gmail.com
eDepartment of Civil and Environmental Engineering, Hanyang University, 222 Wangsimni-Ro, Seoul 04763, Korea. E-mail: kkim61@hanyang.ac.kr
First published on 22nd March 2018
Abstract
In this research, we report a facile method for synthesizing a series of carboxyl functionalized graphene quantum dots (GQDs) using graphite flakes (300 meshes) as raw material. These highly luminescent GQDs emitted blue, light blue, green, yellow, and red light (400–700 nm intensity peaks) under ultraviolet irradiation conditions, while exhibiting quantum yields in the range of 50–70%. The products were comprehensively characterized using ultraviolet-visible, photoluminescence, infrared, Raman, and dynamic light scattering spectroscopies. The GQDs were found to remain highly stable against photobleaching when stored over a prolonged period of more than three months. The proposed method for the synthesis of high quality, multicolor GQDs can be utilized to extend the application of these nanoparticles to molecular biotechnology and bioengineering; for example, the immobilization of cancer markers on their surface. As such, carboxylic acid groups present on the surface of these GQDs help create complexes for in vivo sensing applications.
1. Introduction
Single-layer graphene is a single-atom-thick material with a unique structure comprised of a honeycomb lattice with atoms arranged in sp2 hybridization. Graphene is characterized by excellent electronic properties. Graphene structures have also been demonstrated to show photoluminescent properties by tuning of the band gap.1–4 Such modifications can be made possible by creating edge defects or via tuning of the shape and size of the material.5In recent years, graphene quantum dots (GQDs) have rapidly emerged as one of the most prominent luminescent carbon nanomaterials.6 They exhibit some advantageous properties compared to other fluorescent nanoparticles (e.g., improved biocompatibility, excellent photostability, low cytotoxicity, and confined emission of energy). As GQDs are capable of emitting two photons in a single excitation event, they can produce coherent light, which is important in the generation of lasers.7,8 Because of these advantageous properties, GQDs find applications in the fields of sensors,9 light (energy-from high to low frequency) conversion,10 photocatalysis,11 cell or bio imaging,12,13 and photovoltaics.14
GQDs can be synthesized via either “top-down” or “bottom-up” approaches. However, most of the time, the former strategy is limited by various factors including poor control of product size, low quantum yield, tedious synthesis processes, and the need for special equipment. In these methods, a relatively low quantum yield of produced GQDs could restrict their utility in photovoltaic, optoelectronics, and sensing applications.15–18 The latter methods (bottom-up) are feasible to exert better control of the product's properties (e.g., lattice dimensions, size distribution, and morphology). These methods basically involve the carbonization of organic precursors through thermal treatment.
The potential of GQDs for multicolor emissions has a number of technological significances and scientific interests.10 Once suitably developed, the extraordinarily attractive GQDs can be bound with other materials or components to further extend their application to such areas as optoelectronics, photovoltaics, and sensors.19–21 However, the synthesis of size controlled GQDs is a challenging task to meet conditions for the creation of surface emitting states. The available literature on the synthesis of multicolor GQDs mainly describes the doping of extraneous elements within the graphene hexagonal matrix.22–24 Generally, these methods involve treatment of GO with a mixture of NH4OH and H2O2 for long time intervals (such as 40, 120, and 270 min) to yield GQDs with different colors.
Numerous methods have been developed and employed to convert graphene-based materials into fluorescent GQDs. Further, the bandgap of GQDs can be tuned by changing the particle size and surface chemistry. Top-down approaches include hydrothermal (or solvothermal) cutting, electrochemical scissoring, nanolithography, microwave-assisted breaking, cage opening treatments of fullerene, and chemical exfoliation.25–28 GQDs prepared from these processes tend to exhibit poor solubility as they have heterogeneous structures and typically do not possess functional groups. On the other hand, bottom-up approaches are comparatively complex due to solution chemistry or carbonization and involve the use of organic solvents, which leads to a large quantity of waste. Bottom-up approaches include the assembly of GQDs from molecular precursors through hydrothermal methods, precursor pyrolysis, and metal catalyzed decomposition of materials like graphite, graphene sheets, and C60.15,19,29,30
As available information reveals, most of the reported methods for the synthesis of multicolor GQDs involve the application of sophisticated equipment, high-temperature synthesis conditions, or high-energy laser ablation. In this work, we propose a new method for the synthesis of graphene quantum dots that is highly advantageous in terms of simplicity, reproducibility, and high yield. In the present research, we demonstrate a much easier and highly effective method to synthesize multicolor GQDs with high quantum yields.
Table 1 lists the key points and novelty of the present method.
| Order | Samples | Reference | Change | Reason |
|---|---|---|---|---|
| 1 | B-GQDs | 58 | High fluorescence toward a blue shift | High reaction temperature and dialyzed solution |
| 2 | I-GQDs | 59 | High fluorescence | Subsequent dialysis |
| 3 | G-GQDs | 58 | High yield | Small amount of oxidizing agent and lower reaction temperature |
| 4 | Y-GQDs | 60 | Improved upconversion properties | |
| 5 | R-GQDs | 61 | Low yield and feeble fluorescence | Facile but efficient synthesis with two functionalized groups in GQD solution |
2. Experimental
2.1 Materials and equipment
The chemicals used in the course of the study included graphite flakes (300 mesh), sulfuric acid (H2SO4), potassium permanganate (K2MnO4), hydrogen peroxide (H2O2), hydrochloric acid (HCl), sodium hydroxide (NaOH), citric acid (CA), sodium nitrate (NaNO3), and urea. All of these chemicals with a high purity were purchased from Sigma (India)/Merck (India). Characterization of the synthesized materials was performed with various instruments: photoluminescence (PL) spectroscope (Varian Cary), Ultraviolet-Visible (UV-Vis) spectroscope (Varian Cary 5000), Fourier transform infrared (FTIR) spectroscope (Nicolet iS10), Raman spectroscope (Invia, Renishaw), and dynamic light scattering (DLS) spectroscope (Nano ZS90, Malvern).2.2 Procedure
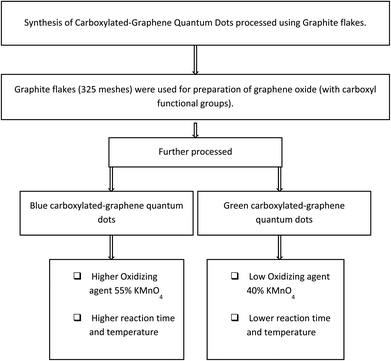
Procedural details of the experiments conducted are explained further in this section; here Fig. 1 presents the generic methodology for the formation of GQDs, and the Fig. 2 flow chart shows the method for production of B-GQDs and G-GQDs.As elaborated in Section 2.2.3–2.2.7, the products of GQDs were purified each time with dialysis procedure. Note that such purification approach for GQDs (from their starting precursors) was reported to be employed in many earlier studies as well.31–33
3. Results & discussion
3.1 Spectroscopic characterization of GQDs samples
The formation of GQDs was a result of hydrothermal exfoliation of the raw materials (GO or CA). The application of potassium permanganate in acidic solution is associated with the oxidation of alkenes, which is the basis of the mechanism that results in the formation of G-GQDs and B-GQDs34,35 In this process, a manganate ester is first formed, which acts as the rate determining step. The formation of GQDs from this kind of mechanism is thoroughly explained in earlier literature.36–41 Thus, different sized GQDs can be obtained by varying the extent of the oxidation reaction.Note that the carboxyl groups in the formed GQDs function as trapping sites or defect states, which can alter the LUMO energy states that influence the emission wavelengths even when the sample is excited by an unchanged UV energy wavelength. Thus, it is possible to obtain a range of visible spectra by varying the size of the synthesized GQDs. Similar to other carbon luminescent nanoparticles, the GQDs also show excitation-dependent photoluminescence behavior; a red shift was observed in the emissive wavelength when a lower wavelength energy was used for the excitation of samples.42–44 The GQDs prepared in this work also showed excitation-dependent photoluminescence behavior. The PL peak wavelengths were shifted at different excitation wavelengths due to the different scales of the quantum confinement effects with different nanoparticle sizes. A variation in the excitation energy led to changes in the intrinsic and extrinsic states of GQDs at different excitation energies. As a result, their PL spectra were found to be shifted.45,46
3.2 FTIR analysis of GQD samples
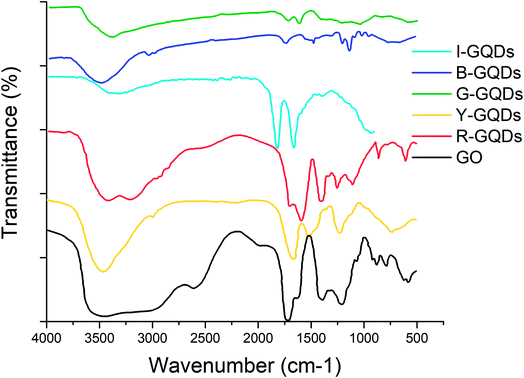
FTIR studies were carried out to study the presence of functional groups on the synthesized GQDs. The presence of –C![[double bond, length as m-dash]](https://www.rsc.org/images/entities/char_e001.gif) O groups was evident on both the starting (i.e., graphene oxide) and final (GQDs) samples. Signals for the stretching vibration of –C–O–C (below 1250 cm−1) and absorption of C–H stretching vibrations (at 2950 cm−1) were also observed in G-GQDs. The G-GQD sample also displayed FTIR bands at around 1550 cm−1 (skeletal vibration of aromatic rings) and 3050 cm−1 (stretching vibration of C–H in aromatic rings).13,25 However, the B-GQD sample did not show any absorption of –C–O–C.
O groups was evident on both the starting (i.e., graphene oxide) and final (GQDs) samples. Signals for the stretching vibration of –C–O–C (below 1250 cm−1) and absorption of C–H stretching vibrations (at 2950 cm−1) were also observed in G-GQDs. The G-GQD sample also displayed FTIR bands at around 1550 cm−1 (skeletal vibration of aromatic rings) and 3050 cm−1 (stretching vibration of C–H in aromatic rings).13,25 However, the B-GQD sample did not show any absorption of –C–O–C.
The I-GQD sample showed a band around 3320 cm−1 assigned to the hydroxyl (O–H) group stretching vibration, while the signal around 2900 cm−1 was attributed to symmetric and asymmetric stretching of C–H. The bending vibrations of the C![[double bond, length as m-dash]](https://www.rsc.org/images/entities/char_e001.gif) C group were related to an observed band at 1819 cm−1. The C–O (alkoxy), C–O (carboxy), and C
C group were related to an observed band at 1819 cm−1. The C–O (alkoxy), C–O (carboxy), and C![[double bond, length as m-dash]](https://www.rsc.org/images/entities/char_e001.gif) O (carboxyl) groups can be assigned to bands at 1389, 1660, and 2008 cm−1, respectively.
O (carboxyl) groups can be assigned to bands at 1389, 1660, and 2008 cm−1, respectively.
The FTIR spectra of Y-GQDs showed the presence of C![[double bond, length as m-dash]](https://www.rsc.org/images/entities/char_e001.gif) C bond vibration at 1661 cm−1, while a strong band at 3462.69 cm−1 can be assigned to hydroxyl (O–H) groups. The C–O stretching vibration was assigned to the band at 1235 cm−1. The presence of C–H and C–OH stretching vibrations was related to a signal at 1523.46 cm−1. As quantum dots formed after cleavage of sp2 domains of graphene oxide, the Y-GQD sample also showed the presence of –COOH and –OH groups.
C bond vibration at 1661 cm−1, while a strong band at 3462.69 cm−1 can be assigned to hydroxyl (O–H) groups. The C–O stretching vibration was assigned to the band at 1235 cm−1. The presence of C–H and C–OH stretching vibrations was related to a signal at 1523.46 cm−1. As quantum dots formed after cleavage of sp2 domains of graphene oxide, the Y-GQD sample also showed the presence of –COOH and –OH groups.
The FTIR spectra of R-GQDs showed the presence of C![[double bond, length as m-dash]](https://www.rsc.org/images/entities/char_e001.gif) C, C
C, C![[double bond, length as m-dash]](https://www.rsc.org/images/entities/char_e001.gif) O, and O–H bonds via the observation of bands around 1690, 1589, and 3416 cm−1, respectively. The stretching vibrations of oxygen-related groups in GQDs were much more intense than in GO.47 The appearance of a band around 1403 cm−1 was due to C–N absorption. The presence of a band around 3202 cm−1 was associated with the N–H stretching vibration of amine groups, demonstrating successful incorporation of nitrogen atoms (due to aniline) into the GQDs. The aqueous stability of different samples of synthesized GQDs was favored by the presence of carboxyl (–COOH) and hydroxyl (–OH) groups (Fig. 3).
O, and O–H bonds via the observation of bands around 1690, 1589, and 3416 cm−1, respectively. The stretching vibrations of oxygen-related groups in GQDs were much more intense than in GO.47 The appearance of a band around 1403 cm−1 was due to C–N absorption. The presence of a band around 3202 cm−1 was associated with the N–H stretching vibration of amine groups, demonstrating successful incorporation of nitrogen atoms (due to aniline) into the GQDs. The aqueous stability of different samples of synthesized GQDs was favored by the presence of carboxyl (–COOH) and hydroxyl (–OH) groups (Fig. 3).
3.3 Raman spectroscopic analysis
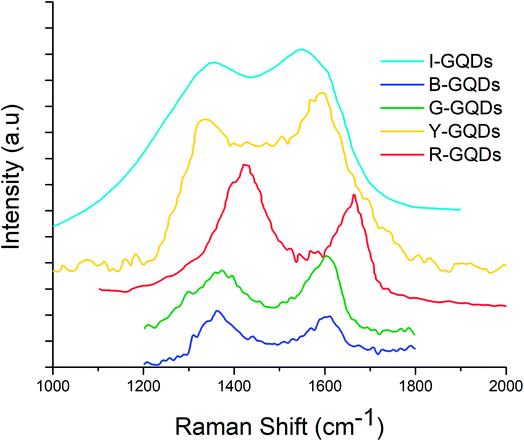
Raman spectroscopy is a vital technique to assess the quality of synthesized GQDs. The D and G band features reveal important information about the successful formation of the desired quantum dots. These bands are associated with disorder and defects in the hexagonal lattice (D band) and sp2 carbon atom vibrations (G band). The ratio of the intensity of these bands (ID/IG ratio) is used to express the extent of sp2/sp3 hybridization of carbon atoms.14,48Raman spectra of the synthesized G-GQDs and B-GQDs are shown in Fig. 4. The G-GQDs display the presence of ‘D’ (1367 cm−1) and ‘G’ (1611 cm−1) bands with a higher ID/IG ratio (0.99) than B-GQDs (0.97). The peak positions of the D and G bands in B-GQDs were observed at 1372 and 1598 cm−1, respectively. The I-GQD sample also showed the presence of D (1352 cm−1) and G (1549 cm−1) bands, with an ID/IG ratio of 0.86. The Y-GQDs were characterized by D and G bands at 1334 and 1597 cm−1, respectively, and an ID/IG ratio of 0.89. Similarly, the R-GQD sample yielded characteristic D and G bands around 1442 and 1665.95 cm−1, respectively, with an ID/IG value of 0.81. The Raman spectra of all synthesized GQDs displayed two prominent peaks about 1340 cm−1 and 1581 cm−1, which correspond to the D and G bands and confirm the successful synthesis of GQDs.49
3.4 UV-Vis absorption analysis
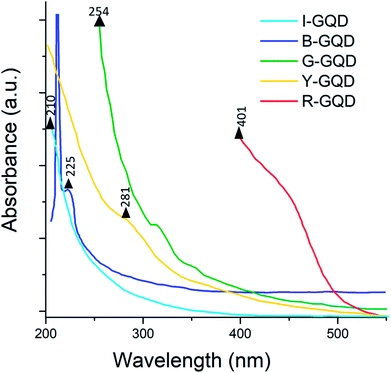
The light absorption profiles of the synthesized GQD samples are presented in Fig. 5. The G-GQDs exhibited peaks at 254 and 313 nm assigned to the π–π* transition of the aromatic sp2 domain. Absorption peaks for B-GQDs were observed at 212 and 225 nm. Note that the peak at 225 nm should represent the π–π* transition in this sample. The I-GQDs had an absorption peak at 210 nm. The Y-GQDs were characterized by a peak at 202 nm (assigned to π–π* transitions) and another peak at 281 nm (assigned to n–π* transitions).50,51 For the R-GQDs, the major absorption peaks were observed at 401 and 456 nm.In GQDs, various electronic transition states are caused by the anti-bonding and bonding molecular orbitals of C![[double bond, length as m-dash]](https://www.rsc.org/images/entities/char_e001.gif) C sp2 carbon domains and functional groups with amino edges. These functionalizations are the reason for n–p and p*–p transitions. The regimes of lower wavelength transitions are dominated by p*–p primary transitions, which are suppressed at higher excitation wavelengths such that n–p transitions become dominant.52
C sp2 carbon domains and functional groups with amino edges. These functionalizations are the reason for n–p and p*–p transitions. The regimes of lower wavelength transitions are dominated by p*–p primary transitions, which are suppressed at higher excitation wavelengths such that n–p transitions become dominant.52
3.5 Photoluminescence analysis
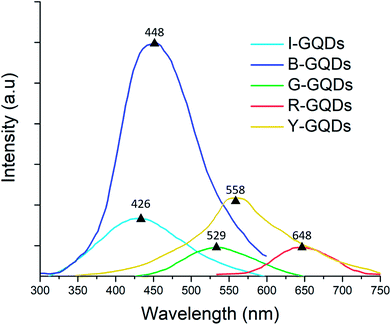
Fluorescent carbon materials have a common property of showing excitation-dependent photoluminescence (PL) behavior. In the present studies, the G-GQD samples, when excited by energy of 254 nm wavelength, resulted in a PL peak at 539 nm (a strong green emission) (Fig. 6).Likewise, in B-GQDs, the intrinsic state emission from defect states resulted in PL with an emission peak at 448 nm (samples excited by 212 nm energy). The I-GQDs, when excited at 231 nm, had an emission peak at 426 nm. The Y-GQDs (excitation energy = 281 nm) and R-GQDs (excitation energy = 401 nm) displayed emission peaks at 558 and 648 nm, respectively.53–55
The lower frequency wavelength was the result of an active process of two or multi-photon transitions with defined energy levels giving rise to the photoluminescence property.
3.6 Dynamic light scattering (DLS) analysis
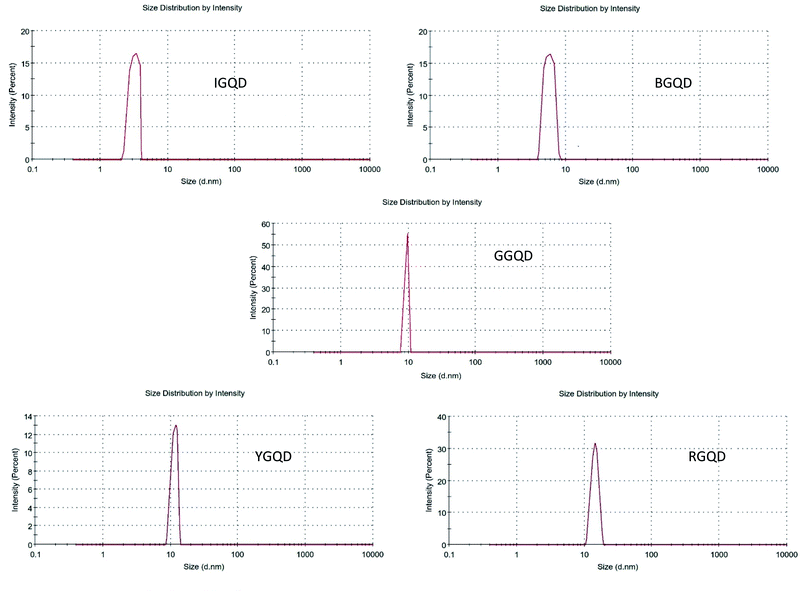
Results of the DLS analysis are shown in Fig. 7. The average particle sizes of the synthesized I-GQDs, B-GQDs, G-GQDs, Y-GQDs, and R-GQDs were observed to be around 3.245 nm, 6.952 nm, 10.02 nm, 13.72 nm, and 15.96 nm, respectively. These size determinations suggest that the emission properties of the GQDs were the result of (zigzag effect)/quantum size effect or recombination of holes and electrons in the quantum sized nanoparticles. In some instances, there also could be the possibility of two- or multi-photon emission, giving rise to a broad range of emissive wavelengths.56,57In summary, the results of the present research are summarized in Table 2. The proposed synthetic methods for multicolored GQDs provide a relatively convenient and reproducible approach to achieve the formation of nanoparticles with the desired properties. The different colors of GQDs can be used for various purposes, such as to develop sensitive detection based on the recording of optical signals. The tunable PL response in GQDs should be very useful in biosensing applications, targeted drug delivery, cancer therapy, optoelectronics, and many other applications.
| Order | Samples | Raman peaks/bands (cm−1) | UV-Vis absorption peaks (nm) | PL emission peaks (nm) | DLS (average size) (nm) |
|---|---|---|---|---|---|
| 1 | I-GQDs | 1361.98 (D) | 210 nm | 426.77 | 3.245 |
| 1611.65 (G) | |||||
| 2 | B-GQDs | 1352.12 (D) | 212.45 | 448.72 | 6.952 |
| 1549.44 (G) | 225.12 | ||||
| 3 | G-GQDs | 1373.76 (D) | 254.53 | 539.30 | 10.02 |
| 1603.81 (G) | 313.52 | ||||
| 4 | Y-GQDs | 1334.83 (D) | 202.11 | 558.51 | 13.72 |
| 1597.34 (G) | 281.35 | ||||
| 5 | R-GQDs | 1424.92 (D) | 401.40 | 648.63 | 15.96 |
| 1665.95 (G) | 456.91 |
4. Conclusion
This aim of this study was to increase the fluorescence quantum yield by improving the conditions for preparing graphene quantum dots (GQDs) through the solvothermal route. The following experimental conditions for preparation of GQDs through the solvothermal route were improved: graphene oxide (GO)/N-N dimethyl formamide (DMF) ratio, filling percentage, and reaction time.Currently, various techniques have been developed to produce GQDs, but they are complex and result in materials with lower fluorescence quantum yields and intensities compared to other quantum dots.
In our study, the fluorescence quantum yield of synthesized QDs reached up to 50%. The synthesis methods selected for the preparation of GQDs were modified for a simple, easy to control, and safe synthetic process. Overall, it was possible to increase the fluorescence quantum yield by improving the conditions for GQD preparation (Table 3). GQDs with a high quantum yield and strong photoluminescence show good biocompatibility and thus have good potential for cell imaging, biolabeling, and other biomedical applications.
Conflicts of interest
There are no conflicts to declare.Acknowledgements
Varun Chhabra and Changanamkandath Rajesh acknowledge the research facilities extended by SGGSW University Fatehgarh Sahib. Rajnish Kaur also acknowledges the Department of Science and Technology (DST), India (Ref No. PDF/2016/001870) for a research fellowship. Funding from CSIR India (Project: OMEGA/PSC0202) is gratefully acknowledged. We are also grateful to the Director of CDAC-Mohali, India. KHK acknowledges support by a grant from the National Research Foundation of Korea (NRF) funded by the Ministry of Education, Science, and Technology (MEST) (No. 2016R1E1A1A01940995) and by “Cooperative Research Program for Agriculture Science and Technology Development (Grant No. PJ012521032017)” Rural Development Administration, Republic of Korea and by the Korea Ministry of Environment (MOE) (2015001950001) as part of "The Chemical Accident Prevention Technology Development Project".References
- M. J. Allen, V. C. Tung and R. B. Kaner, Chem. Rev., 2009, 110, 132–145 CrossRef PubMed.
- F. Banhart, J. Kotakoski and A. V. Krasheninnikov, ACS Nano, 2010, 5, 26–41 CrossRef PubMed.
- A. A. Balandin, S. Ghosh, W. Bao, I. Calizo, D. Teweldebrhan, F. Miao and C. N. Lau, Nano Lett., 2008, 8, 902–907 CrossRef CAS PubMed.
- C. Gómez-Navarro, R. T. Weitz, A. M. Bittner, M. Scolari, A. Mews, M. Burghard and K. Kern, Nano Lett., 2007, 7, 3499–3503 CrossRef PubMed.
- Z.-B. Liu, X. Zhao, X.-L. Zhang, X.-Q. Yan, Y.-P. Wu, Y.-S. Chen and J.-G. Tian, J. Phys. Chem. Lett., 2011, 2, 1972–1977 CrossRef CAS.
- J. Gu, M. J. Hu, Q. Q. Guo, Z. F. Ding, X. L. Sun and J. Yang, RSC Adv., 2014, 4, 50141–50144 RSC.
- S. Zhu, Q. Meng, L. Wang, J. Zhang, Y. Song, H. Jin, K. Zhang, H. Sun, H. Wang and B. Yang, Angew. Chem., 2013, 125, 4045–4049 CrossRef.
- Y. B. Band, Light and matter: electromagnetism, optics, spectroscopy and lasers, John Wiley & Sons, 2006 Search PubMed.
- J. Zhao, G. Chen, L. Zhu and G. Li, Electrochem. Commun., 2011, 13, 31–33 CrossRef CAS.
- Y. Li, Y. Hu, Y. Zhao, G. Shi, L. Deng, Y. Hou and L. Qu, Adv. Mater., 2011, 23, 776–780 CrossRef CAS PubMed.
- S. Zhuo, M. Shao and S.-T. Lee, ACS Nano, 2012, 6, 1059–1064 CrossRef CAS PubMed.
- X. T. Zheng, A. Than, A. Ananthanaraya, D.-H. Kim and P. Chen, ACS Nano, 2013, 7, 6278–6286 CrossRef CAS PubMed.
- S. Zhu, J. Zhang, C. Qiao, S. Tang, Y. Li, W. Yuan, B. Li, L. Tian, F. Liu and R. Hu, Chem. Commun., 2011, 47, 6858–6860 RSC.
- V. Gupta, N. Chaudhary, R. Srivastava, G. D. Sharma, R. Bhardwaj and S. Chand, J. Am. Chem. Soc., 2011, 133, 9960–9963 CrossRef CAS PubMed.
- R. Liu, D. Wu, X. Feng and K. Müllen, J. Am. Chem. Soc., 2011, 133, 15221–15223 CrossRef CAS PubMed.
- J. Mørk, Appl. Phys. Lett., 2007, 90, 33508 CrossRef.
- D. Mijatovic, J. C. Eijkel and A. van den Berg, Lab Chip, 2005, 5, 492–500 RSC.
- R. Kaur, K.-H. Kim and A. Deep, Appl. Surf. Sci., 2017, 396, 1303–1309 CrossRef CAS.
- X. Yan, X. Cui and L.-s. Li, J. Am. Chem. Soc., 2010, 132, 5944–5945 CrossRef CAS PubMed.
- S. H. Jin, D. H. Kim, G. H. Jun, S. H. Hong and S. Jeon, ACS Nano, 2013, 7, 1239–1245 CrossRef CAS PubMed.
- T. V. Tam, S. H. Hur, J. S. Chung and W. M. Choi, Sens. Actuators, A, 2015, 233, 368–373 CrossRef CAS.
- B. G. Kim and H. J. Choi, Phys. Rev. B: Condens. Matter Mater. Phys., 2012, 86, 115435 CrossRef.
- J. C. Meyer, A. K. Geim, M. I. Katsnelson, K. S. Novoselov, T. J. Booth and S. Roth, arXiv preprint cond-mat/0701379, 2007.
- J. Wallbank, A. Patel, M. Mucha-Kruczyński, A. Geim and V. Fal'ko, Phys. Rev. B: Condens. Matter Mater. Phys., 2013, 87, 245408 CrossRef.
- D. Pan, J. Zhang, Z. Li and M. Wu, Adv. Mater., 2010, 22, 734–738 CrossRef CAS PubMed.
- L. Ponomarenko, F. Schedin, M. Katsnelson, R. Yang, E. Hill, K. Novoselov and A. Geim, Science, 2008, 320, 356–358 CrossRef CAS PubMed.
- D. B. Shinde and V. K. Pillai, Chem. - Eur. J., 2012, 18, 12522–12528 CrossRef CAS PubMed.
- J. Shen, Y. Zhu, X. Yang, J. Zong, J. Zhang and C. Li, New J. Chem., 2012, 36, 97–101 RSC.
- W. Li, Z. Zhang, B. Kong, S. Feng, J. Wang, L. Wang, J. Yang, F. Zhang, P. Wu and D. Zhao, Angew. Chem., Int. Ed., 2013, 52, 8151–8155 CrossRef CAS PubMed.
- M. L. Mueller, X. Yan, B. Dragnea and L.-s. Li, Nano Lett., 2010, 11, 56–60 CrossRef PubMed.
- D. Jiang, Y. Chen, N. Li, W. Li, Z. Wang, J. Zhu, H. Zhang, B. Liu and S. Xu, PLoS One, 2015, 10, e0144906 Search PubMed.
- M. Zhang, L. Bai, W. Shang, W. Xie, H. Ma, Y. Fu, D. Fang, H. Sun, L. Fan and M. Han, J. Mater. Chem., 2012, 22, 7461–7467 RSC.
- H. Kalita, J. Mohapatra, L. Pradhan, A. Mitra, D. Bahadur and M. Aslam, RSC Adv., 2016, 6, 23518–23524 RSC.
- C. Wang, L. Zong and C.-H. Tan, J. Am. Chem. Soc., 2015, 137, 10677–10682 CrossRef CAS PubMed.
- S. Dash, S. Patel and B. K. Mishra, Tetrahedron, 2009, 65, 707–739 CrossRef CAS.
- D. G. Lee and J. R. Brownridge, J. Am. Chem. Soc., 1974, 96, 5517–5523 CrossRef CAS.
- M. J. Gresser and A. S. Tracey, J. Am. Chem. Soc., 1985, 107, 4215–4220 CrossRef CAS.
- Y. E. Yan and F. W. Schwartz, Environ. Sci. Technol., 2000, 34, 2535–2541 CrossRef CAS.
- D. V. Kosynkin, A. L. Higginbotham, A. Sinitskii, J. R. Lomeda, A. Dimiev, B. K. Price and J. M. Tour, Nature, 2009, 458, 872 CrossRef CAS PubMed.
- L. Shahriary and A. A. Athawale, International Journal of Renewable Energy and Environmental Engineering, 2014, 2, 58–63 Search PubMed.
- T. Chen, B. Zeng, J. Liu, J. Dong, X. Liu, Z. Wu, X. Yang and Z. Li, J. Phys.: Conf. Ser., 2009, 188, 012051 CrossRef.
- Y.-P. Sun, B. Zhou, Y. Lin, W. Wang, K. S. Fernando, P. Pathak, M. J. Meziani, B. A. Harruff, X. Wang and H. Wang, J. Am. Chem. Soc., 2006, 128, 7756–7757 CrossRef CAS PubMed.
- L. Bao, Z. L. Zhang, Z. Q. Tian, L. Zhang, C. Liu, Y. Lin, B. Qi and D. W. Pang, Adv. Mater., 2011, 23, 5801–5806 CrossRef CAS PubMed.
- H. Li, X. He, Y. Liu, H. Huang, S. Lian, S.-T. Lee and Z. Kang, Carbon, 2011, 49, 605–609 CrossRef CAS.
- Z. Gan, H. Xu and Y. Hao, Nanoscale, 2016, 8, 7794–7807 RSC.
- M.-H. Jang, S. H. Song, H. D. Ha, T. S. Seo, S. Jeon and Y.-H. Cho, Carbon, 2017, 118, 524–530 CrossRef CAS.
- S. Zhu, J. Zhang, S. Tang, C. Qiao, L. Wang, H. Wang, X. Liu, B. Li, Y. Li and W. Yu, Adv. Funct. Mater., 2012, 22, 4732–4740 CrossRef CAS.
- Y. Li, Y. Zhao, H. Cheng, Y. Hu, G. Shi, L. Dai and L. Qu, J. Am. Chem. Soc., 2011, 134, 15–18 CrossRef PubMed.
- I. Childres, L. A. Jauregui, W. Park, H. Cao and Y. P. Chen, New developments in photon and materials research, 2013, vol. 1 Search PubMed.
- Y. Dong, C. Chen, X. Zheng, L. Gao, Z. Cui, H. Yang, C. Guo, Y. Chi and C. M. Li, J. Mater. Chem., 2012, 22, 8764–8766 RSC.
- D. Qu, M. Zheng, P. Du, Y. Zhou, L. Zhang, D. Li, H. Tan, Z. Zhao, Z. Xie and Z. Sun, Nanoscale, 2013, 5, 12272–12277 RSC.
- Y. Dong, J. Shao, C. Chen, H. Li, R. Wang, Y. Chi, X. Lin and G. Chen, Carbon, 2012, 50, 4738–4743 CrossRef CAS.
- F. Liu, M. H. Jang, H. D. Ha, J. H. Kim, Y. H. Cho and T. S. Seo, Adv. Mater., 2013, 25, 3657–3662 CrossRef CAS PubMed.
- L. Wang, S.-J. Zhu, H.-Y. Wang, S.-N. Qu, Y.-L. Zhang, J.-H. Zhang, Q.-D. Chen, H.-L. Xu, W. Han and B. Yang, ACS Nano, 2014, 8, 2541–2547 CrossRef CAS PubMed.
- J. Shen, Y. Zhu, C. Chen, X. Yang and C. Li, Chem. Commun., 2011, 47, 2580–2582 RSC.
- X. T. Zheng, A. Ananthanarayanan, K. Q. Luo and P. Chen, Small, 2015, 11, 1620–1636 CrossRef CAS PubMed.
- Q. Liu, B. Guo, Z. Rao, B. Zhang and J. R. Gong, Nano Lett., 2013, 13, 2436–2441 CrossRef CAS PubMed.
- T. Fan, W. Zeng, W. Tang, C. Yuan, S. Tong, K. Cai, Y. Liu, W. Huang, Y. Min and A. J. Epstein, Nanoscale Res. Lett., 2015, 10, 55 CrossRef PubMed.
- Z. Li, Y. Wang, Y. Ni and S. Kokot, Spectrochim. Acta, Part A, 2015, 137, 1213–1221 CrossRef CAS PubMed.
- A. Qu, H. Xie, X. Xu, Y. Zhang, S. Wen and Y. Cui, Appl. Surf. Sci., 2016, 375, 230–241 CrossRef CAS.
- C. C. Ke, Y. C. Yang and W. L. Tseng, Part. Part. Syst. Charact., 2016, 33, 132–139 CrossRef CAS.
- L. Lin and S. Zhang, Chem. Commun., 2012, 48, 10177–10179 RSC.
- D. Pan, J. Zhang, Z. Li and M. Wu, Adv. Mater., 2010, 22, 734–738 CrossRef CAS PubMed.
- X. Zhou, Y. Zhang, C. Wang, X. Wu, Y. Yang, B. Zheng, H. Wu, S. Guo and J. Zhang, ACS Nano, 2012, 6, 6592–6599 CrossRef CAS PubMed.
- S. Zhu, J. Zhang, X. Liu, B. Li, X. Wang, S. Tang, Q. Meng, Y. Li, C. Shi and R. Hu, RSC Adv., 2012, 2, 2717–2720 RSC.
- L. L. Li, J. Ji, R. Fei, C. Z. Wang, Q. Lu, J. R. Zhang, L. P. Jiang and J. J. Zhu, Adv. Funct. Mater., 2012, 22, 2971–2979 CrossRef CAS.
| This journal is © The Royal Society of Chemistry 2018 |


