
 Open Access Article
 This Open Access Article is licensed under a Creative Commons Attribution-Non Commercial 3.0 Unported Licence
Hydrate slurry flow property in W/O emulsion systems
Bohui Shi *,
Lin Ding,
Yang Liu,
Juheng Yang,
Shangfei Song,
Haihao Wu,
Wei Wang and
Jing Gong*
*,
Lin Ding,
Yang Liu,
Juheng Yang,
Shangfei Song,
Haihao Wu,
Wei Wang and
Jing Gong*
National Engineering Laboratory for Pipeline Safety, MOE Key Laboratory of Petroleum Engineering, Beijing Key Laboratory of Urban Oil and Gas Distribution Technology, China University of Petroleum-Beijing, Beijing 102249, People's Republic of China. E-mail: bohui.shi@cup.edu.cn
First published on 22nd March 2018
Abstract
Hydrate risk management strategy has become a promising way of dealing with hydrates in subsea transportation pipelines in recent years. In this way, hydrates are allowed to form in the pipeline and are treated as a slurry flow with the help of anti-agglomerants. This work investigated the effect of hydrate formation on the flow friction factor in water in oil (W/O) emulsion systems. A series of hydrate formation and slurry flow experiments were conducted using a high pressure flow loop. Results show that the friction factor is in direct proportion to the volume fraction of hydrates formed, as it increases significantly after hydrate formation onset and then increases gradually with hydrate growing. A novel method is proposed in this work to amend the effective hydrate volume fraction and take into account the effect of hydrate agglomeration and water occlusion. In addition, it is found that the slurry flow velocity has a significant effect on the friction factor variation. As a larger flow velocity can lift the particles suspension height and cause the particles to be away from the pipe wall surface, so it gives a smaller friction factor by reducing the collisions between hydrate particles and the pipe wall surface. With the modified effective hydrate volume fraction and particle chord length distribution data, a model is proposed to estimate the hydrate caused friction factor in W/O emulsion systems, which shows a good prediction accuracy in 10% and 20% water cut conditions.
1. Introduction
As oil and gas industries move into deeper water, the gas hydrate1 has been a major hazard in deep-sea oil and gas flow assurance due to the operating conditions of high pressure and low temperature.2 It has been reported that hydrates can form in the deep sea flow line,3 blocking and damaging the oilfield station equipment and even causing casualties.4,5 Traditional ways of hydrate prevention have been used for decades in the oilfield production, including thermal insulation, low pressure operation and thermodynamic inhibitor injection and so on.6,7 But these traditional ways are gradually being exposed to have some disadvantages that are unacceptable in future field production, such as the large usage amount and the high economic costs.8 Currently, the oil and gas industries are in transition from hydrate avoidance to hydrate risk management using the low dosage hydrate inhibitors (LDHI), including the kinetic hydrate inhibitors (KHI) and the anti-agglomerants (AA).9–11 In the hydrate risk management strategy, hydrates are allowed to form in flow line but the agglomeration between hydrate particles is controlled to avoid hydrate plugging. Thus, as hydrates form in the flow line, the petroleum product will be transported as a slurry flow.12,13 In this way, introduction of the hydrate solids may have a significant effect on the fluid flow properties.Rheological properties of the hydrate slurry flow has been widely studied in recent years and most of these studies suggested that the hydrate slurry showed a shear thinning property.14–17 The equation proposed by Mills is widely used to estimate the hydrate slurry viscosity, which is well adapted to hard spheres of equal size and accounted only for hydrodynamic interactions.18 But this model ignored that the agglomeration between hydrate particles will significantly affect the slurry flow property.
Camargo and Palermo improved the rheological model of Mills by introducing an effective hydrate volume fraction that could be calculated from the data of the hydrate particle size.19 This model accounted for the effect of hydrate particle agglomeration and could better predict the pressure drop in laminar slurry flow. In addition, their results showed that the friction factor in turbulent flow was linear with the water cut (water volume fraction in liquid phase), which as they deduced on one hand could be due to the friction and collisions between hydrate particles and the pipe wall, and on other hand might be due to the hydrates modified the pipe roughness.
Doron et al. studied the hydrate slurry flow in low flow rate conditions and found that hydrates would form a stationary/moving layer in these flow rates.20 This hydrate layer would diminish as the flow rate increases. In addition, they built a three layer model to calculate the slurry flow pressure drop, which showed a satisfactory agreement with the experimental data. Their study provides another way to explain the thinning property of hydrate slurry, in which the interaction between the hydrate particles and pipe wall surface is considered.
Peysson et al. also suggested that the collision process between hydrate particles was a dominant factor in hydrate slurry flow property, which would contribute to the increase of friction factor after hydrate formation.21 They believed that the friction factor caused by particle collision was mainly determined by the particle size, particle density, and particle volume fraction and flow velocity.
Hald et al. studied the hydrate slurry rheology with sulfur-hexafluoride in a stirred reactor and found that the particle migration could affect hydrate slurry viscosity apparently.22 Their results showed that the slurry viscosity was shear thinning and was in linear with hydrate concentration. But sometimes in high shear rate conditions, shearing thickening also occurred. They gave a possible explanation of hydrate particle resuspension in the measurement region.
Joshi et al. studied the hydrate slurry flow properties in high water cut systems.23 They divided the hydrate slurry flow into three stages: stage I consists of constant pump ΔP, stage II consists of a sharp increase in the pump ΔP, and stage III consists of large fluctuations in the pump ΔP. They believed this stage transition was due to the heterogeneous distribution of hydrate particles. Based on this result, a mechanism for hydrate plug formation was proposed which involved the transition from a homogeneous suspension (stage I) of hydrate particles to heterogeneous suspension (stage II) leading to increased particle interaction and agglomeration, ultimately leading to the formation of a hydrate bed and wall deposit (region III).
We believe the flow property of hydrate slurry is a complex problem that should be associated with particle properties, particle agglomeration and distribution and so on. In this work, changes of the friction factor before/after hydrate formation were studied in a W/O emulsion system using a high pressure flow loop. Increase of the friction factor after hydrate formation was analysed based on a force analysis of suspended hydrate particles. Effect of the flow velocity and particle distribution on the hydrate caused friction factor was studied. In addition, a model was proposed to estimate the hydrate caused friction factor increase from the particle properties and flow velocity.
2. Experimental section
2.1. High pressure hydrate flow loop
Experiments in this work were conducted using a high pressure hydrate flow loop, which was constructed by China University of Petroleum-Beijing. Structure and schematic of the flow loop are shown in Fig. 1.24 The loop is made of carbon steel pipe with an internal diameter of 25.4 mm and the total length of the test section is 30 meters. Design pressure of the loop is 15 MPa and the operating temperature ranges from −20 °C to 100 °C. The loop can be pressurized by injecting natural gas from a high pressure gas cylinder that with an internal pressure of 15 MPa. The operating temperature is controlled by a coated pipe in pipe system, in which the coolant is circulated by four Julabo glycol baths (Julabo FP-51). Flow velocity of the liquid material can be adjusted by a high pressure magnetic centrifugal pump, ranging from 0.1 m s−1 to 1.34 m s−1. 8 thermocouples (Kunlun KAWP-241) and 5 pressure transducers (Endress Hauser D7012A0109C) are equipped on the test section, of which the precision is 0.1 K and 0.01 kPa respectively. During the experiments, the hydrate formation onset can be confirmed by the sudden increase of the fluid temperature. And the slurry flow friction factor can be estimated from the pressure difference before and after the test section. In addition, a Focused Beam Reflectance Measurement (FBRM) probe (METTLER TOLEDO G600) and a particle video microscope (PVM) probe (METTLER TOLEDO V819) are equipped on the section of liquid entrance to monitor the hydrate particles property. All the experimental data are collected by a LabView data acquisition system for further analysis. For more details of this flow loop, please refer to our previous work.25 | ||
| Fig. 1 Photograph and schematic program of the flow loop.25 | ||
2.2. Materials and procedure
Materials used in this work include deionized water, #-10 diesel oil and civil natural gas. The civil natural gas was from Shanjing transportation pipeline in China, composition of which is shown in Table 1. In addition, hydrate anti-agglomerant which provided by the Chemical Engineering Department of China University of Petroleum-Beijing was used in all the experiments to prevent hydrate plugging. This AA is extracted from a saponins plant and has been proved to have a good performance on promoting the dispersity of both water droplets and hydrate particles.26| Composition | mol% | Composition | mol% |
|---|---|---|---|
| N2 | 1.53 | C3 | 3.06 |
| CO | 2.05 | iC4 | 0.33 |
| CO2 | 0.89 | iC5 | 0.04 |
| C1 | 89.02 | nC6+ | 0.01 |
| C2 | 3.07 | — | — |
The experimental procedure is as follows:
(1) In order to eliminate the influence of air, a vacuum pump is used to vacuumize the loop.
(2) Add specified volume of water and diesel oil through the feed inlet. The total volume of the liquid was 50 liters and the water volume fraction in our work was 10%, 20% and 30%. And then, 1% AA was injected into the loop using a hand pump.
(3) Inject methane gas into the loop using a high pressure gas cylinder until the experimental pressure (6 MPa in this work) was reached. This process was repeated several times until the pressure stabilized at the experimental pressure.
(4) Set the bath temperature at 0 °C and then adjust the pump speed to circulate the liquid at a specific velocity. During this period, the liquid temperature dropped and hydrate would form when a critical supercooling point was reached.
(5) As hydrate formed in the flow loop, operating parameters would change with time. All these changes were recorded by the data acquisition system. When the data became stable, increase the bath temperature up to 30 °C and decompose the hydrates.
3. Results and discussion
3.1. Typical results of hydrate formation and slurry flow experiments
In this work, volume fraction of the hydrates formed was calculated through gas consumption amount as follows:The gas consumption amount is calculated through the pressure difference before and after each experiment:
 | (1) |
Then, volume fraction of the hydrates formed can be calculated through:
 | (2) |
The friction factor of hydrate slurry flow was calculated using the pressure drop along the full pipe length as:
 | (3) |
Results of the experiment with a velocity of 0.38m s−1 is used here to show the typical results of hydrate formation and slurry flow experiments, as shown in Fig. 2. The whole process can be divided into three parts: (1) as the temperature reaches the hydrate equilibrium point, the flow system goes into hydrate formation induction period, which is necessary for the appearance of the very first hydrate cluster of supernucleus size; (2) as hydrate crystallization is an exothermic reaction, the rapid increase of fluid temperature indicates the end of the induction period and the beginning of the hydrate formation and growth period. In this period hydrate volume fraction increases rapidly, accompanied with the decrease in flow rate and increase in friction factor. (3) Then when hydrate ceases to grow, the flow system goes into a period of stable slurry flow, in which the friction factor and flow rate stop changing, and float up and down around a constant value. This typical result indicates that the hydrate formation and growth can cause a significant increase of the friction factor in flow system. On one hand, this friction factor increase might be caused by the increasing hydrate volume fraction as we can see that the friction factor has the same increasing trend with the hydrate volume fraction. On the other hand, collision between hydrate particles and between hydrate particles and pipe wall surface, as well as the hydrate agglomeration and deposition can also cause the friction factor to increase.
 | ||
| Fig. 2 Results of experiment at the condition of 0.38m s−1. | ||
To study the additional friction factor that caused by hydrates, we separate the total friction factor into two parts: friction factor caused by the carrying liquid – f1, which is estimated to be equal to the total friction factor before hydrate formation; and the additional friction factor that caused by hydrates – f2. Thus for a stable slurry flow, the flow loop pressure drop can be predicted using:
 | (4) |
3.2. Hydrate caused friction factor in conditions of different flow velocities
For 10% water cut condition, variation of the hydrate caused friction factor with different flow rates are shown in Fig. 3. To make sure that the system formed a laminar flow, the velocity range was selected between 0.38 m s−1 to 1.29 m s−1 and the corresponding Reynolds number was between 616 and 2091. From Fig. 3 we can see the hydrate caused friction factor decreases apparently when the velocity increases from 0.38 m s−1 to 0.59 m s−1. While the velocity effect seems to be smaller as the velocity keep increasing further. When the velocity is bigger than 0.93m s−1, its effect on the friction factor is counter-intuitive. This indicates that the effect of hydrate particles on slurry flow property is less intuitive in higher flow rate conditions.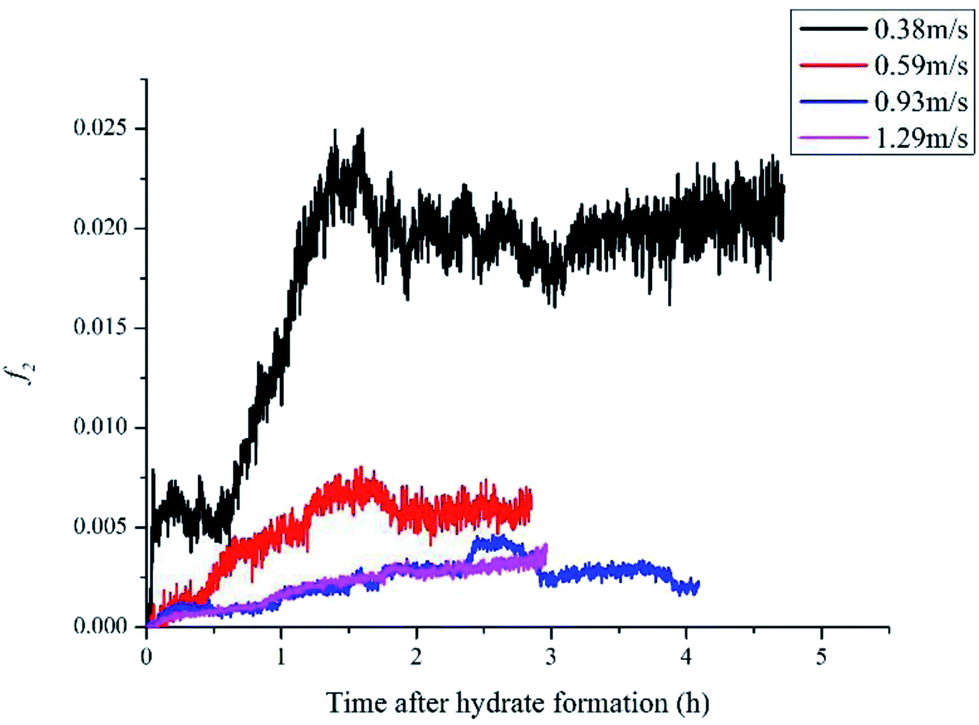 | ||
| Fig. 3 Variation of the hydrate caused friction factor with different velocities. | ||
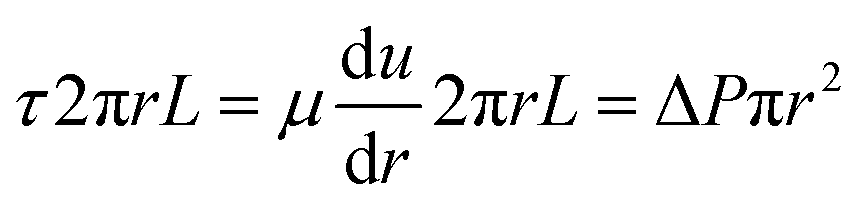
As the hydrate caused friction factor is mainly due to the agglomeration and collision between hydrate particles, it should be a function of the flow rate and the hydrate particle properties, such as particle size, volume fraction and density etc. In liquid–solid slurry flow, the shear force on pipe wall caused by solid particles can be estimated by27
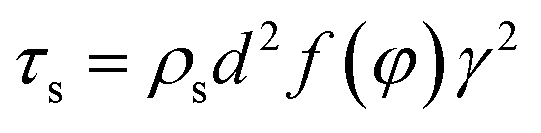 | (5) |
Then, for a control volume in pipe flow the following equation is true:
| τs × 2πRL=ΔP × πR2 | (6) |
Combine eqn (4)–(6) and we can get
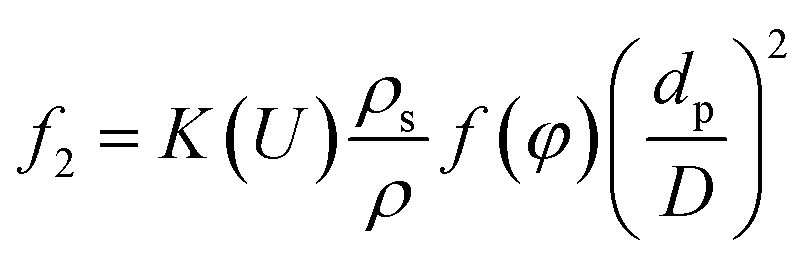 | (7) |
K(U) is a factor that depends on the flow velocity, ρ is the density of the liquid bulk (kg m−3) and D is the pipe diameter (m).
Defining the relationship between f(φ) and the real volume fraction of hydrates formed is important for the f2 calculation. This depends on in which way and in which system that the hydrates formed. For the systems with a same hydrate volume fraction, the effective hydrate volume fraction could be significantly different due to different agglomeration form. Sinquin et al. proposed a method for W/O emulsion systems, in which they introduced the data of particle size and the particle fractal coefficient to quantify the effect of hydrate agglomeration on hydrate effective volume fraction.19 However, based on the PVM results from our experiments, we made some improvements on Sinquin's method to consider the contribution of the unconverted water phase.
Fig. 4 shows the images recorded by the PVM probe, from which we can clearly see the whole process of hydrate formation, growth and agglomeration in a W/O emulsion system. At the very beginning, it can be seen that the water droplets disperse in oil bulk phase (Fig. 4a). Then after the hydrate formation induction period, hydrates tend to form a hydrate shell on the dispersed water droplets, occluding some water phase inside (Fig. 4b). Then as the hydrate particles move with liquid flow, some of the particles would collide with the unconverted water and agglomerate into a larger hydrate-water mass. This would occlude more water phase, forming a complex hydrate-water agglomerate (Fig. 4c and d). Then as the hydrate-water agglomerate keep growing, water phase is occluded in the hydrate mass permanently (Fig. 4e and f). Therefore, when hydrates are fully grown and the system runs into a final stable state, most of the unconverted water phase is occluded in the hydrate masses. This indicates that the solid phase in hydrate slurry flow is not only constituted by hydrates and we must take the occluded water into account when calculating the effective solid fraction. This can be supported by the study from Peysson et al.,21 who found the friction factor increase is linear with the water cut. Their study indicated the unconverted water phase did have an effect on the friction factor increase. In addition, we can note that in Fig. 4f there is very little free water phase in the system when the hydrates are fully grown. We believe most of the unconverted water is occluded in the hydrate agglomerates and it also should be counted in the solid volume fraction. Thus we set the solid volume fraction as sum of the hydrate volume fraction and the unconverted water volume fraction and substitute this into Sinquin's equation,19 then we can get the complete form of eqn (7):
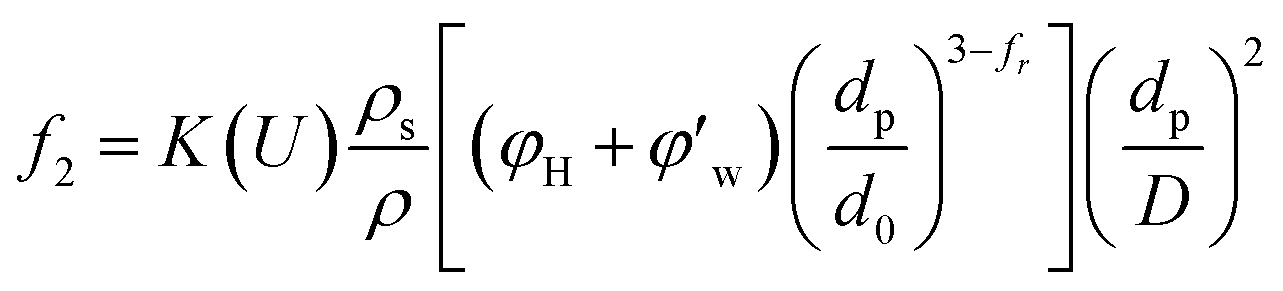 | (8) |
 is the volume fraction of the unconverted water, fr is the hydrate particle's fractal dimension and d0 is the diameter of initial hydrate particles, which can be estimated by the water droplet diameter before hydrate formation.
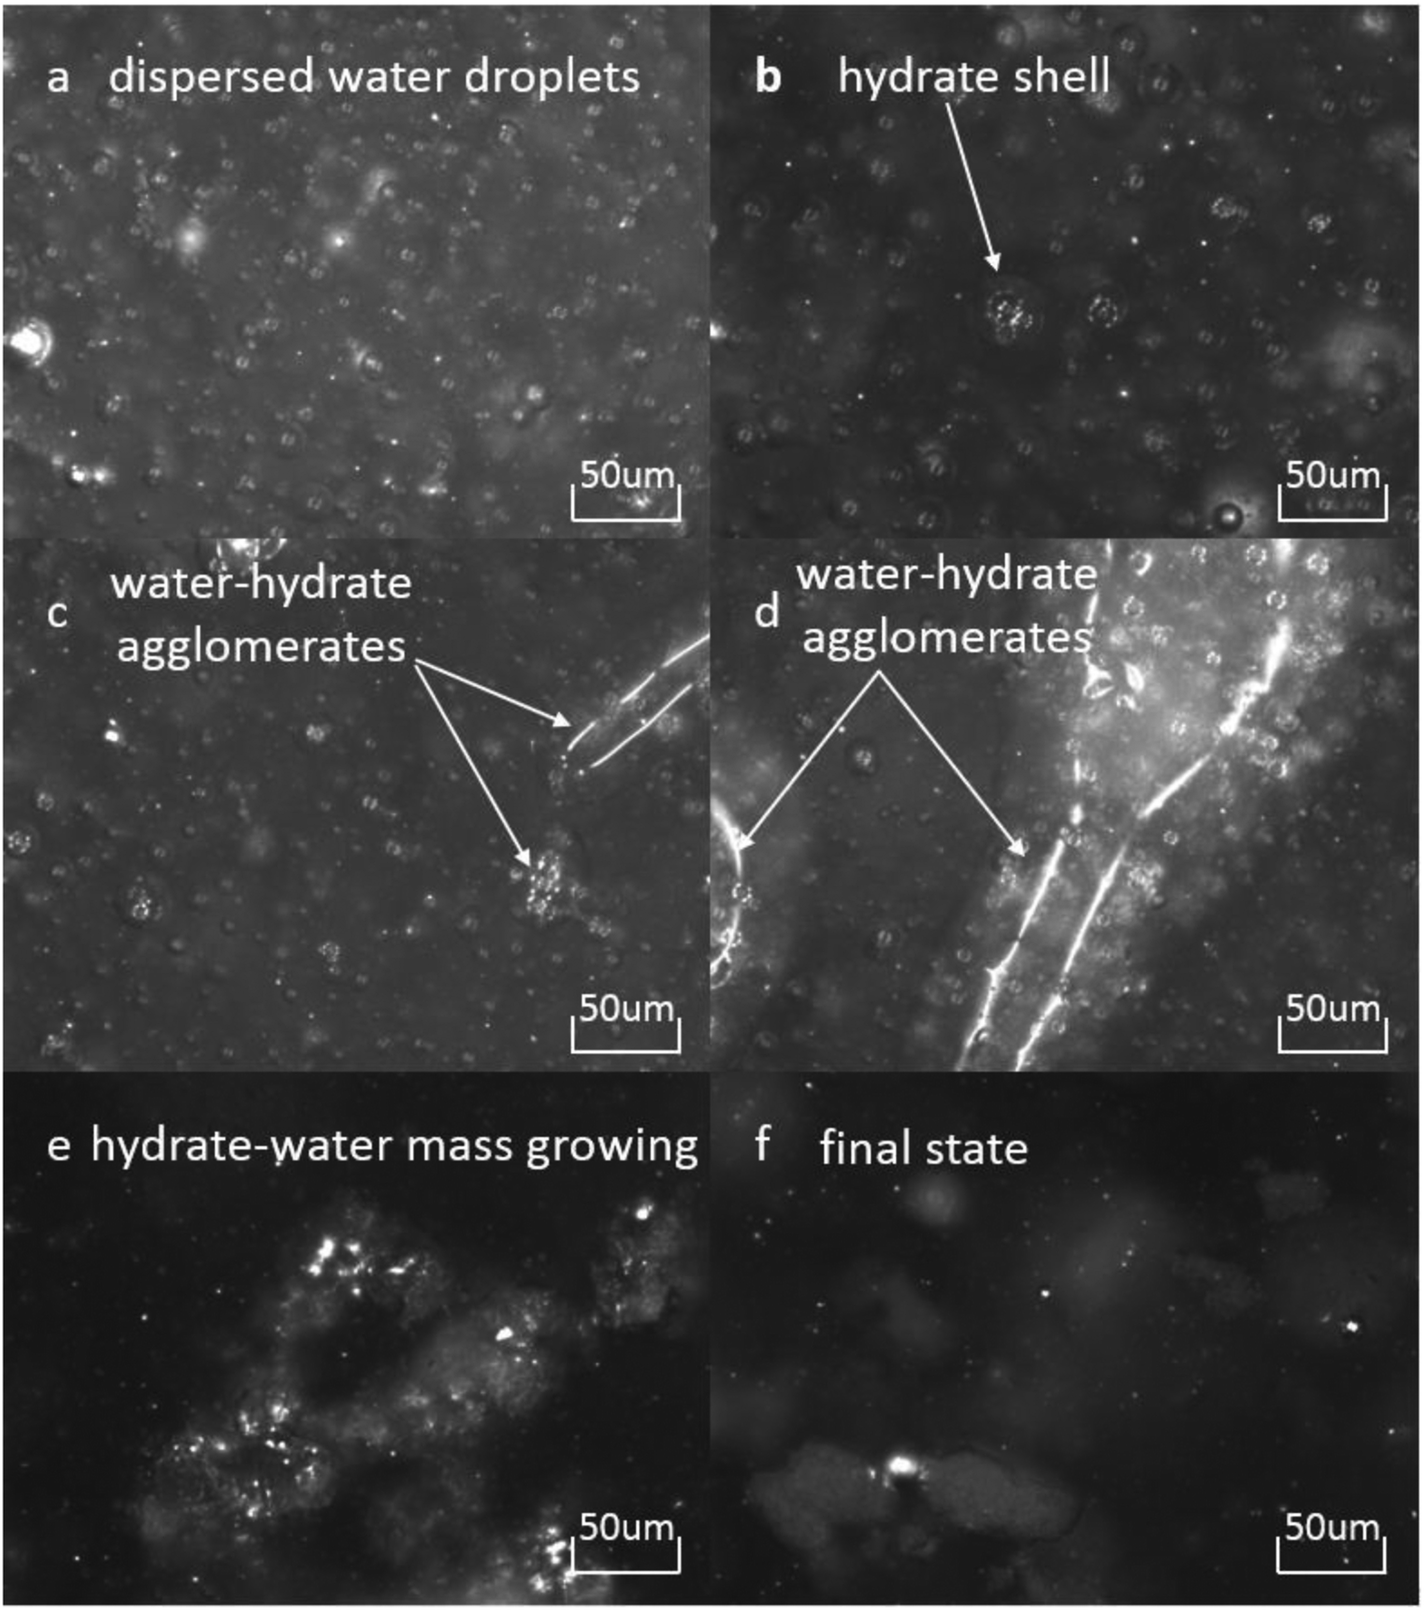 | ||
Fig. 4 Hydrate formation and agglomeration process recorded by the PVM probe at a magnification of 200![[thin space (1/6-em)]](https://www.rsc.org/images/entities/char_2009.gif) :1. (a) Water droplets dispersed in oil phase; (b) hydrate shell start forming on a water droplet; (c and d) agglomeration between hydrates and water droplets; (e) hydrate-water mass growing; (f) hydrate-water mass with occluded water phase (similar process has been introduced in ref. 25). :1. (a) Water droplets dispersed in oil phase; (b) hydrate shell start forming on a water droplet; (c and d) agglomeration between hydrates and water droplets; (e) hydrate-water mass growing; (f) hydrate-water mass with occluded water phase (similar process has been introduced in ref. 25). | ||
 can be calculated from the gas consumption amount ng. As we know, in an entire hydrate molecule the ratio of the water molecule number to the gas molecule number is constant, that is the hydration number N. After calculating the gas consumption amount ng from eqn (1), we can get the water consumption amount by ng plus N. Then the unconverted water volume fraction can be obtained by:
 | (9) |
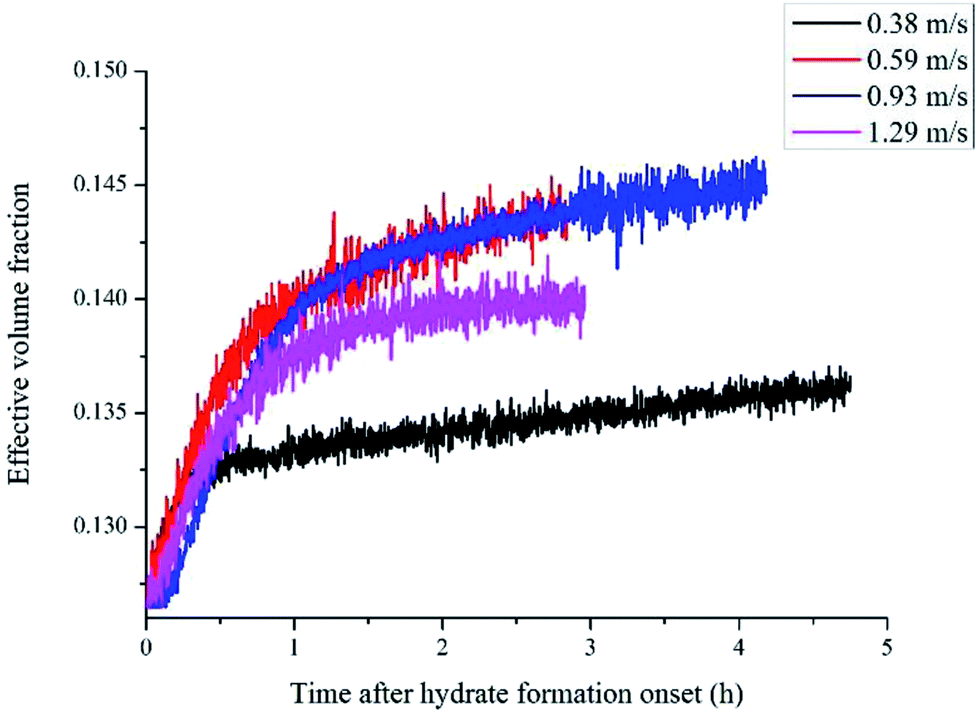 | ||
| Fig. 5 Variation of the solid volume fraction with time. | ||
Another parameter that we need to use in eqn (8) is the particle size. In Sinquin's study the agglomerate diameter was estimated by considering the balance between the shear stress and the force of adhesion between hydrate particles. In this work, particle mean chord length data is used to represent the particle size variation, which can be easily obtained in real-time with help of the FBRM probe. The particle chord length variation with time is shown in Fig. 6. Before hydrate formation, the chord length data was the chord length of water droplets, which stayed at a smaller and constant value. Then when hydrate formation onset, the chord length data began to increase sharply. This was because part of the water droplets were covered with the newly formed hydrate shell. As they moved with the fluid they collided and agglomerated with other uncovered water droplets, forming large hydrate-water masses. Then as hydrate grew gradually, these hydrate-water masses would break into smaller ones due to the fluid flow shear force. So the particle chord length decreased after the initial agglomeration stage. When the hydrates ceased to grow, particle chord length would stabilize at a constant value. We can see from Fig. 6 that as the velocity increases, the final stable value of the particle chord length decreases gradually, which in sequence is 47 microns, 44 microns, 41 microns and 38 microns. This indicates that the hydrate particle agglomeration degree will be reduced in higher flow rate conditions due to the increasing flow shear rate. This is also one of the reasons why the hydrate caused friction decreased with flow rates (Fig. 3).
 | ||
| Fig. 6 Chord length variation of hydrate particles in different flow rates (sudden increase represents the hydrate formation onset). | ||
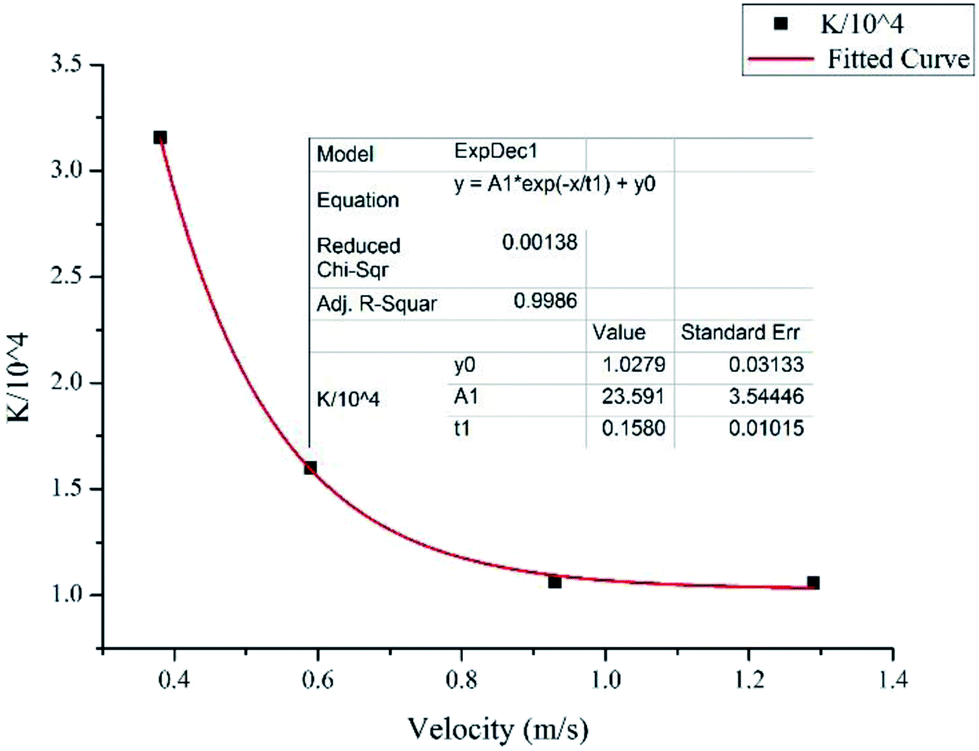
After obtaining the particle chord length and the effective hydrate volume fraction, we can then regress the factor K in eqn (8) from the experiment data. As the hydrate slurry flow is very complicated with random hydrate agglomeration and deposition, in this study we mainly focus on the friction factor at the final stable state when all the hydrates have been fully grown. Fig. 7 shows the changes of K values with different velocities. It decreases apparently when the velocity increases from 0.38 m s−1 to 0.93 m s−1, while if the velocity keeps increasing over 0.93 m s−1 it will stabilize at a constant value. By fitting the experimental data we found that the factor K can be estimated through the following equation:
|
K = (23.59e−U/0.158 + 1.028) × 104
| (10) |
 | ||
| Fig. 7 Variation of K with different velocities. | ||
As we know the hydrate caused friction factor is mainly caused by the collision between hydrate particles and between hydrate particles and the pipe wall surface. Once the hydrate volume fraction and the hydrate particles' properties (density and size etc.) are fixed, flow rate would affect the friction factor mainly by changing the particles distribution and interaction. For a suspended particle in laminar flow, the force condition acted on it is shown in Fig. 8. The lift force is generated due to the velocity gradient on the top and bottom sides of the hydrate particle – the Saffman lift force,28 which can be estimated through
 | (11) |
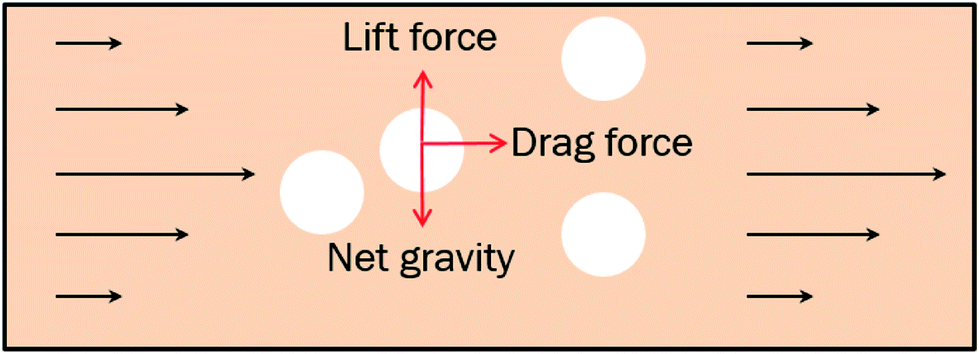 | ||
| Fig. 8 Diagram of the forces acting on the suspended particles. | ||
In laminar flow, we have
 | (12) |
Then we can get
 | (13) |
 | (14) |
Substituting eqn (14) to (11) we can get
 | (15) |
The net gravity can be calculated by
 | (16) |
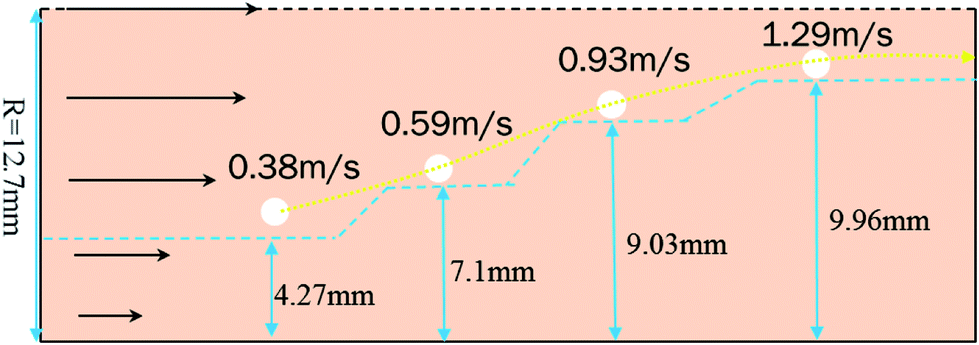
In a laminar flow system, the velocity gradient is 0 at the pipe axis and gradually reaches a maximum value at the pipe wall surface. As a larger velocity gradient gives a larger lift force, thus it is easier for a particle to suspend when it gets closer to the pipe wall surface. We define h as the height of a hydrate particle from the pipe wall surface, and hc as the critical height at which the lift force is equal to the particle's net gravity. We can get this height h by R minus r. Then, the particles under hc would be lifted up and the particles above hc would move downward. As a result, the hydrate particles would suspend densely around the critical height, flowing forward and fluctuating up and down, as shown in Fig. 9. As we know, the velocity distribution in laminar flow varies with the mean flow rate. So the critical height for particle suspension is also different in different velocity conditions. For each of the above velocity conditions, the corresponding hc can be calculated by eqn (14) and (15) and the results are shown in Fig. 10. We can notice that as the flow velocity increases, the critical suspension height becomes larger and the suspended hydrate particles approach gradually to the pipe central axis. That way, the collision between hydrate particles and pipe wall surface will be significantly reduced. This is very likely why the factor K reduces with the increasing velocity. Combine this with the result in Fig. 7 and we can notice that when the particle suspension height is smaller than 9.03 mm, the height variation can significantly affect the factor K; however, if the suspension height is larger than 9.03 mm, the factor K will no longer change with the suspension height. This critical height value is about 71.1% of the whole pipe radius R. Thus we can suggest that the region above 71.1% of the pipe radius is an optimal flow region for solid particles. In this region, the friction and collision between hydrate particles and pipe wall surface can be ignored and so in this region the friction factor has the minimum value. Also, in this region the friction factor almost doesn't change with the flow rate, which means the particle flow in this region is quite stable. For an actual running pipeline, if we make the hydrate particles flow in this optimal region by controlling the flow rate, we can not only reduce the operating energy consumption but also keep the flow line running stably.
 | ||
| Fig. 9 Schematic diagram of the hydrate particle trajectory. | ||
 | ||
| Fig. 10 The critical radius for particle suspension in different velocity conditions. | ||
3.3. Comparison with the experimental data
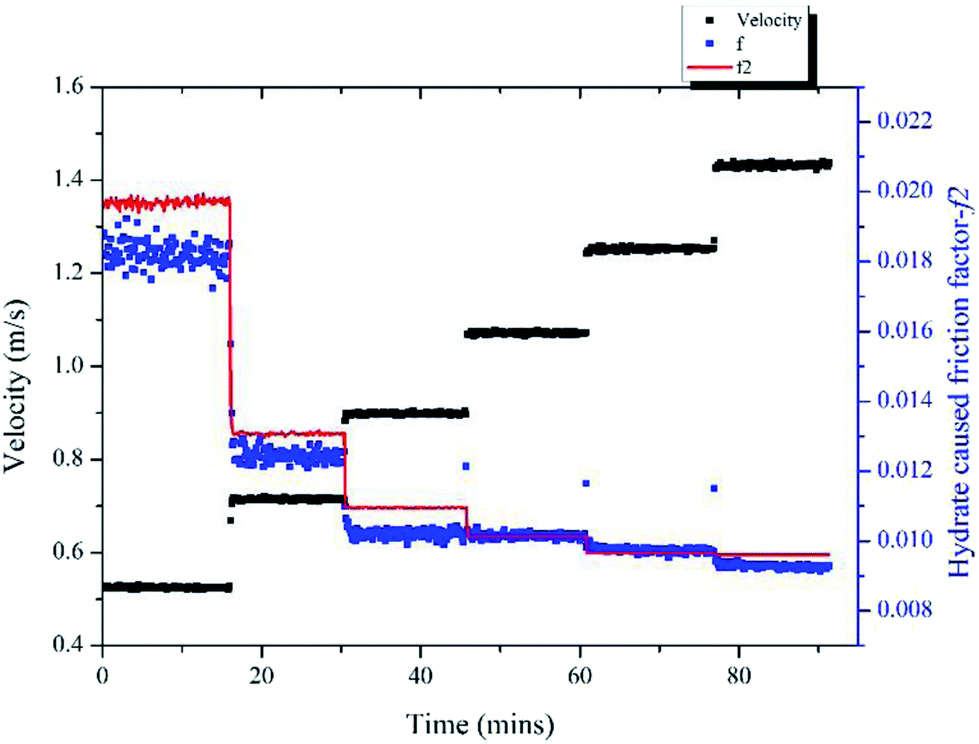
With the model proposed in Part 3.2 we can estimate the friction factor of a stable hydrate slurry flow in different velocities. A series of velocity regulation experiments with/without hydrates were carried out in a 10% water cut and 1% AA system to verify the accuracy of this model. Fig. 11 (a) shows the friction factor variation with different velocities in a condition without hydrate formation, in which the system formed a stable water/oil emulsion. Seven different velocities were tested from 0.4 m s−1 to 1.49 m s−1. It can be seen that as the velocity increased, the friction factor decreased gradually from 0.0105 to 0.0082. These values can be regarded as the f1 in eqn (4), representing the friction factors prior to hydrate formation. By contrast, after hydrate formation, variation of the friction factor with different flow velocities is shown in Fig. 11 (b). Before measuring this friction factor, we kept the system running at 6 MPa and 0 °C for at least 10 hours (depends on the duration of induction period) until the hydrates were fully formed and grown. This can be confirmed through the experimental pressure variation. When the pressure of the experimental system stops dropping and becomes stabilized, we assume that the hydrate growing process ceases. Then, the system was stabilized at a relatively small velocity for several hours, after which the pump speed was gradually lifted up to test the friction factor in different velocities. In this case the volume fraction of hydrates formed was 6.95% and the volume fraction of the unconverted water phase was 4.33%. We assumed these two parameters didn't change when changing the flow rate. In addition, variation of the particle chord length during this process is also shown in Fig. 11(b). Even though the hydrate was already fully formed before changing the velocity, the particle chord length still decreased when the velocity increased as some of the hydrate particles could be broken by the increasing flow shear force. We can note in Fig. 11(b) that the amplitude of the friction factor variation after hydrate formation is much larger than that before hydrate formation, which can range from 0.013 to 0.031. This indicates the effect of velocity is strengthened with the presence of hydrate particles.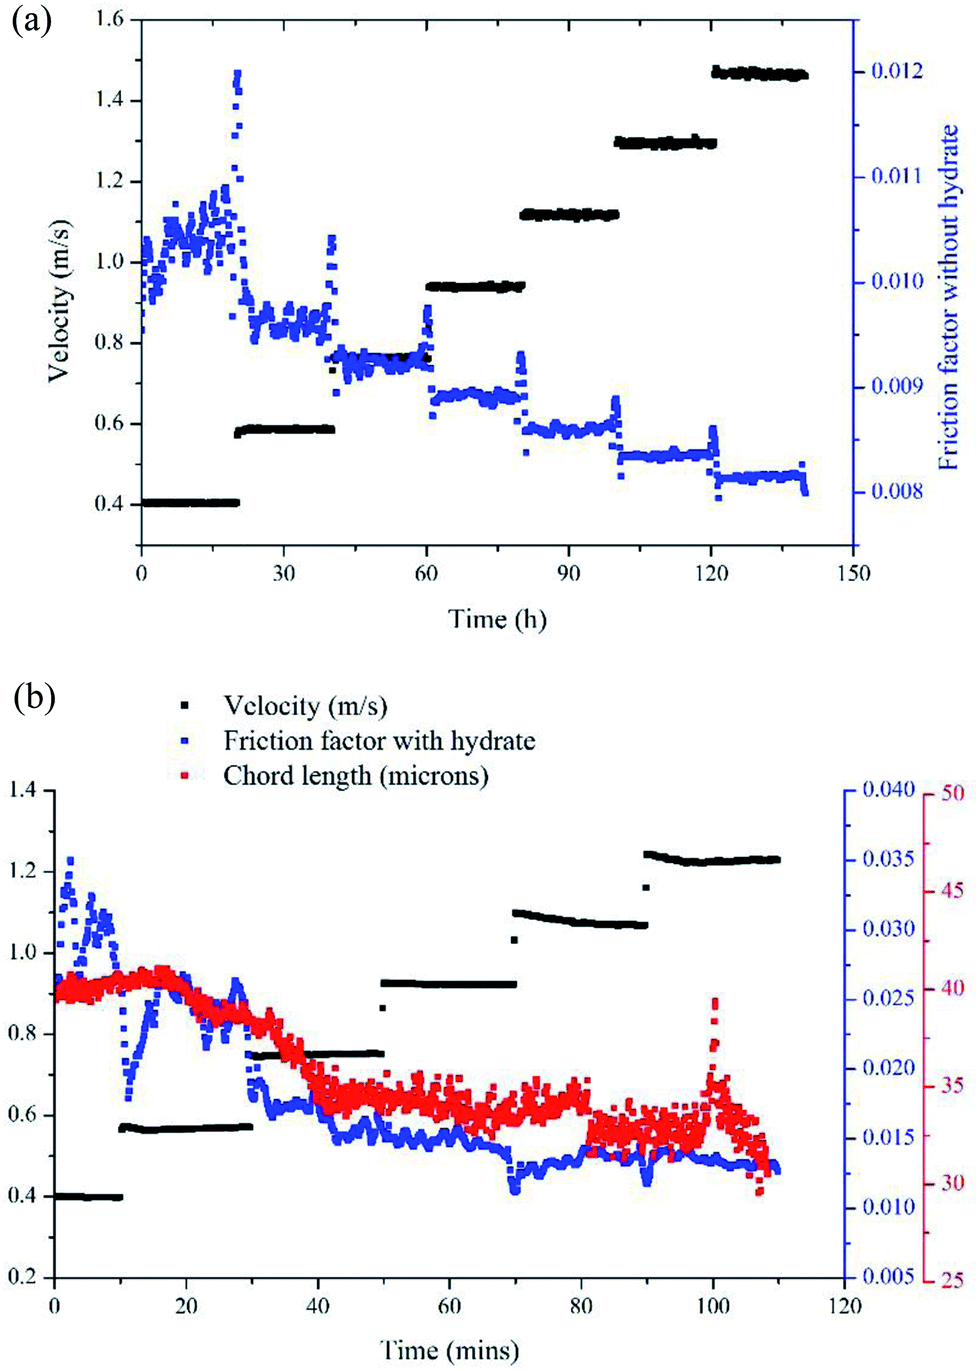 | ||
| Fig. 11 (a) Friction factors without hydrate; (b) friction factors with hydrate. | ||
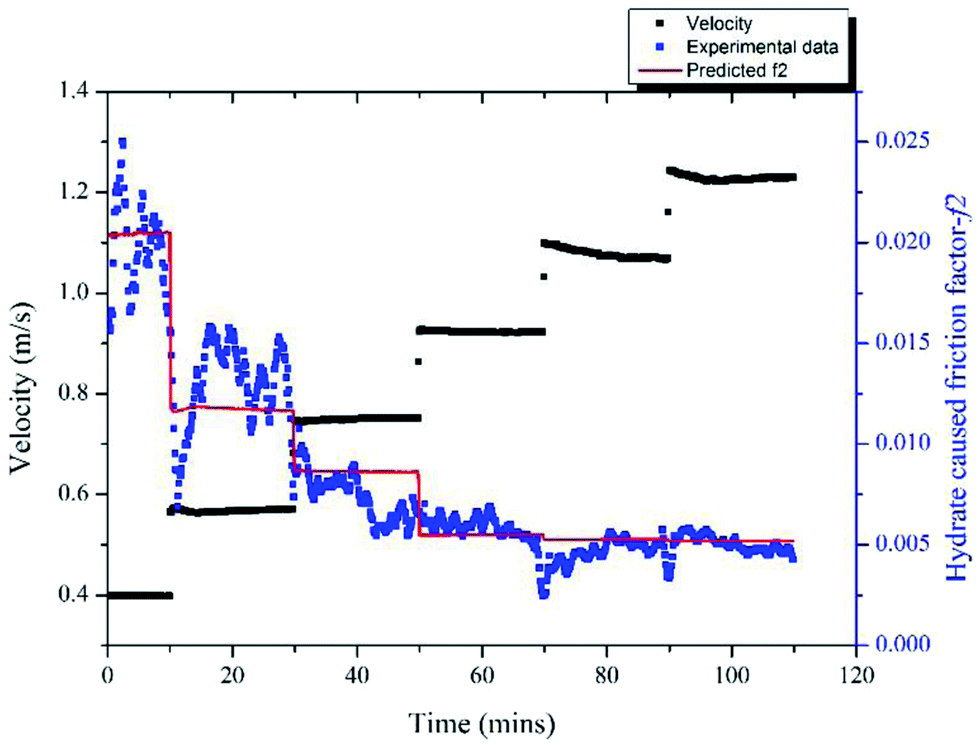
By comparing the friction factors with/without hydrate, we can get the hydrate caused friction factor-f2 for different velocities as shown in Fig. 12. The fiction factor shows an obvious jump at the velocity transition point, while for a constant velocity the friction factor is basically stable. With eqn (8) and (9) we can calculate the hydrate caused friction factor in each flow velocity, the result is shown by the red line in Fig. 12. We can see that except for the transition parts between each velocity, the above model can predict the hydrate-caused friction factor accurately. Prediction deviations between the average experimental friction factor and the predicted friction factor are shown in Table 2. The deviations are relatively larger for conditions of middle velocities and the maximum deviation value is 16.76%.
 | ||
| Fig. 12 Variation of the hydrate-caused friction factor with different velocities in 10% water cut system. | ||
| Water cut (%) | Velocity (m s−1) | Experimental f2-average | Predicted f2 | Deviations (%) |
|---|---|---|---|---|
| 10 | 0.40 | 0.01988 | 0.02043 | 2.77 |
| 0.58 | 0.01298 | 0.01175 | −9.48 | |
| 0.76 | 0.0074 | 0.00864 | 16.76 | |
| 0.92 | 0.00579 | 0.00548 | −5.35 | |
| 1.09 | 0.00464 | 0.00526 | 13.36 | |
| 1.24 | 0.00501 | 0.00519 | 3.59 | |
| 20 | 0.52 | 0.01821 | 0.01969 | 8.13 |
| 0.71 | 0.01248 | 0.01307 | 4.73 | |
| 0.90 | 0.01023 | 0.01095 | 7.04 | |
| 1.07 | 0.01016 | 0.01012 | −0.39 | |
| 1.25 | 0.00975 | 0.00966 | −0.92 | |
| 1.43 | 0.00928 | 0.00960 | 3.45 |
Same method was used to validate the model's accuracy in a 20% water cut system and the results are shown in Fig. 13. In this case, the hydrate volume fraction was 5.9% and the un-converted water volume fraction was 17.9%. Six different velocities were tested, ranging from 0.52 m s−1 to 1.43 m s−1. The prediction deviations are shown in Table 2, in which we can see that the maximum deviation is 8.13% for the 0.52 m s−1 condition.
 | ||
| Fig. 13 Variation of the hydrate-caused friction factor with different velocities in 20% water cut system. | ||
4. Conclusions
In recent years hydrate risk management strategy has become a promising method in the field of subsea flow assurance, in which it forms a hydrate slurry flow in the transportation pipelines. However, when hydrates form in the pipeline, flow property of the fluid inside would change significantly. The present study investigated the characteristics of the friction factor of hydrate slurry flow in water/oil emulsion systems.As hydrates form and grow in the liquid phase, the flow friction factor shows a significant increase. The increase of friction factor is in direct proportion with the amount of hydrate formed. Then when the hydrates are fully grown, it forms a stable hydrate slurry flow in the pipeline and the friction factor would stabilize at a constant value. Our experiments show that this final constant value varies with different flow velocities. That is as the velocity increases, the final stable friction factor will decrease apparently at first and then keep stable at a relatively small value. This phenomenon is very similar to the slurry shear thinning property that has been proposed by many researchers. A reasonable explanation was proposed by analysing the hydrate particle's force condition and distribution along pipe radius. According to the force analysis result, the hydrate particles in pipeline slurry flow have a critical suspension height, which varies with different velocities. For a smaller velocity, this critical suspension position is closer to the pipe wall bottom surface; and as the velocity increases, this critical position gradually moves away from the bottom surface and gets closer to the pipe axis. During this process, the collision between the hydrate particles and the pipe wall surface would weaken gradually. Therefore, the hydrate caused friction factor decreases with the increasing velocity. This explanation also gives a novel perspective to analyse the shear thinning property of hydrate slurry. Based on this analysis, we proposed an optimal flow region for hydrate particles: the region above 71.1% of the pipe radius (may vary with different experimental systems and particle parameters). In this region, the friction and collision between hydrate particles and pipe wall surface can be ignored and so in this region the friction factor has the minimum value. Also, in this region the friction factor almost doesn't change with the flow rate, which means the particle flow in this region is quite stable. For an actual running pipeline, if we make the hydrate particles flow in this optimal region by controlling the flow rate, we can not only reduce the operating energy consumption but also keep the flow line running stably.
In addition, a model associated with particle properties and slurry flow velocity was proposed in this work to estimate the hydrate caused friction factor. A new method was used in this model to quantify the effective hydrate volume fraction, considering not only the hydrate volume fraction but also the volume fraction of the unconverted water phase. This method enabled the model to be more reasonable and closer to the engineering practice. By comparing the experimental data and the model predicted results, this model has been verified to have a good prediction accuracy for 10% and 20% water cut W/O emulsion systems.
Conflicts of interest
There are no conflicts to be declare.Acknowledgements
This work was supported by the National Natural Science Foundation of China (No. 51534007), National Key Research and Development Plan (No. 2016YFC0303704), National Science and Technology Major Project of China (No. 2016ZX05028004-001, and 2016ZX05066005-001), Science Foundation of China University of petroleum-Beijing (No. C201602), which are gratefully acknowledged.References
- E. D. Sloan and C. A. Koh, Clathrate Hydrates of Natural Gases, Chem Ind-Ser, 3rd edn, 2008, vol. 119, pp. 1–701 Search PubMed.
- E. D. Sloan, C. Koh, A. K. Sum, A. L. Ballard, J. Creek, M. Eaton, J. Lachance, N. McMullen, T. Palermo, G. Shoup and L. Talley, Natural Gas Hydrates in Flow Assurance, 2011, pp. 1–200 Search PubMed.
- E. G. Hammerschmidt, Formation of gas hydrates in natural gas transmission lines, Ind. Eng. Chem., 1934, 26(8), 851–855 CrossRef CAS.
- P. Bollavaram, Hydrate plug dissociation in pipelines by pressure reduction: experiment and modeling, Colorado School of Mines, Arthur Lakes Library, 2002 Search PubMed.
- S. Zarinabadi and A. Samimi, Problems of hydrate formation in oil and gas pipes deals, Am. J. Sci., 2012, 8(8), 1007–1010 Search PubMed.
- J. Carroll, Natural gas hydrates: a guide for engineers, Gulf Professional Publishing, 2014 Search PubMed.
- E. D. Sloan, C. A. Koh, A. K. Sum, A. L. Ballard, G. J. Shoup, N. McMullen, J. L. Creek and T. Palermo, Hydrates: state of the art inside and outside flowlines, J. Pet. Technol., 2009, 61(12), 89–94 CrossRef.
- A. K. Sum, C. A. Koh and E. D. Sloan, A comprehensive view of hydrates in flow assurance: past, present and future, in Proc. of the 8th International Conference on Gas Hydrates (ICGH 2014), Beijing, China, 2014 Search PubMed.
- N. Daraboina, P. Linga and J. Ripmeester, et al., Natural gas hydrate formation and decomposition in the presence of kinetic inhibitors. Stirred reactor experiments, Energy Fuels, 2011, 25(10), 4384–4391 CrossRef CAS.
- Ke-L. Yan, C.-Y. Sun and J. Chen, et al., Flow characteristics and rheological properties of natural gas hydrate slurry in the presence of anti-agglomerant in a flow loop apparatus, Chem. Eng. Sci., 2014, 106, 99–108 CrossRef CAS.
- M. Cha, K. Shin and J. Kim, et al., Thermodynamic and kinetic hydrate inhibition performance of aqueous ethylene glycol solutions for natural gas, Chem. Eng. Sci., 2013, 99, 184–190 CrossRef CAS.
- A. Delahaye, L. Fournaison and S. Jerbi, et al., Rheological properties of CO2 hydrate slurry flow in the presence of additives, Ind. Eng. Chem. Res., 2011, 50(13), 8344–8353 CrossRef CAS.
- P. U. Karanjkar, A. Ahuja and G. Zylyftari, et al., Rheology of cyclopentane hydrate slurry in a model oil-continuous emulsion, Rheol. Acta, 2016, 55(3), 235–243 CrossRef CAS.
- M. Darbouret, M. Cournil and J.-M. Herri, Rheological study of TBAB hydrate slurries as secondary two-phase refrigerants, Int. J. Refrig., 2005, 28(5), 663–671 CrossRef CAS.
- P. Clain, A. Delahaye, L. Fournaison, N. Mayoufi, D. Dalmazzone and W. Fürst, Rheological properties of tetra-n-butylphosphonium bromide hydrate slurry flow, Chem. Eng. J., 2012, 193, 112–122 CrossRef.
- K. L. Pinder, Time dependent rheology of the tetrahydrofuran-hydrogen sulphide gas hydrate slurry, Can. J. Chem. Eng., 1964, 42(3), 132–138 CrossRef CAS.
- V. Andersson and J. S. Gudmundsson, Flow properties of hydrate-in-water slurries, Ann. N. Y. Acad. Sci., 2000, 912(1), 322–329 CrossRef CAS.
- P. Mills, Non-Newtonian behaviour of flocculated suspensions, J. Phys., Lett., 1985, 46(7), 301–309 CrossRef CAS.
- R. Camargo and T. Palermo, Rheological properties of hydrate suspensions in an Asphaltenic Crude Oil, in Proc. of the 4th International Conference on Gas Hydrates (ICGH 2014), Yokohama, Japan, 2002 Search PubMed.
- P. Doron and D. Barnea, Pressure drop and limit deposit velocity for solid-liquid flow in pipes, Chem. Eng. Sci., 1995, 50(10), 1595–1604 CrossRef CAS.
- Y. Peysson, Collision process between particles in the transport of dispersed hydrates in production lines, in Proceedings of the 5th International Conference on Gas Hydrate, 2005 Search PubMed.
- H. Karin and S. Nuland, Hydrate slurry rheology in the petroleum industry, Annual Transactions-Noridc Rheology Society, vol. 15, 2007, p. 197 Search PubMed.
- S. V. Joshi, G. A. Grasso and P. G. Lafond, et al., Experimental flowloop investigations of gas hydrate formation in high water cut systems., Chem. Eng. Sci., 2013, 97, 198–209 CrossRef CAS.
- W. Q. Li, D. Yu and H. H. Wu, et al., Designing and construction of a high pressure hydrate/wax deposition flow loop, Res. Explor. Lab., 2011, 30(12), 13–16 CAS.
- L. Ding, B. Shi and J. Wang, et al., Hydrate Deposition on Cold Pipe Walls in Water-in-Oil (W/O) Emulsion Systems, Energy Fuels, 2017, 31.9, 8865–8876 CrossRef.
- G. J. Chen, W. Z. Li and Q. P. Li et al., China Patent 201110096579.2, 2011.
- R. A. Bagnold, Experiments on a gravity-free dispersion of large solid spheres in a Newtonian fluid under shear, Proc. R. Soc. London, Ser. A, 1954, 225(1160), 49–63 CrossRef.
- P. G. T. Saffman, The lift on a small sphere in a slow shear flow, J. Fluid Mech., 1965, 22(2), 385–400 CrossRef.
| This journal is © The Royal Society of Chemistry 2018 |