 Open Access Article
A new red fluorophore with aggregation enhanced emission by an unexpected “One-step” protocol†
Rui Wanga,
Meili Houa,
Zhigang Xu a,
Luxi Tan
 c,
Cheng Zhong*b and
Linna Zhu
 *a
*a
aChongqing Key Laboratory for Advanced Materials and Technologies of Clean Energy, Faculty of Materials & Energy, Southwest University, Chongqing 400715, P. R. China. E-mail: lnzhu@swu.edu.cn
bDepartment of Chemistry, Hubei Key Lab on Organic and Polymeric Optoelectronic Materials, Wuhan University, Wuhan 430072, P. R. China. E-mail: zhongcheng@whu.edu.cn
cSchool of Chemistry and Chemical Engineering, Chongqing University, Chongqing 401331, P. R. China
First published on 18th May 2018
Abstract
In this work, a triphenylamine-benzothiadiazole-based new fluorophore is obtained from a facile “one-step” protocol. A possible reduction mechanism is proposed, and an amine containing α-H plays a key role in the reduction reaction. The resultant product A1H2 exhibits bright red emission in solid state, with an absolute quantum yield of 44.5%. Aggregation induced emission enhancement of A1H2 is also observed with the increased water fraction in THF-H2O mixture. The nanoparticles of A1H2 reveal good stability and biocompatibility, which are successfully applied in cellular cytoplasm imaging.
Introduction
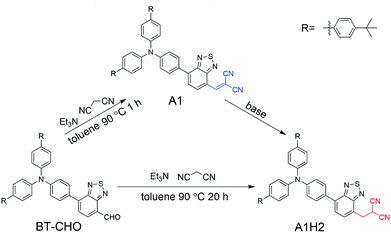
Owing to their non-toxicity, good photostability as well as biodegradability,1 fluorescent organic nanoparticles (FONs) have revealed promising potential in fluorescence imaging, molecular probes and biosensors.2 However, many organic fluorophores suffer from aggregation-caused quenching (ACQ) when formed into nano-aggregates. Therefore, molecules exhibiting aggregation-induced emission (AIE) or aggregation-induced emission enhancement (AIEE) properties are highly desirable, and much effort has been made in developing such aggregation enhanced emission system during the past decades.3 Among these AIEE systems, red luminescent molecules are of special interests for biosensing and bioimaging, because they could minimize photodamage to living cells, deepen the tissue penetration and surpass the biological background fluorescence interference.4 However, since the extended conjugation length (usually required for achieving red emission) or the non-ideal electron donor–acceptor combination easily leads to ACQ characteristics,5 development of red AIE/AIEE fluorophore remains a big challenge.In this work, initially, we aim to synthesize a triphenylamine-benzothiadiazole-based red fluorophore A1 via Knoevenagel condensation reaction from the corresponding aldehyde and malononitrile. Generally, the aromatic aldehyde and malononitrile undergo typical condensation to produce a dicyanoethyl group (as the structure of A1 in Scheme 1, marked in blue). Unexpectedly, in our case, its reduction product A1H2 is directly obtained from such a reaction with no extra catalysts involved. A1 is later obtained within a shorter reaction duration. More interestingly, A1H2 shows strong red emission in the aggregation state with the maximum emission wavelength exceeding 640 nm, whereas the more conjugated A1 has no obvious emission neither in solution nor in solid state. The resultant nanoparticles of A1H2 (NPs-A1H2) exhibit bright red emission with good stability and biocompatibility. Accordingly, the NPs-A1H2 are successfully applied in cellular cytoplasm imaging.
Results and discussion
The synthetic routes for A1H2 are depicted in Scheme 1. The condensation product A1 was obtained in the initial stage of the reaction (less than 1 h). Upon further increasing the reaction time (about 20 h), A1 will completely convert into the reduced product A1H2 spontaneously. To elucidate possible reaction pathways, three parallel experiments were carried out, using A1 as the main reactant, and triethylamine or malononitrile was added separately to A1 in toluene (Scheme S2†). The adduct formation process was monitored by High Performance Liquid Chromatography (HPLC). As shown in Fig. S1,† the pure A1 and A1H2 have a retention time of 31.5 min and 19.7 min, respectively. For the three parallel reaction systems, the condensation product A1 remained the same in systems without triethylamine, while the reduction product A1H2 could only be detected in reaction system containing triethylamine (route 3, Scheme S2†). Different bases (piperidine, diethylamine and hexylamine) were also used during the conversion from A1 to A1H2, respectively. The results were monitored using TLC plate (CH2Cl2![[thin space (1/6-em)]](https://www.rsc.org/images/entities/char_2009.gif) :
:![[thin space (1/6-em)]](https://www.rsc.org/images/entities/char_2009.gif) PE = 1
PE = 1![[thin space (1/6-em)]](https://www.rsc.org/images/entities/char_2009.gif) :
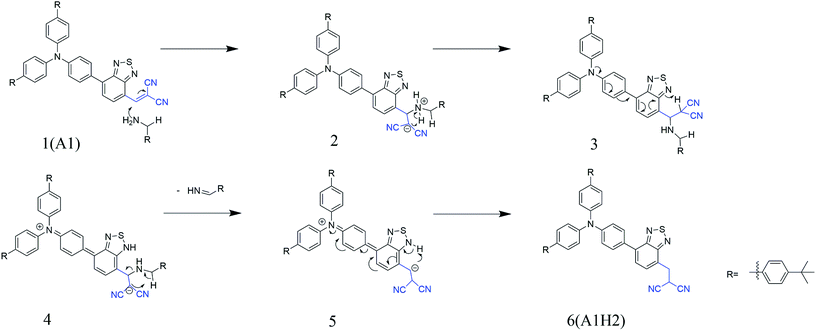
:![[thin space (1/6-em)]](https://www.rsc.org/images/entities/char_2009.gif) 1) (Fig. S2†). It was found that A1H2 was obtained after reacting for a long time (more than 12 h) in the presence of piperidine or diethylamine. In striking contrast, A1H2 was obtained within several minutes when hexylamine was added to the solution of A1. This might be ascribed to the smaller steric hindrance of the primary amine compared with the secondary and tertiary amine, and the primary amine may participate in the conversion from A1 to A1H2 directly, consequently, the reaction rate is significantly accelerated. To further study the possible mechanism, amantadine (3 mg) was used to react with A1 (10 mg) in toluene (5 mL) and stirred at 90 °C for 24 h under argon. Amantadine is an amine without α-H, which distinguishes it from other amines we used in this paper. The result was monitored by TLC (Fig. S3†). It is clear from the TLC result that no reducing product (A1H2) was detected. Based on these results, a possible mechanism is proposed, shown in Scheme 2. Firstly, dicyanovinyl group in A1 is attacked by amine, making the dicyanomethylene moiety negatively charged. And the hydrogen on amine is able to be attracted by the carbanion on dicyanovinyl moiety, followed by proton transfering to the benzothiadiazole group. Then, the R = NH is released by eliminating the α-H of amine, leaving negative charge on the dicyanovinyl moiety, which could be neutralized by getting a proton from the benzothiadiazole-H. Therefore, when amantadine without α-H is used, A1 cannot be reduced to A1H2.
1) (Fig. S2†). It was found that A1H2 was obtained after reacting for a long time (more than 12 h) in the presence of piperidine or diethylamine. In striking contrast, A1H2 was obtained within several minutes when hexylamine was added to the solution of A1. This might be ascribed to the smaller steric hindrance of the primary amine compared with the secondary and tertiary amine, and the primary amine may participate in the conversion from A1 to A1H2 directly, consequently, the reaction rate is significantly accelerated. To further study the possible mechanism, amantadine (3 mg) was used to react with A1 (10 mg) in toluene (5 mL) and stirred at 90 °C for 24 h under argon. Amantadine is an amine without α-H, which distinguishes it from other amines we used in this paper. The result was monitored by TLC (Fig. S3†). It is clear from the TLC result that no reducing product (A1H2) was detected. Based on these results, a possible mechanism is proposed, shown in Scheme 2. Firstly, dicyanovinyl group in A1 is attacked by amine, making the dicyanomethylene moiety negatively charged. And the hydrogen on amine is able to be attracted by the carbanion on dicyanovinyl moiety, followed by proton transfering to the benzothiadiazole group. Then, the R = NH is released by eliminating the α-H of amine, leaving negative charge on the dicyanovinyl moiety, which could be neutralized by getting a proton from the benzothiadiazole-H. Therefore, when amantadine without α-H is used, A1 cannot be reduced to A1H2.
We speculate that the “one-step” protocol is able to be realized because there is a strong electron-deficient benzothiadiazole (BT unit) in A1, which makes the dicyanovinyl quite easily being reduced under basic condition (particularly primary amine). To verify this speculation, A2 incorporating a strong electron-donor 3,4-ethylenedioxythiophene (EDOT) to replace the BT segment was synthesized (Scheme S3†). However, the reducing product was not detected even after 24 h in the same condition of preparing A1H2, further confirming the effect of the electron-deficient BT unit in the reduction process. To further illustrate this issue, the primary amine (hexylamine) is used in the reaction of A2. After reacting for 24 h, the majority of A2 remains the same, and no reducing product of A2 appears, indicating A2 is difficult to be reduced compared to A1, as is shown in Fig. S4.† It has been widely reported that the reductive Knoevenagel condensation products can be obtained with the existence of expensive catalysts such as Pd/C,6 rhodium (Rh) catalysts7 or in the presence of active hydrogen sources like Hantzsch ester,8 CaH2 (ref. 9) and so forth. As far as we know, one-step Knoevenagel condensation/reduction without additional introduction of catalysts/active hydrogen source is rarely reported so far. According to the above results, such “one-step” protocol might easily be realized by incorporating electron-deficient unit adjacent to the dicyanovinyl moiety.
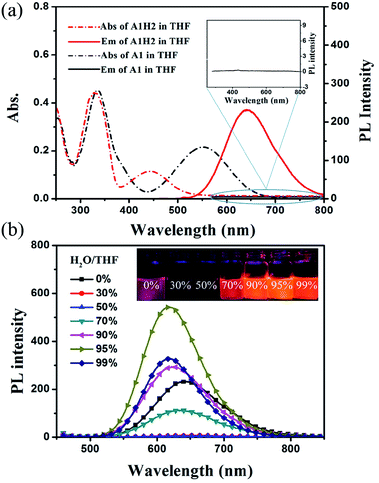
The absorption and emission spectra of A1H2 in THF are presented in Fig. 1a, with that of A1 for comparison. A1 exhibits two absorption bands at 335 nm and 553 nm, respectively. The absorption band at 335 nm could be ascribed to the π–π* transition, while the band at 553 nm corresponds to the charge transfer (CT) from the triphenylamine framework to the electron-withdrawing benzothiadiazole and dicyanovinyl moieties. Similar spectra are observed for A1H2, except that the CT band in A1H2 is blue-shifted compared to that in A1, because after hydrogenation of the double bond, the conjugation and electron-withdrawing ability of the acceptor is weakened in A1H2. We also note that A1 is almost non-fluorescent in THF, probably caused by the strong intramolecular charge transfer and the strong diploe–diploe interaction.10 In contrast, A1H2 exhibits a weak purple fluorescence in THF (ΦF.l: 17.2%), and a strong bright red emission in the solid state (ΦF.s: 44.5%) (Table 1). The bulky tert-butylbenzene moiety could effectively impede the unfavourable molecular aggregation in A1H2, and the generated dicyanoethyl also contribute to bond rotation in A1H2, and thus strong emission in the solid state is observed.5 In the meantime, it is noteworthy that the reductive product A1H2 exhibits large Stokes shift up to 190 nm, which is beneficial for circumventing fluorescence quenching and eliminating background interference.11
| Compound | λabsa/nm | Eoptgb/eV | Ecalcgc/eV | Electron affinity | λemd/nm | ||
|---|---|---|---|---|---|---|---|
| solne, ΦF.l | aggre, ΦF.a | solide, ΦF.s | |||||
a Absorption maximum (λabs) in THF.b The optical band gap (Eoptg) calculated from the onset wavelength in the absorption spectrum.c HOMO–LUMO band gap (Ecalcg) calculated from theoretical DFT calculations.d Emission maximum (λem) derived from THF solution (soln, 10 μM), THF/water mixture (aggr, 5![[thin space (1/6-em)]](https://www.rsc.org/images/entities/char_2009.gif) : :![[thin space (1/6-em)]](https://www.rsc.org/images/entities/char_2009.gif) 95 v/v for A1H2; 10 μM) and in the solid state, respectively.e ΦF is the fluorescence quantum efficiency measured by a calibrated integrating sphere. 95 v/v for A1H2; 10 μM) and in the solid state, respectively.e ΦF is the fluorescence quantum efficiency measured by a calibrated integrating sphere. |
|||||||
| A1H2 | 445 | 2.40 | 2.77 | 2.39 | 643 (17.2%) | 616 (35.8%) | 636 (44.5%) |
| A1 | 553 | 1.90 | 2.15 | 3.25 | n.d. | n.d. | n.d |
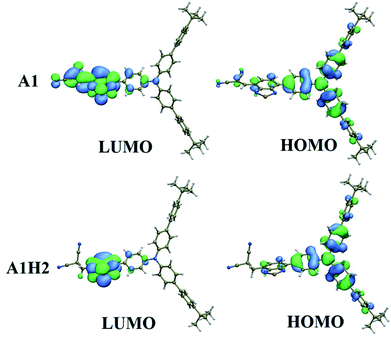
To better understand the properties of A1H2, theoretical calculations were performed using the density functional theory (DFT) method at the B3LYP/6-31G (d)* level.12 A1 is also calculated for comparison. For both compounds, the HOMO levels are mainly localized over the TPA framework, and also partly distributed on the BT unit and the adjacent groups, while LUMO is primarily distributed on the acceptor moieties such as BT and malononitrile (Fig. 2). The HOMO–LUMO band gaps are calculated to be 2.15 and 2.77 eV for A1 and A1H2, respectively, which fit well with the experimental results, as calculated from the onset wavelength in the absorption spectrum (Table 1).13 Compared to A1, the hydrogenation of the dicyanovinyl group leads to weaker electron-withdrawing ability, and thus the energy bandgap of A1H2 is larger than that of A1. On the other hand, the electron affinity of A1 and A1H2 are calculated to be 3.25 and 2.39 respectively, suggesting that A1 has a stronger tendency to accept electrons in comparison with A1H2.
Since A1H2 is strongly emitting in the solid state, the emission properties of A1H2 are also studied in THF/water mixtures, as shown in Fig. 1b. In THF, A1H2 exhibits light purple emission with the maximum band at 643 nm. Upon gradual addition of water into THF (fw≤60%, fw stands for water fraction in THF-water mixtures), the emission of A1H2 is quenched dramatically. Whereas, fluorescence intensity increases with continuing increase in fw, indicating aggregation induced emission enhancement feature of A1H2.3e,14 The emission intensity reaches the maximum when water fraction is 95%. It is noteworthy that the absolute fluorescence quantum yields (ΦF) of A1H2 in THF-water (fw = 95%) is as high as 35.8%, which is a relatively high value among previously reported red-emissive AIE molecules.2b,15 Additionally, the absorption spectra is conducted at different water/THF concentrations, as shown in Fig. S6.† It is clear that the absorption maximum exhibits a slight blue shift with water fraction increasing to 50%. This blue shift originates from the formation of H-aggregates, which leads to emission quenching. When more water is added, the intramolecular rotations are further restricted contributing to the enhanced light emission.16 In the meantime, molecules get more distorted in the aggregation state. Thus, the weakened intermolecular interaction with the increase of water fraction should be responsible for the blue shift of emission wavelength in the nanoparticles. Given the merits of red emission and high fluorescence efficiency, A1H2 has great potential to be a candidate for bio-imaging applications.
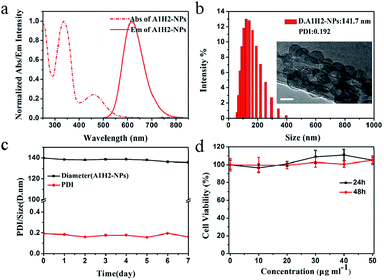
A1H2-NPs are prepared using a reprecipitation method.1b Fig. 3a shows the absorption and emission spectral of A1H2-NPs dispersed in water. The absorption peak of the A1H2 nanoparticles exhibits a slight bathochromic shift of ∼15 nm relative to that measured in THF, owing to the formation of J-aggregates.17 While the emission maximum of A1H2-NPs appears at 616 nm, corresponding to a blue-shift of 27 nm compared with that measured in THF. The blue-shift in emission maximum is probably ascribed to the more twisted conformation of A1H2 molecules in the nano-aggregates.3g,18 Dynamic light scattering (DLS) measurements reveal that the nanoparticles formed have a volume averaged hydrodynamic diameter of 141.7 nm with a PDI of 0.192 (Fig. 3b). Zeta-potential of A1H2-NPs in aqueous solution is measured to be −35.0 mV. The high negative surface of the NPs demonstrates the formation of hydrogen bonds between H2O and the N atoms in benzothiadiazole and malononitrile moieties.19 Definitely, the negative surface will improve the dispersion stability of the nanoparticles due to the electrostatic repulsion effect. The morphology of A1H2-NPs is further investigated using TEM, as shown in Fig. 3b. Spherical nanoparticles with diameters of around 70 nm are observed.
The size and PDI values of the as-prepared NPs are monitored for 7 days in a row, as shown in Fig. 3c. It is observed that the size of NPs remains around 140 nm from DLS results, and PDI is still below 0.20. Therefore, the as-prepared NPs could be stably dispersed in water and maintained for a long period. On the other hand, the stability of A1H2-NPs in buffer solutions at different pH values is also examined (Fig. S7†). Fluorescence intensity of the NPs does not show significant changes with pH ranging from 2 to 9, demonstrating that the A1H2-NPs have excellent physiological performance over a wide range of pH values. These results make A1H2-NPs favourable for bio-imaging applications. Fig. 3d shows the cell viabilities after incubation with the A1H2-NPs suspension at different concentrations ranging from 10 to 50 μg mL−1 for 24 and 48 h, respectively. Little change in cell viability is detected in these conditions, suggesting that the A1H2-NPs have almost no cytotoxicity toward HeLa cells even at a high concentration of 50 μg mL−1 for 48 h.
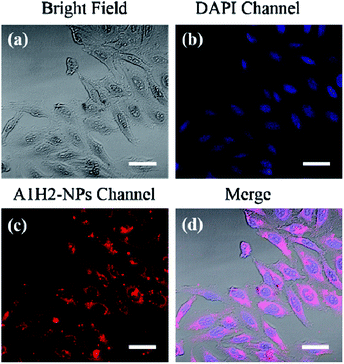
Fluorescence imaging is performed on HeLa cells to verify the cellular uptake and localization of the A1H2-NPs. DAPI was chosen to stain the nuclei before cellular imaging. When DAPI molecules and A1H2-NPs were used in cell staining, blue fluorescence from DAPI channel could be observed in the cell nucleus, and the red fluorescence is detected in the cytoplasm of the HeLa cells using A1H2-NPs (Fig. 4b and c). The merged image in Fig. 4d suggests the excellent overlapping. These results indicate that the as-prepared A1H2-NPs are biocompatible with HeLa cells and can function as an effective visualizer for cellular cytoplasm imaging.
Conclusions
In summary, a new red fluorophore A1H2 is synthesized through an unexpected “one-step” protocol. Strong electron-withdrawing group adjacent to dicyanovinyl is demonstrated to be a prerequisite structural requirements. Amine with α-H is also an important factor for the reduction to take place. A1H2 exhibits bright red emission in solid state, with a high fluorescence quantum yield. A1H2-NPs are prepared, and are successfully applied for cellular cytoplasm imaging. The discovery in this work may provide new insight into realizing red emission fluorophore with aggregation enhanced emission feature.Experimental section
General methods
The materials used in experiments were purchased from J&K Chemical or HWRK Chem Co. and were used without further purification. Tetrahydrofuran (THF) and toluene were distilled over Na–K alloy under argon ambience prior to use. Other solvents were provided by local agents. The 1H NMR and 13C NMR spectra were recorded on a BRUKER AVANCE III 600 MHz NMR Instrument (in CDCl3). HRMS was performed on a Thermo Scientific Q Exactive instrument. High Performance Liquid Chromatography (HPLC) was performed on a QS-C18 column with mobile phase of acetonitrile at a flow rate of 1.0 mL min−1. UV-vis absorption spectra were measured on a LAMBDA 950 UV/Vis/NIR Spectrophotometer. FL spectra were studied on Hitachi F-7000 spectrophotometer. The size distributions and Zeta-potential of the NPs in aqueous solution were measured by the dynamic light scattering technique with a Malvern Zetasizer Nano ZS90. The morphology of the NPs was observed using a JSM-2100. Fluorescence quantum yields were measured using an absolute PL quantum yield spectrometer C11347 Hamamatsu.General procedure for the preparation of A1
To a solution of A1-3 (300 mg, 0.45 mmol) and malononitrile (90 mg, 1.36 mmol) in 15 mL of toluene was added 0.20 mL of triethylamine. After being stirred at 90 °C for 1 h under argon atmosphere, the reaction mixture was poured into water and then extracted with CH2Cl2. The organic extract was dried over anhydrous Na2SO4 and was further purified by column chromatography using a dichloromethane/hexanes (1![[thin space (1/6-em)]](https://www.rsc.org/images/entities/char_2009.gif) :
:![[thin space (1/6-em)]](https://www.rsc.org/images/entities/char_2009.gif) 1) mixture as the eluent. Compound A1 was isolated as a dark powder in 68% yield. 1H NMR (600 MHz, CDCl3) δ 8.83 (s, 1H), 8.79 (d, J = 7.8 Hz, 1H), 8.02 (d, J = 9.0 Hz, 2H), 7.88 (d, J = 7.8 Hz, 1H), 7.57 (dd, J = 12.5, 8.5 Hz, 8H), 7.48 (d, J = 9.0 Hz, 4H), 7.30 (d, J = 9.0 Hz, 6H), 1.37 (s, 18H). 13C NMR (150 MHz, CDCl3) δ 153.63, 151.74, 149.24, 148.67, 144.69, 138.97, 136.48, 135.96, 129.84, 129.74, 127.70, 127.00, 125.44, 124.92, 124.76, 124.67, 120.91, 120.63, 112.91, 112.13, 81.33, 33.53, 30.36. MALDI-TOF-MS: calcd for C48H41N5S: 719.3077, found 719.3079.
1) mixture as the eluent. Compound A1 was isolated as a dark powder in 68% yield. 1H NMR (600 MHz, CDCl3) δ 8.83 (s, 1H), 8.79 (d, J = 7.8 Hz, 1H), 8.02 (d, J = 9.0 Hz, 2H), 7.88 (d, J = 7.8 Hz, 1H), 7.57 (dd, J = 12.5, 8.5 Hz, 8H), 7.48 (d, J = 9.0 Hz, 4H), 7.30 (d, J = 9.0 Hz, 6H), 1.37 (s, 18H). 13C NMR (150 MHz, CDCl3) δ 153.63, 151.74, 149.24, 148.67, 144.69, 138.97, 136.48, 135.96, 129.84, 129.74, 127.70, 127.00, 125.44, 124.92, 124.76, 124.67, 120.91, 120.63, 112.91, 112.13, 81.33, 33.53, 30.36. MALDI-TOF-MS: calcd for C48H41N5S: 719.3077, found 719.3079.
Synthesis of compound A1H2
A1H2 was synthesized following the same method as that of A1. Except it was reacted for another 19 h. Reddish powder in 37% yield. 1H NMR (600 MHz, CDCl3) δ 7.87 (d, J = 8.4 Hz, 2H), 7.69 (d, J = 7.2 Hz, 1H), 7.66 (d, J = 7.2 Hz, 1H), 7.54 (d, J = 8.4 Hz, 8H), 7.46 (d, J = 7.8 Hz, 4H), 7.29 (d, J = 8.4 Hz, 2H), 7.27 (s, 2H), 7.25 (s, 2H), 4.76 (t, J = 7.8 Hz, 1H), 3.82 (d, J = 7.8 Hz, 2H), 1.37 (s, 18H). 13C NMR (150 MHz, CDCl3) δ 153.32, 152.71, 149.04, 147.37, 146.23, 136.64, 136.21, 133.93, 130.04, 129.14, 129.08, 126.86, 125.64, 125.39, 124.72, 124.09, 122.72, 121.98, 111.31, 33.51, 33.43, 30.37, 21.66. HRMS (APCI): calcd for C48H44N5S [M + H]+: 722.3319, found 722.3331.Preparation of the A1H2-NPs
A1H2-NPs were prepared using a reported reprecipitation method. Two hundred microliters of the A1H2/THF solution (1 mg mL−1) was quickly added to 5 mL of deionized water under vigorous stirring for 10 min at room temperature. And then, the A1H2-NPs suspension was sonicated for another 30 min under room temperature. The residual THF was removed by stirring slowly for two days.Cytotoxicity by prestoblue assay
The cytotoxicity of The A1H2-Nps against HeLa cells was assessed by Prestoblue Cell Viability reagent (invitrogen, USA). The HeLa cells were plated in 96-well plates. After growing overnight, cells were treated with 200 μL A1H2-NPs at various concentrations (10, 20, 30, 40 and 50 μg mL−1) for 24 and 48 h at 37 °C in the presence of 5% CO2, and then the original medium in each well was removed. Subsequently, 100 μL of the PrestoBlue® reagent was diluted to a final concentration of 10% and was added to the wells, and the cells were incubated for 1 h. PrestBlue assay was employed to measure the cell viability of samples. Resazurin, a non-fluorescent blue compound in PrestoBlue® reagent with a maximum absorption at 600 nm can be reduced by living cells to resorufin with a maximum absorption at 570 nm, which shows a red emission. Cell viability can be calculated relative to the control cells without treatment, by measuring the absorbance at 570 and 600 nm, respectively.Live cell imaging experiments
HeLa cells were cultured with DMEM containing 10% FBS in 37 °C and 5% CO2 with a humidified atmosphere. Then, the cells were seeded on six well plates and allowed to adhere at 37 °C and 5% CO2 for overnight. The A1H2-NPs in PBS buffer as control were added to each plate (final concentration [A1H2-NPs] = 20 μg mL−1). The medium was removed after incubation at 37 °C for 4 h, and the plates were washed several times with PBS buffer. Before the treated cells were fixed, the cell nuclei were stained by 4′,6-diamidino-2-phenylindole (DAPI) for 20 min. Finally, fluorescent images were observed with Zeiss LSM 510 confocal laser scanning microscope.Conflicts of interest
There are no conflicts to declare.Acknowledgements
The authors thank the National Natural Science Foundation of China (No.51203046 and No. 51203121), the “Fundamental Research Funds for the Central Universities” (XDJK2017D001) and Chongqing Science and Technology Commission (cstc2013jcyjA50001 and cstc2016jcyjA0078) for financial support.Notes and references
- (a) J. Wang, X. Xu, L. Shi and L. Li, ACS Appl. Mater. Interfaces, 2013, 5, 3392–3400 CrossRef PubMed; (b) J. Zhang, R. Chen, Z. Zhu, C. Adachi, X. Zhang and C.-S. Lee, ACS Appl. Mater. Interfaces, 2015, 7, 26266–26274 CrossRef PubMed; (c) D. T. Jayaram, S. Ramos-Romero, B. H. Shankar, C. Garrido, N. Rubio, L. Sanchez-Cid, S. B. Gómez, J. Blanco and D. Ramaiah, ACS Chem. Biol., 2016, 11, 104–112 CrossRef PubMed; (d) W. Qin, D. Ding, J. Liu, W. Z. Yuan, Y. Hu, B. Liu and B. Z. Tang, Adv. Funct. Mater., 2012, 22, 771–779 CrossRef; (e) E. Genin, Z. Gao, J. A. Varela, J. Daniel, T. Bsaibess, I. Gosse, L. Groc, L. Cognet and M. Blanchard-Desce, Adv. Mater., 2014, 26, 2258–2261 CrossRef PubMed.
- (a) W. Zhang, B. Tang, X. Liu, Y. Liu, K. Xu, J. Ma, L. Tong and G. Yang, Analyst, 2009, 134, 367–371 RSC; (b) A. Nicol, W. Qin, R. T. K. Kwok, J. M. Burkhartsmeyer, Z. Zhu, H. Su, W. Luo, J. W. Y. Lam, J. Qian, K. S. Wong and B. Z. Tang, Chem. Sci., 2017, 8, 4634–4643 RSC; (c) J. Zhou, V. K. Outlaw, C. A. Townsend and A. E. Bragg, Chem.–Eur. J., 2016, 22, 15212–15215 CrossRef PubMed; (d) K. Tateno, R. Ogawa, R. Sakamoto, M. Tsuchiya, T. Otani and T. Saito, Org. Lett., 2014, 16, 3212–3215 CrossRef PubMed; (e) V. K. Outlaw, J. Zhou, A. E. Bragg and C. A. Townsend, RSC Adv., 2016, 6, 61249–61253 RSC.
- (a) W. Qin, K. Li, G. Feng, M. Li, Z. Yang, B. Liu and B. Z. Tang, Adv. Funct. Mater., 2014, 24, 635–643 CrossRef; (b) L. Yao, S. Zhang, R. Wang, W. Li, F. Shen, B. Yang and Y. Ma, Angew. Chem., Int. Ed., 2014, 53, 2119–2123 CrossRef PubMed; (c) H. Lu, Y. Zheng, X. Zhao, L. Wang, S. Ma, X. Han, B. Xu, W. Tian and H. Gao, Angew. Chem., Int. Ed., 2016, 55, 155–159 CrossRef PubMed; (d) Y. Hong, J. W. Y. Lam and B. Z. Tang, Chem. Commun., 2009, 4332–4353 RSC; (e) J. Luo, Z. Xie, J. W. Y. Lam, L. Cheng, H. Chen, C. Qiu, H. S. Kwok, X. Zhan, Y. Liu, D. Zhu and B. Z. Tang, Chem. Commun., 2001, 1740–1741 RSC; (f) J. Mei, N. L. C. Leung, R. T. K. Kwok, J. W. Y. Lam and B. Z. Tang, Chem. Rev., 2015, 115, 11718–11940 CrossRef PubMed; (g) Y. Liu, Y. Zhang, X. Wu, Q. Lan, C. Chen, S. Liu, Z. Chi, L. Jiang, X. Chen and J. Xu, J. Mater. Chem. C, 2014, 2, 1068–1075 RSC; (h) L. Yan, Y. Zhang, B. Xu and W. Tian, Nanoscale, 2016, 8, 2471–2487 RSC.
- (a) H.-W. Liu, X.-B. Zhang, J. Zhang, Q.-Q. Wang, X.-X. Hu, P. Wang and W. Tan, Anal. Chem., 2015, 87, 8896–8903 CrossRef PubMed; (b) W. Zhu, X. Huang, Z. Guo, X. Wu, H. Yu and H. Tian, Chem. Commun., 2012, 48, 1784–1786 RSC; (c) M. Kaur and D. H. Choi, Chem. Soc. Rev., 2015, 44, 58–77 RSC; (d) L. Yuan, W. Lin, K. Zheng, L. He and W. Huang, Chem. Soc. Rev., 2013, 42, 622–661 RSC.
- (a) C.-T. Chen, Chem. Mater., 2004, 16, 4389–4400 CrossRef; (b) Z. Wang, L. Yan, L. Zhang, Y. Chen, H. Li, J. Zhang, Y. Zhang, X. Li, B. Xu, X. Fu, Z. Sun and W. Tian, Polym. Chem., 2014, 5, 7013–7020 RSC.
- K. Motokura, N. Fujita, K. Mori, T. Mizugaki, K. Ebitani and K. Kaneda, Tetrahedron Lett., 2005, 46, 5507–5510 CrossRef.
- S. E. Denmark, M. Y. S. Ibrahim and A. Ambrosi, ACS Catal., 2017, 7, 613–630 CrossRef.
- D. B. Ramachary, M. Kishor and K. Ramakumar, Tetrahedron Lett., 2006, 47, 651–656 CrossRef.
- C. Guyon, M. C. Duclos, M. Sutter, E. Metay and M. Lemaire, Org. Biomol. Chem., 2015, 13, 7067–7075 Search PubMed.
- X. Y. Shen, Y. J. Wang, E. Zhao, W. Z. Yuan, Y. Liu, P. Lu, A. Qin, Y. Ma, J. Z. Sun and B. Z. Tang, J. Phys. Chem. C, 2013, 117, 7334–7347 Search PubMed.
- (a) Y. J. Wang, Y. Shi, Z. Wang, Z. Zhu, X. Zhao, H. Nie, J. Qian, A. Qin, J. Z. Sun and B. Z. Tang, Chem.–Eur. J., 2016, 22, 9784–9791 CrossRef PubMed; (b) H. Yuan, L. Wang, S. Li, H. Liang, C. Lu, Y. Wang and C.-H. Zhao, J. Phys. Chem. B, 2016, 4, 5515–5518 Search PubMed; (c) Y. Zhang, J.-H. Wang, W. Zheng, T. Chen, Q.-X. Tong and D. Li, J. Mater. Chem. B, 2014, 2, 4159–4166 RSC.
- M. J. Frisch, G. W. Trucks, H. B. Schlegel, G. E. Scuseria, M. A. Robb and J. R. Cheeseman, et al., Gaussian 09, Revision A.02, Gaussian, Inc., Wallingford CT, 2009 Search PubMed.
- A. Operamolla, S. Colella, R. Musio, A. Loiudice, O. Hassan Omar, G. Melcarne, M. Mazzeo, G. Gigli, G. M. Farinola and F. Babudri, Sol. Energy Mater. Sol. Cells, 2011, 95, 3490–3503 CrossRef.
- (a) L. Zhu, R. Wang, L. Tan, X. Liang, C. Zhong and F. Wu, Chem.–Asian J., 2016, 11, 2932–2937 CrossRef PubMed; (b) W. Huang, H. Wang, L. Sun, B. Li, J. Su and H. Tian, J. Mater. Chem. C, 2014, 2, 6843–6849 RSC.
- (a) Q. Zhao and J. Z. Sun, J. Mater. Chem. C, 2016, 4, 10588–10609 RSC; (b) D. Yang, S. Zhang, Y. Hu, J. Chen, B. Bao, L. Yuwen, L. Weng, Y. Cheng and L. Wang, RSC Adv., 2016, 6, 114580–114586 RSC.
- (a) A. Punzi, E. Maiorano, F. Nicoletta, D. Blasi, A. Ardizzone, N. Ventosa, I. Ratera, J. Veciana and M. Farinola Gianluca, Eur. J. Org. Chem., 2016, 15, 2617–2627 CrossRef; (b) D. D. Prabhu, A. P. Sivadas and S. Das, J. Mater. Chem. C, 2014, 2, 7039–7046 RSC; (c) S. Varghese, N. S. S. Kumar, A. Krishna, D. S. S. Rao, S. K. Prasad and S. Das, Adv. Funct. Mater., 2009, 19, 2064–2073 CrossRef.
- A. Diac, D. Demeter, M. Allain, I. Grosu and J. Roncali, Chem.–Eur. J., 2015, 21, 1598–1608 CrossRef PubMed.
- N. Zhao, M. Li, Y. Yan, J. W. Y. Lam, Y. L. Zhang, Y. S. Zhao, K. S. Wong and B. Z. Tang, J. Mater. Chem. C, 2013, 1, 4640–4646 RSC.
- (a) J. Zhang, W. Chen, S. Kalytchuk, K. F. Li, R. Chen, C. Adachi, Z. Chen, A. L. Rogach, G. Zhu, P. K. Yu, W. Zhang, K. W. Cheah, X. Zhang and C. S. Lee, ACS Appl. Mater. Interfaces, 2016, 8, 11355–11365 CrossRef PubMed; (b) C. Mastrodonato, P. Pagano, J. Daniel, M. Vaultier and M. Blanchard-Desce, Molecules, 2016, 21, 1227–1251 CrossRef PubMed.
Footnote |
| † Electronic supplementary information (ESI) available. See DOI: 10.1039/c8ra00955d |
| This journal is © The Royal Society of Chemistry 2018 |

