 Open Access Article
Heterostructured Bi2S3@NH2-MIL-125(Ti) nanocomposite as a bifunctional photocatalyst for Cr(VI) reduction and rhodamine B degradation under visible light†
Minghua Wangab,
Longyu Yangb,
Jinyun Yuan b,
Linghao Heab,
Yingpan Songb,
Hongzhong Zhanga,
Zhihong Zhang
 *ab and
Shaoming Fang*ab
aHenan Collaborative Innovation Center of Environmental Pollution Control and Ecological Restoration, P. R. China
bHenan Provincial Key Laboratory of Surface & Interface Science, Zhengzhou University of Light Industry, Zhengzhou, 450001, P. R. China. E-mail: mainzhh@163.com; mingfang@zzuli.edu.cn
First published on 3rd April 2018
Abstract
A series of bismuth sulfide (Bi2S3) nanorods and amine-functionalized Ti-based metal–organic framework heterojunctions [denoted by Bi2S3@NH2-MIL-125(Ti)] were constructed and explored as bifunctional photocatalysts for Cr(VI) reduction and rhodamine B (RhB) degradation under visible light illumination. Compared with the individual NH2-MIL-125(Ti) and Bi2S3, the as-synthesized Bi2S3@NH2-MIL-125(Ti) photocatalyst exhibited an enhanced photocatalytic activity toward Cr(VI) and RhB owning to the synergetic effect between Bi2S3 and NH2-MIL-125(Ti). Moreover, the Bi2S3@NH2-MIL-125(Ti) heterojunctions showed increased Cr(VI) removal efficiency by adding RhB in the system. The photocatalytic mechanism was proposed based on the analysis of different scavenger for active species and electron spin resonance spectrometry. The introduction of Bi2S3 into NH2-MIL-125(Ti) can extend the light adsorption and improve the transfer and separation of photogenerated charge carriers through the Bi2S3@NH2-MIL-125(Ti) heterojunction with unique band gap structure. The synthesized Bi2S3@NH2-MIL-125(Ti) photocatalyst also exhibited good reusability and stability.
Introduction
A variety of aromatic organic pollutants, including dyes, phenol, naphthalene, and trichloroethylene, have been found at high concentrations in water containing inorganic pollutants such as Cr(VI), Pb(II), and Hg(II). Due to their acute toxicity and bioaccumulation, the removal of these contaminants from wastewater is particularly significant. For the past few years, photocatalytic technology has emerged as a highly effective, low-cost, and eco-friendly treatment for hazardous pollutants by utilizing solar energy.1 According to other studies, heavy metal ion reduction and organic pollutant degradation can simultaneously occur in the photocatalytic process.2 For instance, the synergistic effect between the removal of Cr(VI) and degradation of organic pollutants is revealed by multiple utilization of TiO2 nanorods/g-C3N4 for photocatalytic activity.3 Nevertheless, the highly efficient and simultaneous photocatalytic removal of the co-existing pollutants remains a challenged due to the limited utilization of sunlight, rapid recombination of photogenerated electron–hole pairs, and relatively low specific surface area.Recently, as a new class of porous materials with an extended 3D network, metal–organic frameworks (MOFs), which are composed of metal containing nodes and organic linkers, exhibit given chemical stability and structural tenability.4,5 As such, MOFs and their derivatives showed potential applications in gas storage and separation,6–8 catalysis,9,10 and biomedical applications.11–13 Additionally, owing to the high surface area, structural organization and adjustiability of MOFs, scientists have focused on their photocatalytic performances, such as in photocatalytic decontamination of organic pollutants, heavy metal, and photocatalytic water splitting.14–17 For instance, the PANI/FeUiO-66 nanohybrids exhibited high photocatalytic performances toward the oxidation of various alcohol substrates.18 As a photo-response and highly porous material, NH2-MIL-125(Ti) has shown great potential in hydrogen production,19 CO2 reduction,20 the removal of organic pollutants21 and Cr(VI).22 As reported, the NH2-MIL-125(Ti) framework only exhibited single catalytic performance toward the specific pollution. It demonstrated the combination of NH2-MIL-125(Ti) and other photocatalytic active inorganic compounds can improve its photocatalytic ability. For example, BiOBr/NH2-MIL-125(Ti) composite possesses an enhanced photocatalytic performance, by which 80% of RhB was degraded under visible light irradiation within 100 min. The RhB degradation rate for BiOBr/NH2-MIL-125(Ti) was 3.12-fold that of pure BiOBr and 5.64-fold that of pure NH2-MIL-125(Ti).23 However, it remained a huge challenge to explore the bifunctionally catalytic activity of NH2-MIL-125(Ti) toward multi-pollutions in the environmental system.
As an n-type semiconductor, bismuth sulfide (Bi2S3) has a bulk narrow direct band gap (∼1.3 eV) with an extended visible light absorption.24 Nanostructured Bi2S3 materials have been used as functional broad-spectral photosensitizer.25 Gao et al. reported that the prepared mesoporous hetero-structured BiVO4/Bi2S3 hollow discoid exhibited improved photoelectrochemical current response and efficient Cr(VI) removal under visible-light illumination.26 The Bi2S3/Bi2O2CO3 n–n-type heterojunction displayed good photocatalytic activity for degrading RhB under sunlight irradiation.27 Compared with pure MOFs, catalysts based on the heterostructure combination of MOFs with metal oxide/sulfides/metals showed great advantages due to their synergetic effect.28–30 However, few studies were conducted on the preparation of the Bi2S3 and MOF heterojunction photocatalysts for the removal of pollutants. To the best of our knowledge, no report has been published on the simultaneous removal of Cr(VI) and RhB by using NH2-MIL-125(Ti)-based photocatalyst.
Based on above analysis, we designed and prepared a series of heterostructured Bi2S3@NH2-MIL-125(Ti) nanocomposites via solvothermal method, which exhibit the highly enhanced photocatalytic activity for the simultaneous removal of Cr(VI) and RhB. As compared to the routine photocatalysts, the as-synthesized Bi2S3@NH2-MIL-125(Ti) possesses substantial three advantages, including (i) improved visible light harvesting owing to Bi2S3 and –NH2 containing in the ligands of MOF; (ii) effective photoinduced charge carriers transfer and separation in Bi2S3@NH2-MIL-125(Ti) heterojunction with matched band gap structure; and (iii) synergetic effect between Bi2S3 and NH2-MIL-125(Ti) for construction of bifunctional photocatalyst toward Cr(VI) and organic pollutants. It demonstrated that the as-prepared Bi2S3@NH2-MIL-125(Ti) photocatalyst exhibited an enhanced visible light photocatalytic activity for Cr(VI) reduction and RhB degradation as compared to pure NH2-MIL-125(Ti) and pure Bi2S3.
Experiment section
Materials and reagents
Tetra-n-butyl titanate (Ti(OC4H9)4) and 2-aminoterephthalic acid (H2BDC-NH2, C8H7NO4) were purchased from Aladdin Chemistry Co., Ltd. (Shanghai, China). N, N-Dimethylformamide (DMF), CH3OH, ethylene glycol (EG), K2Cr2O7, and PVP (MW 40000) were obtained from Kemi European Chemical Reagent Co., Ltd. (Tianjin, China). All reagents were of analytical grade, whereas all solutions were prepared with Milli-Q ultrapure water (≥18.2 MΩ cm).Preparation of Bi2S3@NH2-MIL-125(Ti) nanocomposites
Bi2S3 nanorods was synthesized by according to the previous report31 and NH2-MIL-125(Ti) was prepared using H2BDC-NH2 as organic linker via solvothermal method,10,32 as described in detail in the ESI (see S1†).To prepare Bi2S3@NH2-MIL-125(Ti) nanocomposites, a certain amount of Bi2S3 (10, 50, and 100 mg) were added into beakers. Then, DMF (18 mL), methanol (2 mL), and PVP (0.5 g) were added into the beakers with stirring for 30 min under room temperature. Subsequently, 1.1 g 2-aminoterephthalic acid and 1.2 mL of tetrabutyl titanate were added into the beakers with stirring for 5 min. The resultant solution was poured into a Teflon-lined stainless-steel autoclave at 150 °C for 48 h. After reaction, the solid was centrifuged and washed repeatedly with DMF and methanol for several times and dried at 60 °C. The resultant Bi2S3@NH2-MIL-125(Ti) nanocomposites with the amount of 10, 50, and 100 mg of Bi2S3 were denoted as Bi2S3@NM-10, Bi2S3@NM-50, and Bi2S3@NM-100, respectively.
Characterizations
X-ray diffraction (XRD) measurements were performed on a Rigaku D/Max-2500 X-ray diffractometer using Cu Kα radiation. The chemical structure and component of all sample were analyzed by Fourier transform infrared spectroscopy (FT-IR) (Bruker TENSOR27, Germany) and X-ray photoelectron spectroscopy (XPS) (Thermo Fisher ESCALAB 250Xi photoelectron spectrometer), respectively. Field emission scanning electron microscopy (FE-SEM) was conducted using a JSM-6490LV scanning electron microscope. Transmission electron microscopy (TEM) measurements were performed using a JEOL JSM-6490L V system. The UV-Visible photocatalytic apparatus used in this work is Japan model Hitachi U-3900H UV-Visible Spectrometer. The N2 adsorption–desorption isotherms were conducted using a Micromeritics 3Flex surface area and pore size analyzer with a liquid nitrogen at the temperature of 77 K. The specific surface area was calculated by the Brunauer–Emmett–Teller (BET) method. Photoluminescence (PL) spectra were recorded on a Hitachi F-7000 fluorescence spectrophotometer.Photocatalytic activity
K2Cr2O7 and RhB were dissolved into deionized water to prepare Cr(VI) and RhB solution. The solution concentrations of Cr(VI) and RhB were 10 and 20 mg L−1, respectively. A 300 W Xe lamp (PLS/SXE 300C, Beijing Perfectlight Co., Ltd.) equipped with a UV cutoff filter (λ > 420 nm) was used as the visible light source. The photocatalysts were added into the Cr(VI) and RhB solutions with continuous stirring for 30 min in the dark to achieve an adsorption–desorption equilibrium before irradiation. Afterward, the solution was irradiated under visible light with magnetic stirring. For photocatalytic analysis, 3 mL of suspensions at each given time interval were filtered with 0.45 μm filtration membrane. The concentrations of Cr(VI) were determined using colorimetry with the diphenylcarbazide as a color agent at 544 nm,22 whereas those of RhB were determined by measuring the absorbance at 554 nm with UV-Vis spectrophotometer. For the recycle experiments of Cr(VI) reduction and RhB degradation, the used catalyst was collected by filtration, washed with deionized water and ethanol, and dried in a vacuum oven at 60 °C for the next run.Different scavengers, including ethylene diamine tetraacetic acid (EDTA), isopropyl alcohol (IPA), benzoquinone (BQ), and K2S2O8 were used to trap hole (h+), hydroxyl radical (˙OH), superoxide anion radical (O2˙−), and electron (e−), respectively. The radical species were detected by electron spin resonance (ESR) spectrometry on a JES-FA spectrometer under visible light (λ > 420 nm). The 5,5-dimethyl-1-pyrroline N-oxide (DMPO) was selected as the spin-trapping agent in ESR spectrometry.
Electrochemical and photoelectrochemical analysis
The Mott–Schottky plots and photocurrent measurements were carried out on a CHI660D electrochemical analyzer in a traditional three electrode system, including a platinum as counter electrode, an indium-doped thin oxide (ITO) glass (1.5 × 3.0 cm) electrode as working electrode and an Ag/AgCl as reference electrode. The catalyst was dispersed and ultrasonicated in ethanol to form a homogeneous solution (8 mg mL−1). Then, 40 μL of the solution was dropped onto the ITO glass and dried in a vacuum oven at 60 °C. The Mott–Schottky plots were obtained in 0.5 M Na2SO4 solution in dark. Amperometric i–t curves were obtained at an applied potential of 0.3 V vs. Ag/AgCl in 0.5 M Na2SO4 under visible light irradiation (λ > 420 nm).Results and discussion
Chemical and crystal structure of as-prepared samples
The XRD patterns and FT-IR spectra of the as-prepared samples are displayed in Fig. 1a and b, respectively. The XRD pattern of NH2-MIL-125(Ti) in Fig. 1a showed well-defined diffraction peaks (2θ) of 6.8°, 9.7°, 11.6°, 15.2°, and 19.5°, which agreed with those of the simulated XRD pattern.32 The XRD pattern of Bi2S3 displayed typical 2θ at 15.8°, 17.6°, 22.4°, 23.7°, 24.9°, 25.2°, 27.4°, 28.7°, 31.7°, 32.9°, 34.0°, 35.7°, 39.9°, 45.6°, 46.5°, 48.3°, and 52.6°, which are indexed as the diffractions of (020), (120), (220), (101), (130), (310), (021), (211), (221), (301), (311), (240), (141), (002), (431), (060), and (351) crystalline planes of Bi2S3 orthorhombic phase (JCPDS card no. 17-0320).33 The XRD patterns of the Bi2S3@NM samples exhibited the features of both Bi2S3 and NH2-MIL-125(Ti), in which the feature of the former became increasingly evident with its increasing amount in the nanocomposites. For Bi2S3@NM-100, 2θ were found at 24.9°, 27.4°, 28.7°, and 31.7°, which corresponded to the (130), (021), (211), and (221) crystal planes of Bi2S3, respectively. The XRD diffraction peaks confirmed the successful synthesis of Bi2S3@NH2-MIL-125(Ti) nanocomposites.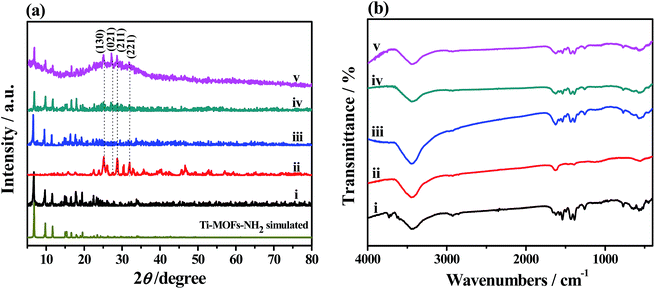 | ||
| Fig. 1 (a) XRD patterns and (b) FT-IR spectra of (i) NH2-MIL-125(Ti), (ii) Bi2S3, (iii) Bi2S3@NM-10, (iv) Bi2S3@NM-50, and (v) Bi2S3@NM-100 nanocomposites. | ||
The strong and wide absorption band at approximately 3443 cm−1 in Fig. 1b was attributed to the primary amines (–NH2) of the organic linker and the stretching vibration of the O–H groups of the adsorbed water. For Bi2S3 nanorods, the absorption peaks at 1630 cm−1 was ascribed to the C![[double bond, length as m-dash]](https://www.rsc.org/images/entities/char_e001.gif) O stretching vibration of carbamide. For NH2-MIL-125(Ti) and Bi2S3@NM nanocomposites, the absorption bands at around 1559 and 1478 cm−1 were assigned to the ν (C
O stretching vibration of carbamide. For NH2-MIL-125(Ti) and Bi2S3@NM nanocomposites, the absorption bands at around 1559 and 1478 cm−1 were assigned to the ν (C![[double bond, length as m-dash]](https://www.rsc.org/images/entities/char_e001.gif) C) skeletal vibration of benzene ring contained in NH2-MIL-125(Ti), whereas those at 1293 and 796 cm−1 were attributed to the C–H in-plane and out-of-plane bending vibrations, respectively. These results further confirmed the existence of NH2-MIL-125(Ti) in the nanocomposite.
C) skeletal vibration of benzene ring contained in NH2-MIL-125(Ti), whereas those at 1293 and 796 cm−1 were attributed to the C–H in-plane and out-of-plane bending vibrations, respectively. These results further confirmed the existence of NH2-MIL-125(Ti) in the nanocomposite.
To identify the chemical composition and the chemical states of various as-prepared nanocomposites, XPS survey spectra were collected within the binding energy of 1 eV to 1200 eV (Fig. S1†). For NH2-MIL-125(Ti), the Ti 2p signal was ascribed to the metal coordination center, whereas the C 1s, N 1s, and O 1s signals were caused by the organic ligands that link coordination centers. In addition to the signals of Bi 4p, Bi 4d, Bi 4f, S 2p, and S 2s, the C 1s signal was also observed in the XPS survey scan of Bi2S3, indicating the existence of the C element of the EG residue during fabrication. In the XPS survey spectra of Bi2S3@NM samples, the occurrence of C 1s, N 1s, O 1s, Ti 2p, Bi 4f, and S 2p suggested the presence of composites of Bi2S3 and NH2-MIL-125(Ti). The atomic percentages of Bi 4f and S 2p increased from 0.04 to 0.19% and 0.18 to 1.98%, respectively, with the increasing Bi2S3 amounts contained in the nanocomposites (Table S1†).
The high-resolution XPS spectra of these samples are shown in Fig. 2 and S2–S4.† For NH2-MIL-125(Ti) (Fig. S2a†), the binding energies of Ti 2p3/2 and Ti 2p1/2 located at 458.7 and 464.5 eV, respectively, indicating titanium bounded to oxygen remains in oxidation state IV for the titanium-oxo cluster.22 The C 1s spectrum of NH2-MIL-125(Ti) (Fig. S2b†) showed four peaks at 284.6, 285.7, 287.4, and 288.7 eV, which were associated with the functional groups of C![[double bond, length as m-dash]](https://www.rsc.org/images/entities/char_e001.gif) C/C–H, C–N, C
C/C–H, C–N, C![[double bond, length as m-dash]](https://www.rsc.org/images/entities/char_e001.gif) O/N–C
O/N–C![[double bond, length as m-dash]](https://www.rsc.org/images/entities/char_e001.gif) O, and COO–, respectively. These functional groups were included in the ligands of NH2-MIL-125(Ti) and the residual DMF in the framework. The N 1s spectrum can be fitted into three peaks at 399.3, 400.4, and 402.9 eV (Fig. S2c†), which were contributed to C–N/N–H, N–C
O, and COO–, respectively. These functional groups were included in the ligands of NH2-MIL-125(Ti) and the residual DMF in the framework. The N 1s spectrum can be fitted into three peaks at 399.3, 400.4, and 402.9 eV (Fig. S2c†), which were contributed to C–N/N–H, N–C![[double bond, length as m-dash]](https://www.rsc.org/images/entities/char_e001.gif) O, and –N+–, respectively.34 For the deconvoluted XPS spectrum of the O 1s (Fig. S2d†), two peaks were observed at 529.8 and 531.6 eV, which were derived from Ti–O and –OH groups,21 respectively. As for Bi2S3 nanorods, the Bi 4f5/2 and Bi 4f7/2 at 157.5 and 162.8 eV with spin–orbit splitting of 5.3 eV were obtained in the high resolution spectrum of Bi 4f and corresponded to Bi3+ of the Bi2S3 nanoparticles (Fig. S3a†). The peaks at 160.2 and 161.4 eV can be ascribed to S 2p3/2 and S 2p1/2, respectively. The peak centered at around 224.6 eV can be attributed to S 2s of Bi2S3 (ref. 35) (Fig. S3b†). The signals of Ti 2p, Bi 4f, C 1s, N 1s, and O 1s of the series of Bi2S3@NM samples (Fig. 2 and S4†) were found to be consistent with those of the individual NH2-MIL-125(Ti) and Bi2S3, suggesting the coexistence of the two components in the nanocomposites.
O, and –N+–, respectively.34 For the deconvoluted XPS spectrum of the O 1s (Fig. S2d†), two peaks were observed at 529.8 and 531.6 eV, which were derived from Ti–O and –OH groups,21 respectively. As for Bi2S3 nanorods, the Bi 4f5/2 and Bi 4f7/2 at 157.5 and 162.8 eV with spin–orbit splitting of 5.3 eV were obtained in the high resolution spectrum of Bi 4f and corresponded to Bi3+ of the Bi2S3 nanoparticles (Fig. S3a†). The peaks at 160.2 and 161.4 eV can be ascribed to S 2p3/2 and S 2p1/2, respectively. The peak centered at around 224.6 eV can be attributed to S 2s of Bi2S3 (ref. 35) (Fig. S3b†). The signals of Ti 2p, Bi 4f, C 1s, N 1s, and O 1s of the series of Bi2S3@NM samples (Fig. 2 and S4†) were found to be consistent with those of the individual NH2-MIL-125(Ti) and Bi2S3, suggesting the coexistence of the two components in the nanocomposites.
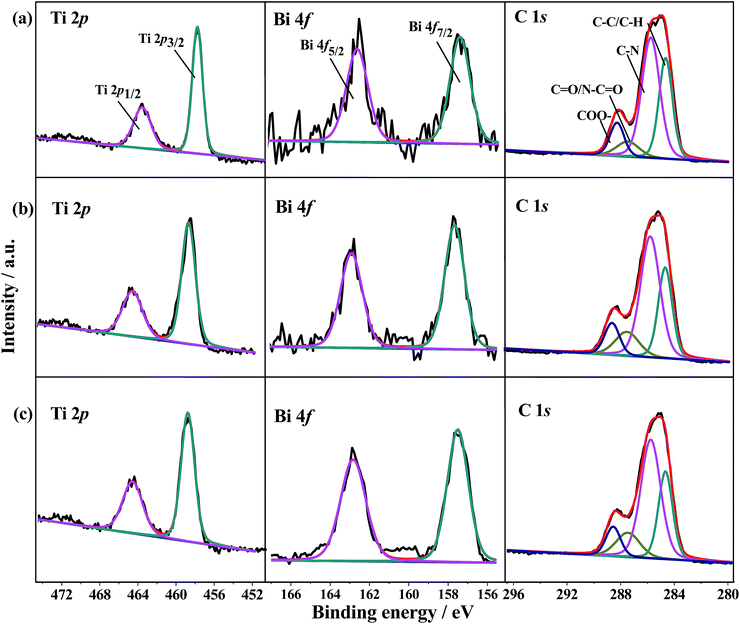 | ||
| Fig. 2 Ti 2p, Bi 4f, and C 1s high resolution XPS spectra of (a) Bi2S3@NM-10, (b) Bi2S3@NM-50, and (c) Bi2S3@NM-100 nanocomposites. | ||
Surface morphologies of as-prepared samples
Fig. S5 and S6† display the FE-SEM and TEM images of NH2-MIL-125(Ti) and Bi2S3, respectively. The NH2-MIL-125(Ti) elucidated truncated bipyramids and octahedron structures with smooth surfaces. Bi2S3 exhibited the well-dispersed nanorods shape with a diameter of 20 to 40 nm and a length of 50 to 200 nm. The TEM and high-resolution TEM (HR-TEM) images of Bi2S3 illustrated the well-resolved lattice fringes with d-spacing of 0.504 nm, corresponding to orthorhombic (120) lattice plane of Bi2S3. The selected area electron diffraction (SAED) pattern (inset in Fig. S6d†) indicated the well-defined crystalline of Bi2S3. Fig. 3 shows the FE-SEM, TEM, and HR-TEM images of Bi2S3@NM nanocomposites. These images suggested that the size and distribution of the Bi2S3@NM nanocomposites become small and uniform with the increasing amounts of Bi2S3. The lattice spacing at 0.329, 0.188, and 0.360 nm were observed in the HR-TEM images of Bi2S3@NM nanocomposites, which are assigned to the (021), (060), and (130) planes of Bi2S3, respectively. All these results signified that the heterojunction of NH2-MIL-125(Ti) and Bi2S3 was formed in the nanocomposites.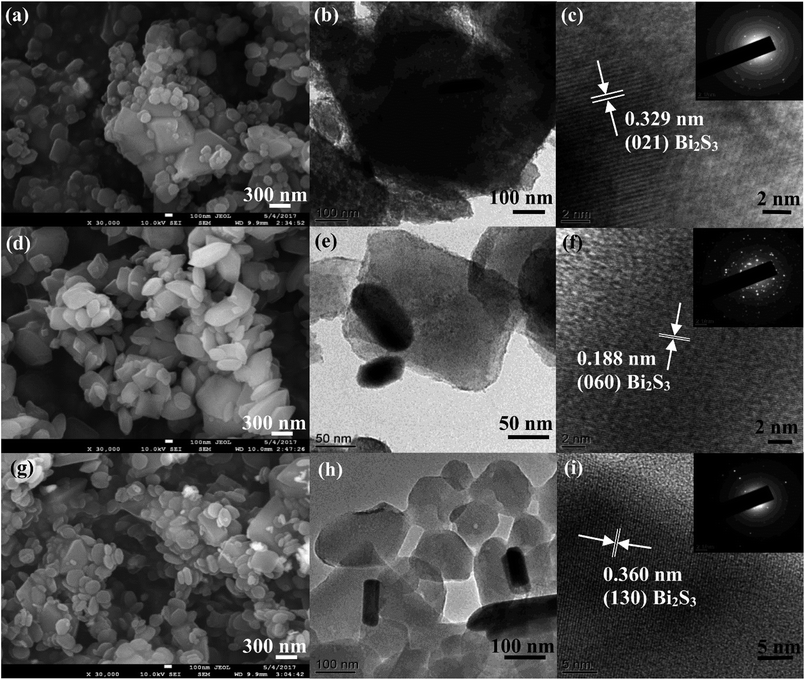 | ||
| Fig. 3 FE-SEM, TEM and HR-TEM images of (a–c) Bi2S3@NM-10, (d–f) Bi2S3@NM-50, and (g–i) Bi2S3@NM-100 nanocomposites, respectively. The insets in (c), (f), and (i) are the corresponding SAED patterns. | ||
N2 adsorption–desorption measurements shown in Fig. S7† indicated that the NH2-MIL-125(Ti) still maintained the porous structure after recombining with Bi2S3. The specific surface areas were calculated as 485.7, 560.9, and 416.7 m2 g−1 for Bi2S3@NM-10, Bi2S3@NM-50, and Bi2S3@NM-100 nanocomposites, respectively. The relatively high specific surface area of Bi2S3@NM nanocomposites was favorable to the adsorption of pollutants.
Optical and electrochemical properties
The optical absorption properties of NH2-MIL-125(Ti), Bi2S3 and Bi2S3@NM nanocomposites were determined by UV-Vis DRS (Fig. 4a). The absorption edge of NH2-MIL-125(Ti) was at ∼500 nm, whereas the absorption onset of Bi2S3 was extended at ∼1000 nm. The Bi2S3@NM nanocomposites exhibited better absorption than the pure NH2-MIL-125(Ti) under the UV-Vis region, especially under visible light. Accordingly, the plot of (αhν)2 versus photo energy (hν) can be fitted into a linear pattern36 (Fig. 4b). The band gaps of Bi2S3, NH2-MIL-125(Ti), and Bi2S3@NM-10, Bi2S3@NM-50, and Bi2S3@NM-100 were calculated as 1.32, 2.68, 2.66, 2.64, and 2.59 eV, respectively. These results suggested that the introduction of Bi2S3 in favor of visible light absorption and thus facilitated the full utilization of solar energy.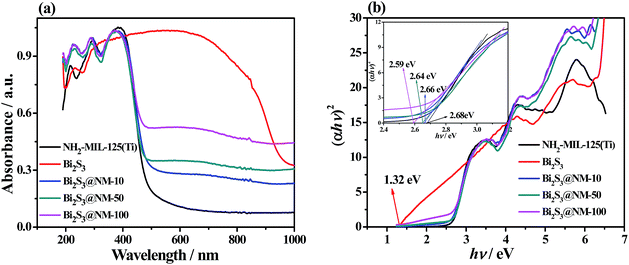 | ||
| Fig. 4 (a) UV-Vis DRS and (b) the plots of (αhν)2 versus energy (hν) of the NH2-MIL-125(Ti), Bi2S3, Bi2S3@NM-10, Bi2S3@NM-50, and Bi2S3@NM-100 (the inset: zoomed-in plots of the samples). | ||
PL spectra and photocurrent measurements were used to probe the recombination of photogenerated electrons and holes and charge carrier mobility of the photocatalysts. The PL intensities of all samples were normalized for comparison.37 Fig. 5a shows that the NH2-MIL-125(Ti) exhibited the highest PL intensity and thus possessed the highest recombination rate of photo-induced electrons and holes. On the contrary, Bi2S3 exhibited the lowest PL intensity and thus possessed the lowest recombination efficiency of photogenerated charge carrier. The PL intensities of Bi2S3@NM nanocomposites were weaker than that of the pristine NH2-MIL-125(Ti), which confirmed that the addition of Bi2S3 can effectively improve the seperation of photogenerated carriers. Photocurrent responses in Fig. 5b were measured under visible light in 0.5 M Na2SO4 aqueous solution. Among the photocatalysts, the photocurrent density of NH2-MIL-125(Ti) was the lowest, whereas that of Bi2S3 was the highest. The photocurrent responses of the Bi2S3@NM increased with the increasing dosages of Bi2S3 in the nanocomposites. These results demonstrate that the separation and transfer of photogenerated carriers were improved via the introduction of Bi2S3.
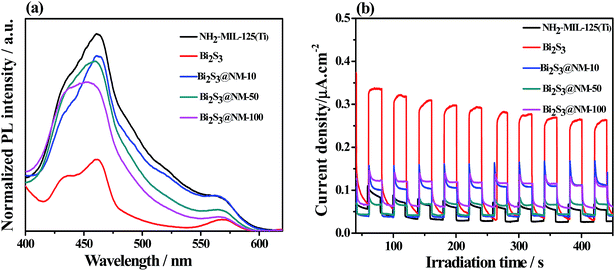 | ||
| Fig. 5 (a) Photoluminescence spectra (λEx = 350 nm) and (b) photocurrent responses of the NH2-MIL-125(Ti), Bi2S3, Bi2S3@NM-10, Bi2S3@NM-50, and Bi2S3@NM-100 nanocomposites. | ||
Photocatalytic Cr(VI) reduction
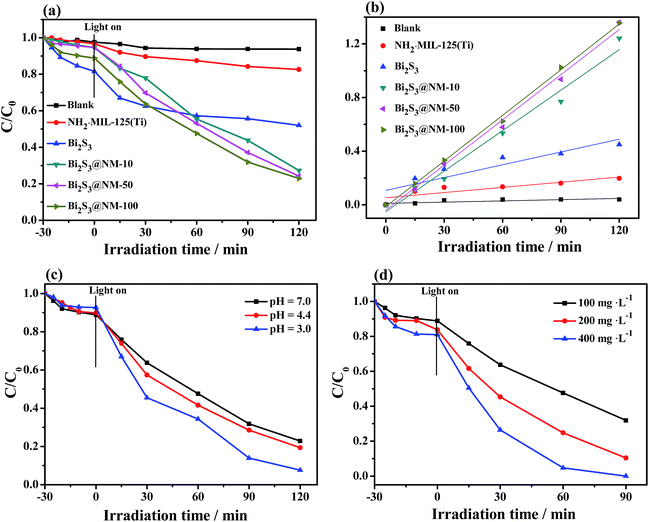
Photocatalytic activities of different catalysts were evaluated through the reduction of Cr(VI). Fig. S8a–f† and 6a show UV-Vis absorption spectra and Cr(VI) reduction using NH2-MIL-125(Ti), Bi2S3, and various Bi2S3@NM nanocomposites at pH of 7.0. Approximately 18% of Cr(VI) was reduced by the pure NH2-MIL-125(Ti) and 48% by the pure Bi2S3 after illuminating for 120 min. The Bi2S3@NM samples exhibited higher photocatalytic activity than individual NH2-MIL-125(Ti) and Bi2S3. Among the as-prepared nanocomposites, Bi2S3@NM-100 displayed the highest activity with 77% Cr(VI) removal under visible light for 120 min. As shown in Fig. 6b, the photocatalytic reactions followed the pseudo-first order reaction kinetic equation. The reaction rate was calculated by the apparent reaction rate constant (k) from the degradation curves of −ln(C/C0) versus the irradiation time. Fig. S8g† confirms the k values of different samples, suggesting that the reaction rates of various samples were in the following order: NH2-MIL-125(Ti) < Bi2S3 < Bi2S3@NM-10 < Bi2S3@NM-50 < Bi2S3@NM-100. The k value of Bi2S3@NM-100 (0.01134 min−1) is 8.86-fold that of the NH2-MIL-125(Ti) (0.00128 min−1), and 3.57-fold that of the Bi2S3 (0.00318 min−1), indicating that the photocatalytic Cr(VI) reduction was promoted by combining the two components. Therefore, the Bi2S3@NM-100 nanocomposite was employed to further investigate the photocatalytic activity in the following work.The influence of the pH value on the photocatalytic reduction of Cr(VI) was considered. As shown in Fig. 6c, the Cr(VI) reduction efficiency was the highest with pH of 3.0, revealing that an acid medium was beneficial to Cr(VI) reduction because Cr2O72− or HCrO4− are the major species of Cr(VI) with low pH value. In this case, the Cr(VI) reduction occurred following the eqn (1).38
| Cr2O72− + 14H+ + 6e− → 2Cr3+ + 7H2O | (1) |
Additionally, the effect of catalyst dosage on the photocatalytic Cr(VI) reduction was assessed at pH 3.0 (Fig. 6d). When the catalyst dosage was increased to 400 mg L−1, Bi2S3@NM-100 removed 100% of the Cr(VI) under visible light in 90 min.
Photocatalytic RhB degradation
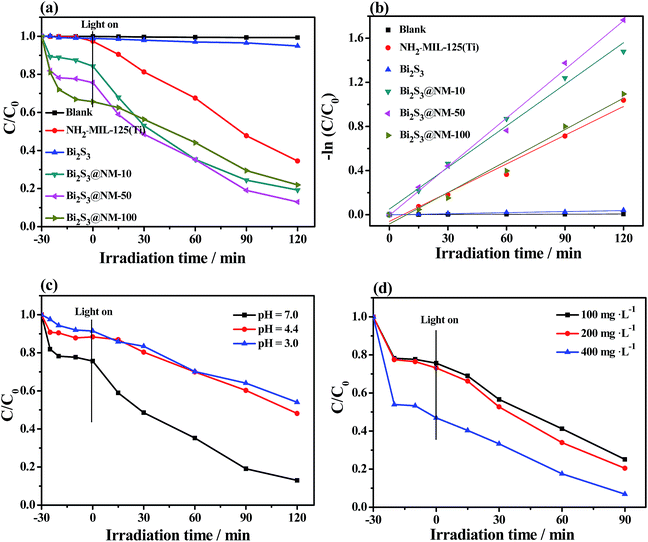
Photocatalytic activities of various samples were further tested through the photocatalytic degradation of RhB (Fig. 7 and S9a–f†). The pure Bi2S3 nanorods showed almost no photocatalytic activity for the RhB degradation, whereas NH2-MIL-125(Ti) exhibited good photocatalytic performance. The enhanced photocatalytic degradation efficiency of RhB was observed over Bi2S3@NM nanocomposites (Fig. 7a). The photocatalytic degradation of RhB also followed a pseudo-first order relationship (−ln(C/C0) = kt) (Fig. 7b). The photodegradation activity and k value (Fig. S9g†) toward RhB followed the order: Bi2S3 < NH2-MIL-125(Ti) < Bi2S3@NM-100 < Bi2S3@NM-10 < Bi2S3@NM-50. The results illustrated that Bi2S3@NM-50 exhibited the highest photocatalytic activity toward RhB degradation. The catalytic efficiency for RhB degradation is improved when the Bi2S3 amount increased from 10 to 50 mg. However, when the Bi2S3 amount was further increased to 100 mg, the photodegradation efficiency for RhB slightly decreased, but is still higher than that of Bi2S3 and NH2-MIL-125(Ti). The k value of Bi2S3@NM-100 (0.00951 min−1) is 1.09-fold that of the NH2-MIL-125(Ti) (0.00868 min−1), and 29.2-fold that of the Bi2S3 (0.0003256 min−1). This response was slightly different from the reduction of Cr(VI), in which Bi2S3@NM-100 was the best photocatalyst. Additionally, the UV-Vis absorbance (Fig. S9†) decreased gradually with the irradiation time and the maximum shift from 554 nm to the low wavelength of ∼530 nm, indicating the stepwise degradation of RhB and the reaction of de-ethylated in the process.39The effect of pH and catalyst dosage on the photocatalytic degradation of RhB was investigated using the Bi2S3@NM-50 sample. Fig. 7c and d show that the optimum experimental conditions for photocatalytic degradation of RhB were pH 7.0 and catalyst dosage of 400 mg L−1. In this case, about 90% RhB can be degraded in 90 min. These results revealed that Bi2S3@NM-50 nanocomposites were promising materials for the simultaneous decontamination of Cr(VI) and RhB.
Photoactivity of the simultaneous decontamination of Cr(VI) and RhB
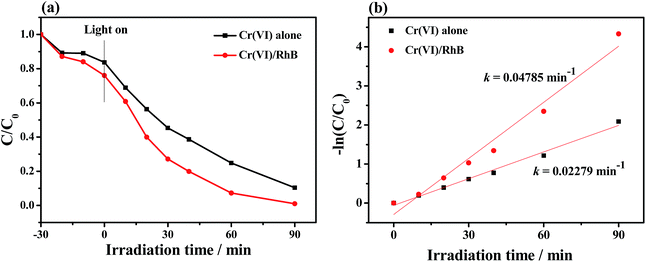
The simultaneous photocatalytic Cr(VI) reduction and RhB degradation over Bi2S3@NM-100 were performed in the Cr(VI) (10 mg L−1)/RhB (5 mg L−1) system with pH 3.0 (Fig. 8 and S10†). After introduction of RhB in the system, high photocatalytic activity toward Cr(VI) reduction and completely removal of Cr(VI) was achieved in 90 min. The first-order reaction rate constant k value with coexistence of RhB (0.04785 min−1) was higher than that without RhB (0.02279 min−1). The removal rate of RhB increased with coexistence of Cr(VI). These results suggested a synergistic effect between photocatalytic Cr(VI) reduction and RhB degradation.Stability of photocatalyst samples
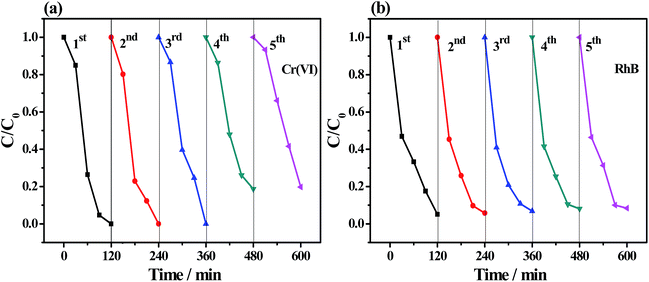
The stability of the as-prepared photocatalyst was investigated by repeating the photocatalytic reduction Cr(VI) and degradation of RhB for five cycles. As illustrated in Fig. 9, the removal efficiency of Cr(VI) was still 100% after three cycles and around 81% after five cycles. The photocatalytic efficiency of RhB degradation was still 92% in the fifth cycle. FT-IR, XRD, and XPS spectra were obtained to evaluate the chemical stability and durability of the as-synthesized photocatalyst after the fifth cycle. No substantial change was observed in FT-IR spectra (Fig. S11a†) of the recycled samples as compared with those of the fresh Bi2S3@NM-100. As shown in Fig. S11b,† the XRD patterns of the recycled samples presented the main diffraction peaks of NH2-MIL-125(Ti) (2θ = 6.8°) and Bi2S3 (2θ = 24.9°, 27.4°, and 28.7°), further confirming the good durability of the as-prepared photocatalyst. The XPS survey spectra of the Bi2S3@NM-100 before and after the cycling test mainly showed the peaks of C 1s, N 1s, O 1s, Ti 2p, Bi 4f, and S 2p species (Fig. S11c†). In addition, a weak additional peak was found at 577.1 eV, which indicated the existence of Cr 2p. As illustrated in Fig. S11d,† the Cr 2p XPS spectrum can be curve-fitted with four components; among which, the peaks located at 577.1 and 579.9 eV were assigned to Cr 2p3/2 orbitals, whereas those at 586.4 and 589.2 eV were designated to Cr 2p1/2 orbitals. The peaks at 577.1 and 586.4 eV were assigned to Cr(III), indicating the photoreduction of Cr(VI) under visible light. The peaks at 579.9 and 589.2 eV are regarded as the residual Cr(VI) adsorbed on the photocatalyst surface.40 Compared with that of the fresh sample, the surface morphologies of Bi2S3@NM-100 after five cycling runs (Fig. S12†) showed only slight roughness. All these results indicated good durability and stability of these photocatalysts.Mechanism of the photocatalytic Cr(VI) reduction and RhB degradation
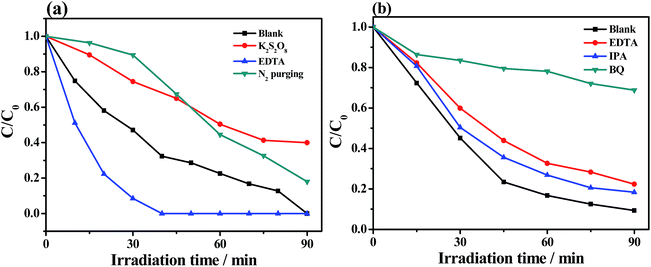
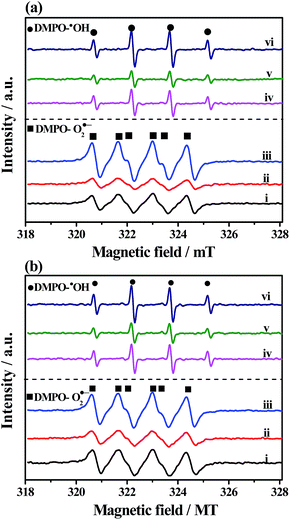
Trapping experiments of active species were conducted for the Bi2S3@NM-100 nanocomposite to investigate the possible reaction mechanism. For photocatalytic Cr(VI) reduction (Fig. 10a), the removal efficiency decreased with the addition of K2S2O8, a scavenger of photo-induced electrons. Photogenerated electrons play an important role in the photoreduction of Cr(VI). The photoreduction efficiency of Cr(VI) was enhanced by the addition of EDTA, which served as the hole scavenger and promoted the separation of photo-induced electron–hole pairs. Fig. 10a also shows that the N2 purging inhibited the Cr(VI) reduction. The dissolved O2 can react with the photoexcited electrons to produce O2˙−, which can further reduce Cr(VI). Therefore, N2 purging in the solution suppressed the reaction rate, whereas O2˙− was a crucial active radical in the photocatalytic Cr(VI) reduction. For the photocatalytic degradation of RhB, the active species of h+, ˙OH, and O2˙− were tested by introducing EDTA, IPA, and BQ, respectively. As depicted in Fig. 10b, the degradation efficiency of RhB decreased with the addition of EDTA, IPA, and BQ, suggesting that the h+, ˙OH, and O2˙− influenced the photodegradation of RhB. Among these chemicals, BQ had the most critical effect, indicating O2˙− as the predominant active species for the photocatalytic degradation of RhB.ESR analyses were conducted to further investigate the existence of O2˙− and ˙OH, and the results are displayed in Fig. 11. After exposure under visible light for 10 min, six characteristic peaks of the DMPO-O2˙− adducts and four characteristic peaks of the DMPO-˙OH adducts41 over NH2-MIL-125(Ti), Bi2S3, and Bi2S3@NM-100 were observed in Cr(VI) (Fig. 11a) and RhB solutions (Fig. 11b). These findings showed that O2˙− and ˙OH active species were produced during photocatalysis, and the radical intensity catalyzed by Bi2S3@NM-100 was higher than those by both pristine NH2-MIL-125(Ti) and Bi2S3. Furthermore, Bi2S3@NM-100 can highly generate active radicals. These results revealed that the combination of Bi2S3 and NH2-MIL-125(Ti) had synergetic effect for RhB degradation. In addition, the ESR signals of DMPO-O2˙− and DMPO-˙OH over Bi2S3@NM-100 with Cr(VI)/RhB coexistence were detected (Fig. 12). The results revealed that the Cr(VI)/RhB coexistence system exhibited the highest radical intensity, verifying the synergetic effects of the photocatalytic removal of Cr(VI) and RhB under visible light.
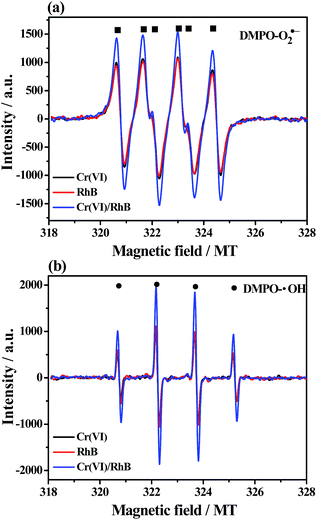 | ||
| Fig. 12 ESR spectra of (a) DMPO-O2˙− and (b) DMPO-˙OH formed over Bi2S3@NM-100 in Cr(VI), RhB, and Cr(VI)/RhB coexistence systems under visible light (λ > 420 nm) for 10 min. | ||
The Mott–Schottky plots were used to study the band structure of NH2-MIL-125(Ti) and Bi2S3 (Fig. S13†). The positive slope of NH2-MIL-125(Ti) showed that the sample was an n-type semiconductor, giving a flat-band potential of −0.70 V versus Ag/AgCl (−0.49 V vs. normal hydrogen electrode, NHE).42 Given that the conduction band edge is often considered more negative by approximately 0.1 V than its flat-band potential for n-type semiconductors,43 the conduction band (LUMO) of NH2-MIL-125(Ti) can be deduced at approximately −0.59 V (vs. NHE). Therefore, the valence band (HOMO) of the sample can be estimated as 2.09 V (vs. NHE) using the formula: EVB = ECB + Eg. Herein, Eg is 2.68 eV for NH2-MIL-125(Ti) from the UV-Vis DRS result. Bi2S3 also behaved as an n-type semiconductor (Fig. S13b†) with a narrow band gap (Eg = 1.32 eV), and the conduction band (CB) and valence band (VB) positions can be calculate as 0.30 and 1.62 V (vs. NHE), respectively. The deduced conduction band and valence band positions for NH2-MIL-125(Ti) and Bi2S3 were close to those in the previous reports.27,44 The values of the calculated conduction band, valence band, and Eg for various samples are listed in Table S2.† The high conduction band and valence band positions of Bi2S3@NM nanocomposites were observed upon increasing the Bi2S3 amounts.
Based on the above investigations, a possible mechanism of simultaneous Cr(VI) reduction and RhB degradation over the as-prepared photocatalyst was proposed (Fig. 13). NH2-MIL-125(Ti) and Bi2S3 semiconductors form an n–n-type heterojunction, and both of them can be excited under visible light. According to their band gap structures, photoexcited electrons can transfer from NH2-MIL-125(Ti) to Bi2S3. The photo-induced electrons were accumulated to reduce Cr(VI) to Cr(III), whereas the photo-induced holes were accumulated for RhB degradation. These findings revealed that the coexistence of Cr(VI) and RhB was favorable in avoiding recombination and promoting the migration of photogenerated charge carriers. In addition, the conduction band (LUMO) of NH2-MIL-125(Ti) (−0.59 V vs. NHE) is more negative than the potential of O2/O2˙− (−0.046 V vs. NHE)45 thus, the photo-induced electrons can react with dissolved O2 to yield O2˙−.46 After interacting with H2O molecules, the O2˙− could produce ˙OH.47 In addition, the photo-induced holes (h+) could directly oxide the RhB molecules. These active species (O2˙−, ˙OH, and h+) can induce RhB oxidation. Thus, the n–n-type Bi2S3@NH2-MIL-125(Ti) heterojunction was a good photocatalyst for the simultaneous photocatalytic Cr(VI) reduction and RhB degradation.
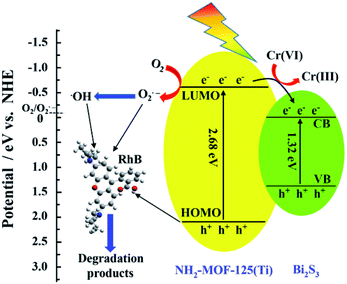 | ||
| Fig. 13 Schematic diagram of simultaneous Cr(VI) and RhB decontamination over Bi2S3@NH2-MIL-125(Ti) under visible light. | ||
Conclusions
In summary, a series of Bi2S3@NH2-MIL-125(Ti) heterojunctions were prepared via solvothermal method and used as a bifunctional photocatalysts for Cr(VI) reduction and RhB oxidation under visible light irradiation. As a photosensitizer, Bi2S3 improved the visible light absorption and narrowed the band-gap of Bi2S3@NH2-MIL-125(Ti) nanocomposite to 2.59 eV. Cr(VI) photocatalytic reduction rate was 8.86-fold that of the NH2-MIL-125(Ti) and 3.57-fold that of the Bi2S3, whereas the photocatalytic degradation rate toward RhB was 1.09-fold that of the NH2-MIL-125(Ti) and 29.2-fold that of the Bi2S3 over Bi2S3@NM-100 photocatalyst. It indicates the synergetic effect between two components is present and significantly improves photocatalytic activity. The detailed reaction mechanism analysis suggests that the photoexcited electrons transfer from NH2-MIL-125(Ti) to Bi2S3 through Bi2S3@NH2-MIL-125(Ti) heterojunction with well-matched band gap structure, which suppress charge recombination and enhanced photocatalytic activity. Moreover, cycle experiments showed that the as-prepared photocatalyst had good stability and reusability. This work is useful for the rational design of bifunctional photocatalysts based on semiconductor/MOF heterostructures, which have great potentiality in decontamination of heavy metal ions and organic pollutants in the wastewater.Conflicts of interest
There are no conflicts to declare.Acknowledgements
The present work is supported by Programs for the National Natural Science Foundation of China (NSFC: Account No. U1604127, 21601161 and 21571159), and Innovative Technology Team of Henan Province.References
- J. Wang, C. Cui, Y. Li, L. Liu, Y. Zhang and W. Shi, J. Hazard. Mater., 2017, 339, 43–53 CrossRef CAS PubMed.
- C. Yang, J. Qin, Z. Xue, M. Ma, X. Zhang and R. Liu, Nano Energy, 2017, 41, 1–9 CrossRef CAS.
- D. Lu, P. Fang, W. Wu, J. Ding, L. Jiang, X. Zhao, C. Li, M. Yang, Y. Li and D. Wang, Nanoscale, 2017, 9, 3231–3245 RSC.
- C. Wang, D. Liu and W. Lin, J. Am. Chem. Soc., 2013, 135, 13222–13234 CrossRef CAS PubMed.
- T. Rodenas, I. Luz, G. Prieto, B. Seoane, H. Miro, A. Corma, F. Kapteijn, F. X. Llabrés I Xamena and J. Gascon, Nat. Mater., 2014, 14, 48–55 CrossRef PubMed.
- J. E. Bachman, M. T. Kapelewski, D. A. Reed, M. I. Gonzalez and J. R. Long, J. Am. Chem. Soc., 2017, 139, 15363–15370 CrossRef CAS PubMed.
- J. Y. Kim, R. Balderas-Xicohténcatl, L. Zhang, S. G. Kang, M. Hirscher, H. Oh and H. R. Moon, J. Am. Chem. Soc., 2017, 139, 15135–15141 CrossRef CAS PubMed.
- J. Hu, H. Cai, H. Ren, Y. Wei, Z. Xu, H. Liu and Y. Hu, Ind. Eng. Chem. Res., 2010, 49, 12605–12612 CrossRef CAS.
- J. Ye and J. K. Johnson, Catal. Sci. Technol., 2016, 6, 8392–8405 CAS.
- Y. Fu, D. Sun, Y. Chen, R. Huang, Z. Ding, X. Fu and Z. Li, Angew. Chem., 2012, 124, 3420–3423 CrossRef.
- K. Jiang, L. Zhang, Q. Hu, Q. Zhang, W. Lin, Y. Cui, Y. Yang and G. Qian, Chem.–Eur. J., 2017, 23, 10215–10221 CrossRef CAS PubMed.
- W. Chen, X. Yu, W. Liao, Y. S. Sohn, A. Cecconello, A. Kozell, R. Nechushtai and I. Willner, Adv. Funct. Mater., 2017, 27, 1702102 CrossRef.
- J. Liu, T. Bao, X. Yang, P. Zhu, L. Wu, J. Sha, L. Zhang, L. Dong, X. Cao and Y. Lan, Chem. Commun., 2017, 53, 7804–7807 RSC.
- Z. Jin, W. Dong, M. Yang, J. Wang, H. Gao and G. Wang, ChemCatChem, 2016, 8, 3510–3517 CrossRef CAS.
- T. Araya, M. Jia, J. Yang, P. Zhao, K. Cai, W. Ma and Y. Huang, Appl. Catal., B, 2017, 203, 768–777 CrossRef CAS.
- D. Shi, R. Zheng, M. Sun, X. Cao, C. Sun, C. Cui, C. Liu, J. Zhao and M. Du, Angew. Chem., Int. Ed., 2017, 56, 14637–14641 CrossRef CAS PubMed.
- R. Liang, F. Jing, L. Shen, N. Qin and L. Wu, J. Hazard. Mater., 2015, 287, 364–372 CrossRef CAS PubMed.
- X. Xu, R. Liu, Y. Cui, X. Liang, C. Lei, S. Meng, Y. Ma, Z. Lei and Z. Yang, Appl. Catal., B, 2017, 210, 484–494 CrossRef CAS.
- Z. Li, J. Xiao and H. Jiang, ACS Catal., 2016, 6, 5359–5365 CrossRef CAS.
- J. G. Santaclara, M. A. Nasalevich, S. Castellanos, W. H. Evers, F. C. M. Spoor, K. Rock, L. D. A. Siebbeles, F. Kapteijn, F. Grozema, A. Houtepen, J. Gascon, J. Hunger and M. A. van der Veen, ChemSusChem, 2016, 9, 388–395 CrossRef CAS PubMed.
- H. Wang, X. Yuan, Y. Wu, G. Zeng, X. Chen, L. Leng and H. Li, Appl. Catal., B, 2015, 174, 445–454 CrossRef.
- H. Wang, X. Yuan, Y. Wu, G. Zeng, X. Chen, L. Leng, Z. Wu, L. Jiang and H. Li, J. Hazard. Mater., 2015, 286, 187–194 CrossRef CAS PubMed.
- S. Zhu, P. Liu, M. Wu, W. Zhao, G. Li, K. Tao, F. Yi and L. Han, Dalton Trans., 2016, 45, 17521–17529 RSC.
- H. Yu, J. Wang, T. Wang, H. Yu, J. Yang, G. Liu, G. Qiao, Q. Yang and X. Cheng, CrystEngComm, 2017, 19, 727–733 RSC.
- S. Wang, X. Li, Y. Chen, X. Cai, H. Yao, W. Gao, Y. Zheng, X. An, J. Shi and H. Chen, Adv. Mater., 2015, 27, 2775–2782 CrossRef CAS PubMed.
- X. Gao, H. B. Wu, L. Zheng, Y. Zhong, Y. Hu and X. W. D. Lou, Angew. Chem., 2014, 126, 6027–6031 CrossRef.
- N. Liang, J. Zai, M. Xu, Q. Zhu, X. Wei and X. Qian, J. Mater. Chem. A, 2014, 2, 4208–4216 CAS.
- L. Shen, S. Liang, W. Wu, R. Liang and L. Wu, J. Mater. Chem. A, 2013, 1, 11473–11482 CAS.
- X. Zeng, L. Huang, C. Wang, J. Wang, J. Li and X. Luo, ACS Appl. Mater. Interfaces, 2016, 8, 20274–20282 CAS.
- R. Liang, F. Jing, L. Shen, N. Qin and L. Wu, Nano Res., 2015, 8, 3237–3249 CrossRef CAS.
- Z. Ge, B. Zhang, Z. Yu and B. Jiang, CrystEngComm, 2012, 14, 2283–2288 RSC.
- M. Dan-Hardi, C. Serre, T. Frot, L. Rozes, G. Maurin, C. Sanchez and G. Férey, J. Am. Chem. Soc., 2009, 131, 10857–10859 CrossRef CAS PubMed.
- B. Sun, F. Qiao, L. Chen, Z. Zhao, H. Yin and S. Ai, Biosens. Bioelectron., 2014, 54, 237–243 CrossRef CAS PubMed.
- D. Sun, W. Liu, Y. Fu, Z. Fang, F. Sun, X. Fu, Y. Zhang and Z. Li, Chem.–Eur. J., 2014, 20, 4780–4788 CrossRef CAS PubMed.
- Z. Fang, Y. Liu, Y. Fan, Y. Ni, X. Wei, K. Tang, J. Shen and Y. Chen, J. Phys. Chem. C, 2011, 115, 13968–13976 CAS.
- M. A. Butler, J. Appl. Phys., 1977, 48, 1914–1920 CrossRef CAS.
- O. Akhavan and E. Ghaderi, Nanoscale, 2013, 5, 10316–10326 RSC.
- Y. Deng, L. Tang, G. Zeng, Z. Zhu, M. Yan, Y. Zhou, J. Wang, Y. Liu and J. Wang, Appl. Catal., B, 2017, 203, 343–354 CrossRef CAS.
- B. Feng, Z. Wu, J. Liu, K. Zhu, Z. Li, X. Jin, Y. Hou, Q. Xi, M. Cong, P. Liu and Q. Gu, Appl. Catal., B, 2017, 206, 242–251 CrossRef CAS.
- H. Ma, Y. Zhang, Q. Hu, D. Yan, Z. Yu and M. Zhai, J. Mater. Chem., 2012, 22, 5914–5916 RSC.
- F. Lin, D. Wang, Z. Jiang, Y. Ma, J. Li, R. Li and C. Li, Energy Environ. Sci., 2012, 5, 6400–6406 CAS.
- S. Yuan, T. Liu, D. Feng, J. Tian, K. Wang, J. Qin, Q. Zhang, Y. Chen, M. Bosch, L. Zou, S. J. Teat, S. J. Dalgarno and H. Zhou, Chem. Sci., 2015, 6, 3926–3930 RSC.
- J. Huang, Q. Shang, Y. Huang, F. Tang, Q. Zhang, Q. Liu, S. Jiang, F. Hu, W. Liu, Y. Luo, T. Yao, Y. Jiang, Z. Pan, Z. Sun and S. Wei, Angew. Chem., 2016, 128, 2177–2181 CrossRef.
- C. H. Hendon, D. Tiana, M. Fontecave, C. Sanchez, L. D. Arras, C. Sassoye, L. Rozes, C. Mellot-Draznieks and A. Walsh, J. Am. Chem. Soc., 2013, 135, 10942–10945 CrossRef CAS PubMed.
- B. Wang, J. Di, P. Zhang, J. Xia, S. Dai and H. Li, Appl. Catal., B, 2017, 206, 127–135 CrossRef CAS.
- Q. Liang, J. Jin, M. Zhang, C. Liu, S. Xu, C. Yao and Z. Li, Appl. Catal., B, 2017, 218, 545–554 CrossRef CAS.
- J. Xie, Y. Cao, D. Jia and Y. Li, J. Colloid Interface Sci., 2017, 503, 115–123 CrossRef CAS PubMed.
Footnote |
| † Electronic supplementary information (ESI) available. See DOI: 10.1039/c8ra00882e |
| This journal is © The Royal Society of Chemistry 2018 |

