
 Open Access Article
 This Open Access Article is licensed under a Creative Commons Attribution-Non Commercial 3.0 Unported Licence
Amplification of surface-enhanced Raman scattering by the oxidation of capping agents on gold nanoparticles†
M. V. Gorbachevskii ,
D. S. Kopitsyn,
M. S. Kotelev,
E. V. Ivanov,
V. A. Vinokurov and
A. A. Novikov*
,
D. S. Kopitsyn,
M. S. Kotelev,
E. V. Ivanov,
V. A. Vinokurov and
A. A. Novikov*
Gubkin University, Russia. E-mail: novikov.a@gubkin.ru
First published on 23rd May 2018
Abstract
Surface-enhanced Raman spectroscopy is a powerful analytical method, and is especially useful for the detection of nitrogen- and sulfur-containing organic substances in trace amounts. SERS substrates with high enhancement factors can be produced via the aggregation of gold nanoparticles, leading to the formation of ‘hot spots’ – regions of highest electric field intensity and Raman scattering enhancement. Thus, the availability of gold surfaces in ‘hot spots’ for the adsorption of analyte molecules strongly influences the enhancement factor of a substrate. We studied the kinetics of oxidation of dyes with hydrogen peroxide in the presence of citrate-capped gold nanoparticles and discovered the amplification of surface-enhanced Raman scattering, probably due to the oxidation of citrate ligands and the additional adsorption of dye molecules onto vacant spots on the gold surface. Maximum amplification was observed with 3% (v/v) hydrogen peroxide in the reaction medium. Under optimized conditions, model analytes can be detected at concentrations as low as 1 × 10⁻⁹ M, which is ten times lower than the detection limit without hydrogen peroxide addition.
Introduction
Surface-enhanced Raman spectroscopy on gold nanoparticles is a powerful analytical method. Among the metals with plasmon resonance in the visible spectrum, gold is the most stable in relation to oxidation. In contrast to the inertness of bulk gold, gold nanoparticles demonstrate profound catalytic activity. This fact opens the way for studies combining the catalytic and SERS activities of gold nanoparticles.1–9 The properties of gold nanoparticles are highly dependent on their size: most active gold catalysts are smaller than 10 nm,9–12 while high enhancement of Raman scattering is observed for nanoparticles larger than 20 nm.13,14In order to combine high catalytic activity and Raman enhancement, gold nanoparticles of different sizes can be employed together. The catalytic activity of gold nanoparticles can be blocked by a thin layer of silica, thus allowing combined studies of redox reactions, such as the reduction of 4-nitrothiophenol using large shell-isolated nanoparticles as a Raman enhancer and small satellite nanoparticles as catalysts.2 Catalytically active SERS nanostructures can be prepared via the self-assembly of gold nanoparticles at a water–dimethyl carbonate interface. The assembled thin films can be transferred to a silicon substrate and successfully used for the in situ monitoring of the same model reaction.15
The resistance of gold nanoparticles to oxidation provides the opportunity to study not only reduction, but also oxidation reactions.2,16–19 These studies are particularly promising considering recent advances in redox “nanozymes” research – these are biomolecule–nanoparticle complexes that display the catalytic or electron transfer properties of metal nanoparticles.20–22
For SERS-controlled studies of redox reactions over a broad concentration range, high enhancement factors are required. The enhancement factor in its turn crucially depends on the accessibility of gold nanoparticle surfaces for the reactants or reaction products. Highly accessible surfaces can be provided by citrate-stabilized nanoparticles, because citrate can be easily exchanged for most –NH or –SH functionalized ligands.23–25 Ligand-free nanoparticles produced via laser ablation also have good surface accessibility.26,27
Even with easily exchanged ligands such as citrate, hot spots in ensembles of aggregated nanoparticles may be blocked by excess capping agents and by-products of wet chemical synthesis, resulting in poor and irreproducible enhancement factors. Thus, the introduction of an oxidizing agent into a colloidal system may have a significant effect on it.
In this work, we report for the first time to our knowledge the effects of SERS amplification via the oxidation of a citrate capping agent using hydrogen peroxide. This effect lowers the detection limit for model analytes up to ten times.
Results and discussion
The influence of an oxidizing agent on the accessibility of hot spots in SERS-active nanostructures was investigated using aggregated gold nanoparticles as the SERS substrate, crystal violet (CV) and rhodamine 6G (R6G) as model analytes, and hydrogen peroxide as an oxidant.The intensity of a SERS signal strongly depends on the optical properties of the nanoparticles dispersion. Aggregation of spherical gold nanoparticles induces a bathochromic shift in surface plasmon resonance from 520–550 nm towards the near infrared range. We have chosen 785 nm excitation for SERS experiments because it corresponds to the first transparency window of biological tissues (650–950 nm),28 and thus is particularly promising for further studies with bio-analytes.
First of all, the time dependencies of the SERS signals of dyes were studied when dye solutions had been mixed with dispersion of nanoparticles without hydrogen peroxide (Fig. 1B). The intensities of the SERS spectra increase after mixing the solutions and continue to grow for 1.5 h for crystal violet and for 0.5 h for rhodamine 6G. These time delays indicate significantly restricted adsorption, because the adsorption of dyes on non-aggregated nanoparticles occurs faster than mixing.29 The difference in SERS signal growth rate between crystal violet and rhodamine 6G is most probably due to differences in charge, the sizes of hydration shells, and chemical affinity to gold.
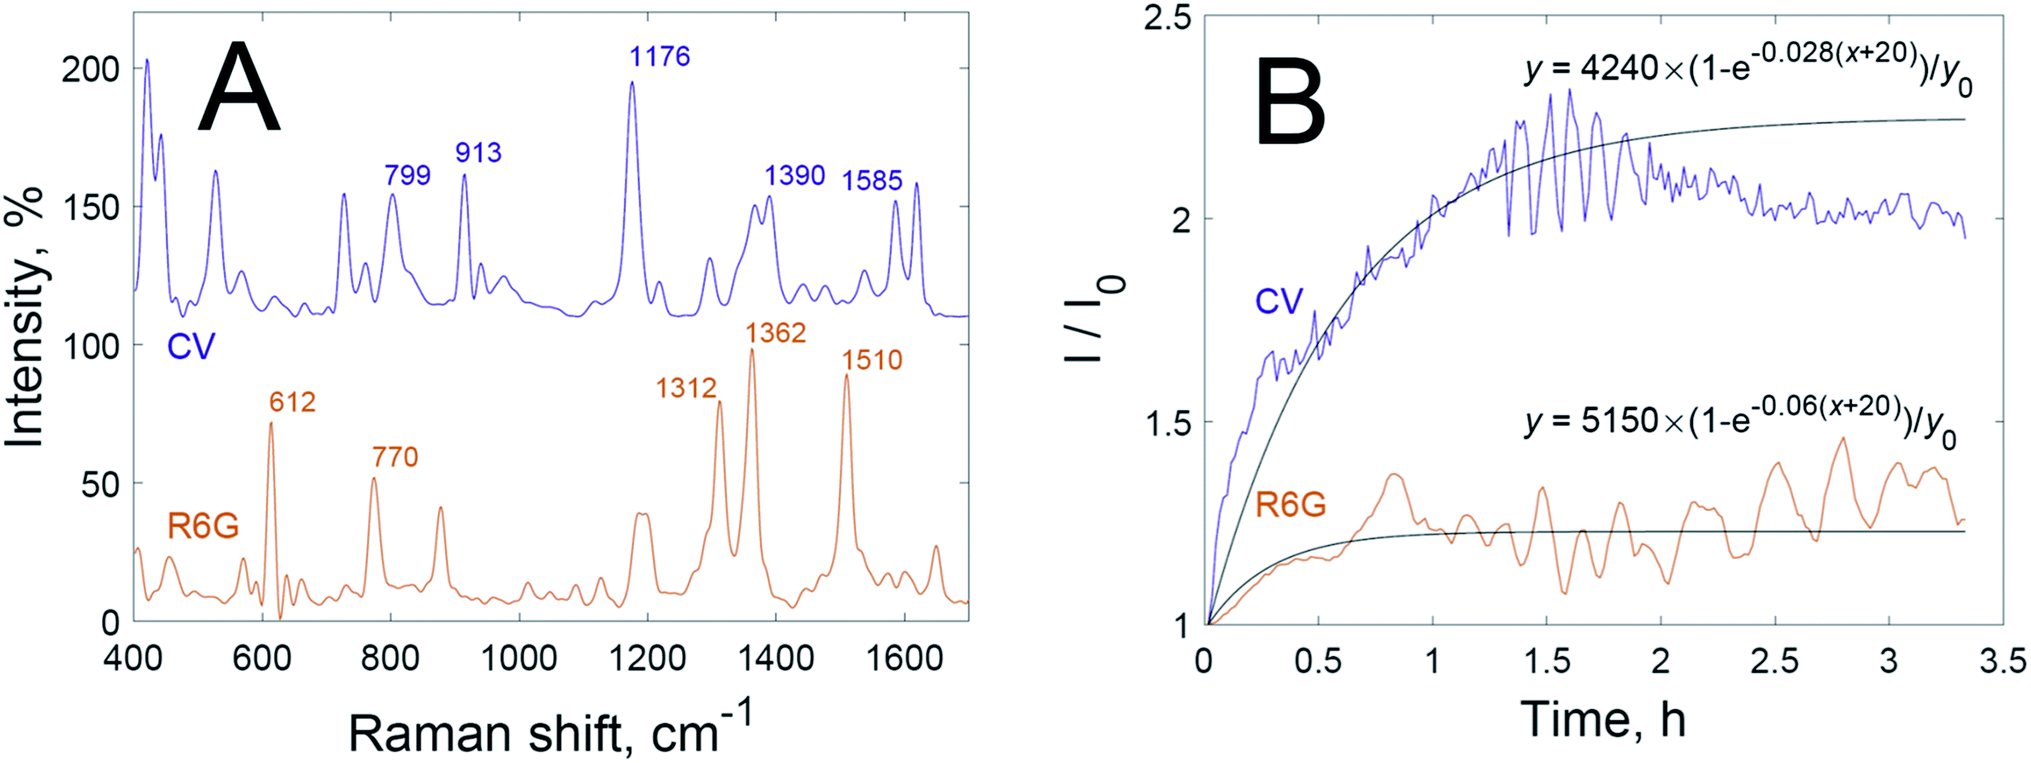 | ||
| Fig. 1 (A) SERS spectra of 10−6 M rhodamine 6G solution (orange) and 5 × 10⁻⁷ M crystal violet solution (violet); and (B) experimental (colour) and approximated (black) time dependencies of SERS intensity for rhodamine 6G (orange) and crystal violet (violet) solutions mixed with a dispersion of gold nanoparticles. | ||
After a certain time the growth in SERS intensity stops; this corresponds to the saturation of ‘hot spots’ by adsorbed dye. We have fitted the time dependencies of the SERS signals using functions of the following type:
The fitted time dependencies of the SERS intensities (black lines in Fig. 1B) show an initial growth with a following plateau in intensity. Experimental curves of intensity, however, differ from the fitted curves after saturation. Fluctuations in the graph may originate from the known “SERS blinking” phenomenon30,31 or be due to circulation of the dispersion in the cuvette, which leads to oscillations in SERS intensity over time as hot spots flow in and out of laser focus. Thus, there are different optimal times for the recording of SERS spectra for each dye: right after signal growth, but before the onset of oscillations.
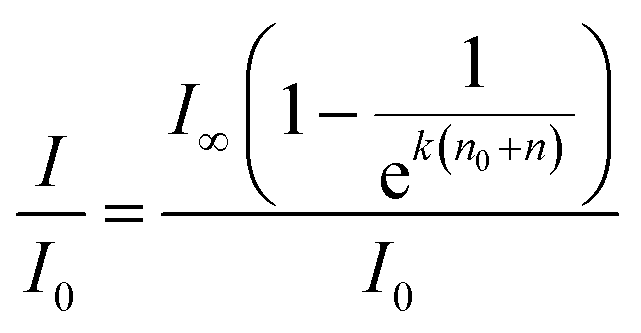
The introduction of an oxidant to a dispersion of nanoparticles with an already added dye complicates the interactions even further. First, it can oxidize dye molecules, thus lowering the signal intensity. Second, it can oxidize the capping agent, leading to better accessibility to the nanoparticle surfaces for the dye, and to the additional aggregation of nanoparticles, thus creating new hot spots. The catalytic and photothermal activities of the nanoparticles may aggravate the oxidation of dyes. We studied the catalytic oxidation of rhodamine 6G (Fig. 2A) and crystal violet (Fig. 2B) using hydrogen peroxide in the dark with various added amounts of gold nanoparticle dispersion. It was found that, while oxidation follows first-order kinetics, the rate constant is dependent on the added amount of gold nanoparticles for both dyes (Fig. 2C and D).
 | ||
| Fig. 2 The oxidation kinetics of crystal violet (A) and rhodamine 6G (B), using hydrogen peroxide with various added amounts of gold nanoparticle dispersion; and the oxidation rate constants for crystal violet (C) and rhodamine 6G (D), dependent on the added amount of gold nanoparticle dispersion. | ||
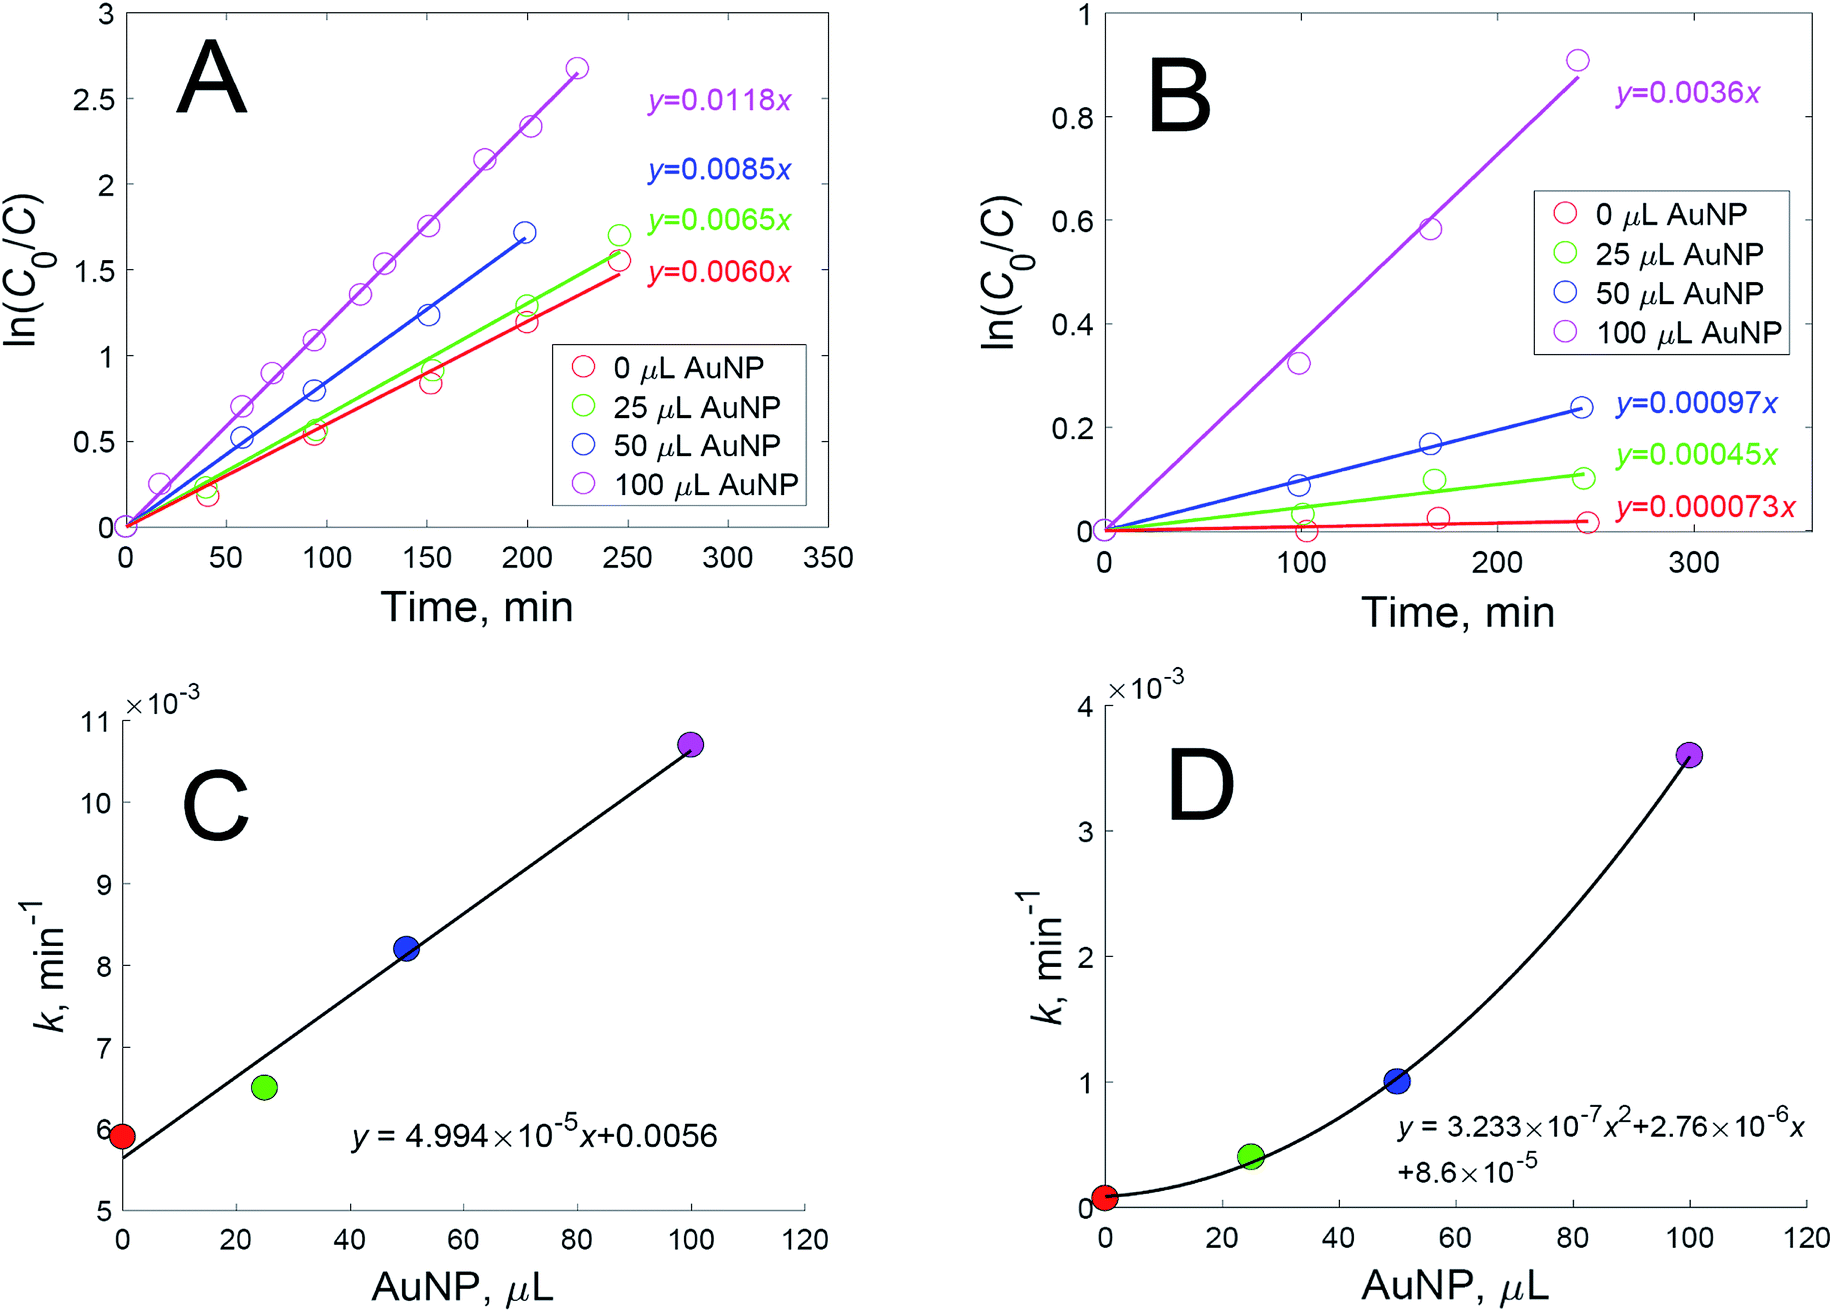
The nanoparticles used in the experiments were studied via the methods of transmission electron microscopy and dynamic light scattering in order to determine the size and shape of the nanoparticles. It was found that there were no nanoparticles smaller than 20 nm in the sample, and the mean diameter of the nanoparticles was 52.5 ± 4.8 nm (Fig. 3A). These gold nanoparticles catalyzed the oxidation of both dyes according to first-order kinetic equations. This is a rather unexpected result, as most research describes the catalytic activity of gold nanoparticles only when they have a size less than 10 nm.9–12 Therefore, the amount of hydrogen peroxide used for SERS experiments must be minimized in order to prevent the catalytic oxidation of dyes.
 | ||
| Fig. 3 (A) TEM image of the gold nanoparticles used for SERS experiments: bar = 200 nm; (B) a high-resolution TEM image of a single gold nanoparticle from the same batch: bar = 20 nm; and (C) an SEM image of the SERS substrate prepared with gold nanoparticles from the same batch on aluminum foil: bar = 5 μm. | ||
Despite this, varying the hydrogen peroxide concentration showed that a maximum intensity of SERS signal was achieved with 3% hydrogen peroxide for both dyes. In Fig. 4, each point corresponds to the time maximum of SERS intensity under the given conditions.
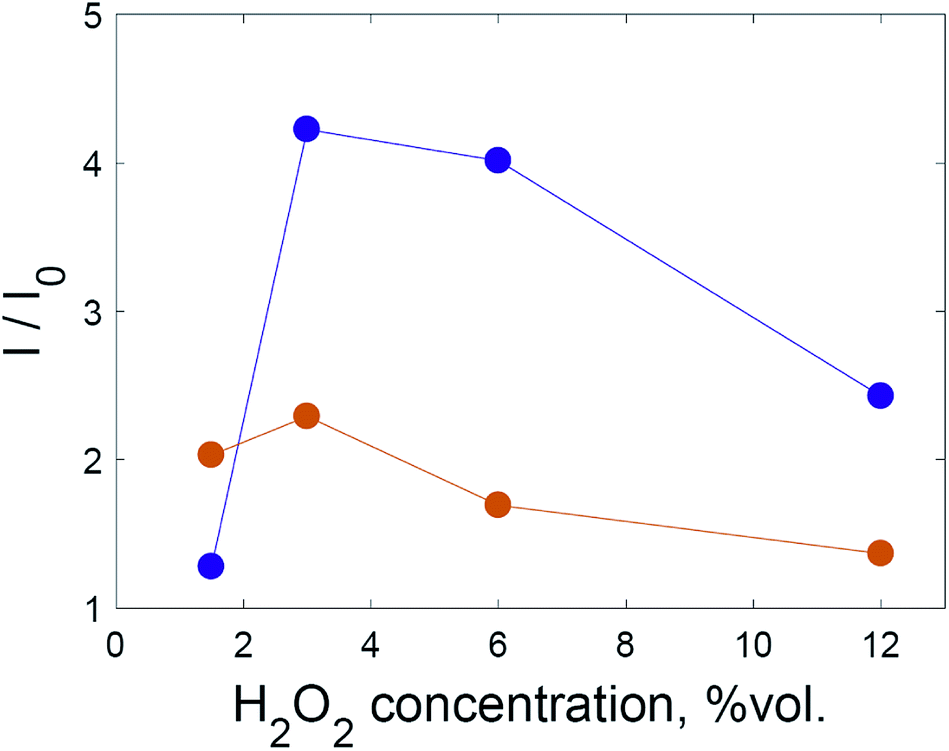 | ||
| Fig. 4 The intensity of the SERS spectrum at various H2O2 concentrations for crystal violet at 1176 cm−1 (violet) and rhodamine 6G at 1510 cm−1 (orange). The lines are a guide for the eye. | ||
Hydrogen peroxide could affect the SERS intensity in opposite ways: the SERS intensity may increase due to the oxidation of adsorbed capping agent (citrate), because existing hot spots become better available for dye adsorption; the SERS intensity may increase due to the formation of additional hot spots as a result of the lowered colloidal stability of the system after oxidation of the capping agent; the SERS intensity may decrease due to the oxidation of dye molecules; or the SERS intensity may decrease due to the deterioration of existing hot spots.
It is known that the central carboxylic acid group of citric acid has the lowest pKa value,32 and it binds on the Au surface preferentially, judging by ATR-IR and XPS data, especially in the low pH environment routinely used for aggregating the nanoparticles.33 In the oxidation of citric acid, acetonedicarboxylic acid has been identified as the first intermediate product, which is finally oxidised to carbon dioxide.34,35 The loss of the central carboxylic group diminishes the affinity of the oxidation adducts to the gold surface, thus facilitating the removal of capping agents from the hot spots, making them available for dye adsorption.
Based on the results shown in Fig. 4, the first two factors dominate when the hydrogen peroxide concentration is less than 3%. In order to discriminate these two factors, experiments were conducted using solid substrates obtained via repeatedly depositing and drying gold nanoparticles on aluminium foil (Fig. 5).
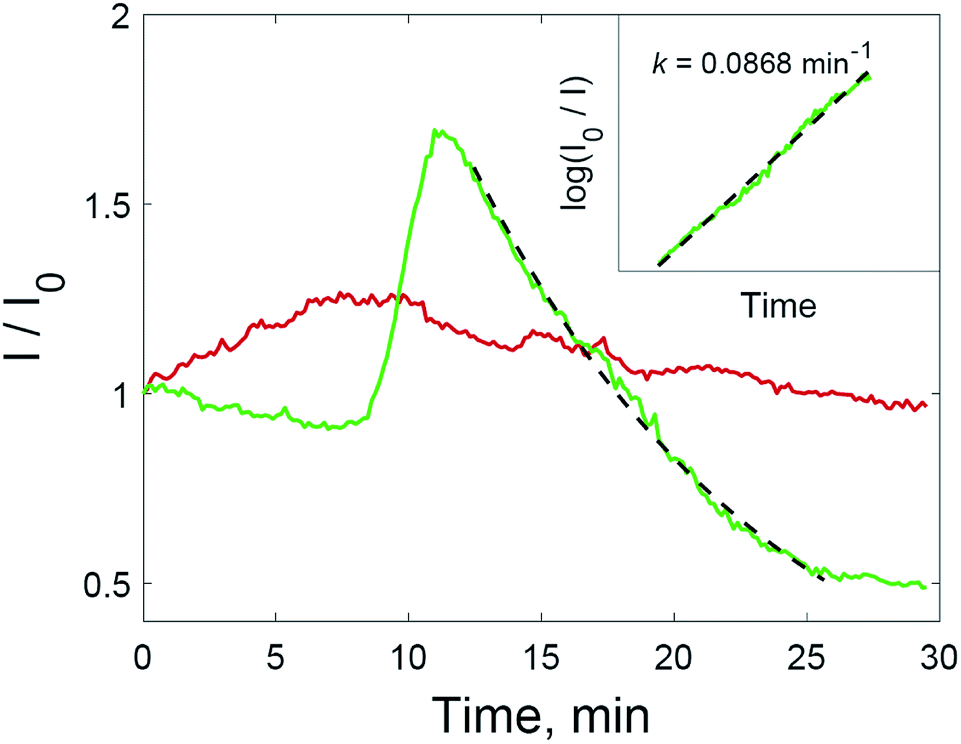 | ||
| Fig. 5 The intensity of the SERS signal at 1176 cm−1 registered from a drop of crystal violet solution (2 × 10⁻⁶ M) on a solid substrate (red), or from a drop of the same solution with added hydrogen peroxide (green); the inset shows the linearization of the SERS signal over the range of 12–25 min on a log scale for the drop with added H2O2. | ||
The advantage of the above-mentioned substrates is their stability over time. Hot spots are formed during the creation of such substrates. The structure and morphology of nanoparticle aggregates in the finished substrate is basically stable over time compared to a dispersion of nanoparticles. The number of hot spots in the finished substrate is constant, which allows the elimination of fluctuations in signal (as in Fig. 1) arising from the instability of nanoparticle dispersions and the circulation of hot spots through the laser focus.
The addition of hydrogen peroxide at concentrations above 3 vol% in SERS experiments with solid substrates aggravates dye oxidation and leads to the deterioration of the substrates. In this case, we even observed the corrosion of the supporting aluminium foil. These changes are visible when distortion of the droplet boundaries occurred. In addition, the SERS effect was irreversibly lost for this substrate. The addition of dye on the undamaged substrate increases the SERS intensity. However, this is no longer possible for substrates treated with hydrogen peroxide at a concentration of more than 3%.
Two processes on the surface of the substrates with added hydrogen peroxide solution have the opposite effect on the SERS intensity compared to untreated substrate. Improved accessibility to hot spots due to the oxidation of the capping agent leads to the additional amplification of the SERS intensity during the range of 8–12 min. After 12 minutes, the intensity of the SERS signal decreases again, and this downward trend is more intense than before 8 min. After this, only the oxidation of dye molecules affects the change in SERS intensity. The signal decreases according to first-order kinetics (Fig. 5, inset). The rate constant is 0.0868 min−1, which is higher than those shown in Fig. 2 due to the much higher concentration of nanoparticles in the solid substrate compared to nanoparticle dispersions. The rate constant may also be increased due to photothermal effects in the vicinity of the nanoparticle surfaces, because aggregated nanoparticles demonstrate absorption at the excitation wavelength (785 nm).36,37 As a result of the interplay between these factors, the SERS intensity increased for all major peaks in the crystal violet spectrum (Fig. 6).
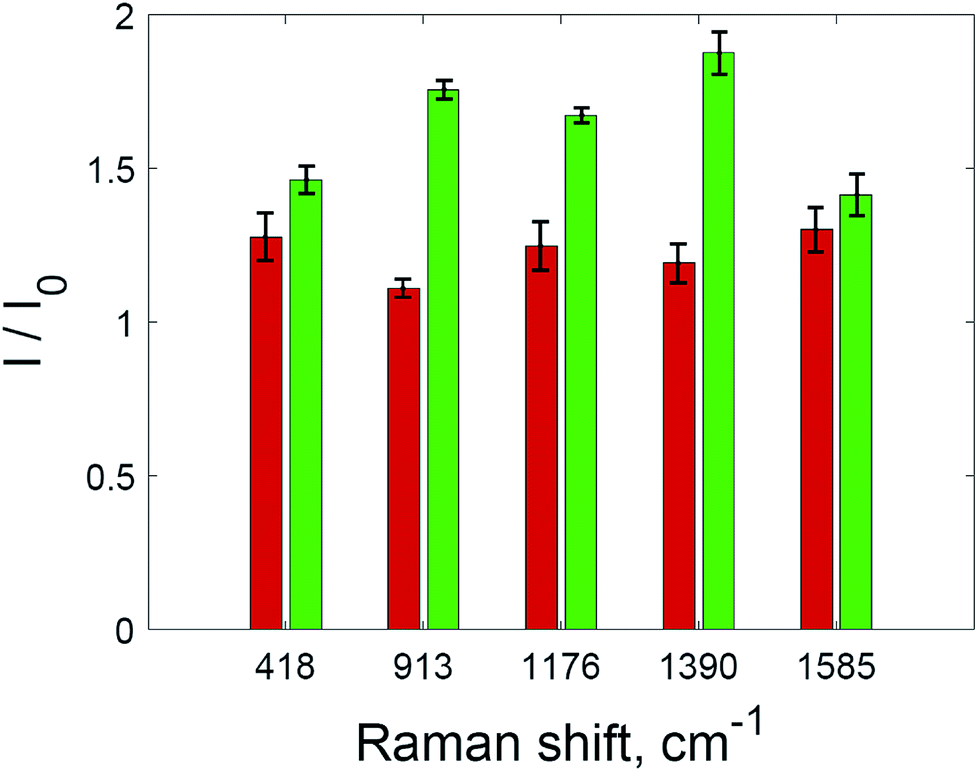 | ||
| Fig. 6 The intensities of SERS spectra for selected peaks of crystal violet without hydrogen peroxide (red) and with hydrogen peroxide (green). The error bars show standard deviation. | ||
The maximum SERS intensity in the experiments without hydrogen peroxide (Fig. 5, red curve) corresponds to changes in the drop shape induced by water evaporation. In this case, a maximum intensity is achieved when the drop with the analyte has evaporated, but the substrate is still wet. This effect is weaker than the effect of hydrogen peroxide (Fig. 6).
Additional amplification of the SERS signal using hydrogen peroxide addition can be useful when it is necessary to reduce the detection limits of analytes studied via SERS spectroscopy. Quantitative analysis via SERS spectroscopy is often complicated by the insufficient reproducibility of the signal. Nevertheless, a correlation between the concentration of the analyte and the intensity of the SERS spectra is observed in the case of substrates treated with hydrogen peroxide (Fig. 7). The most appropriate signal for quantitative determination is the intensity at 1176 cm−1, due to the highest linear correlation with concentration (see also Fig. S7 and S8† in the ESI material†).
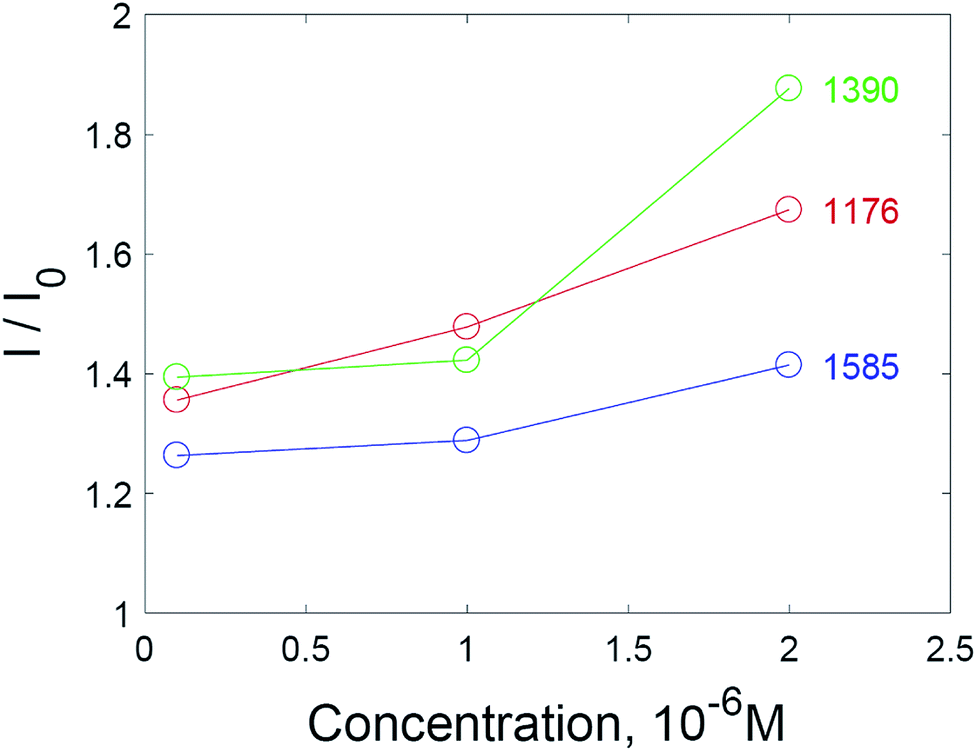 | ||
| Fig. 7 Normalized intensities of SERS spectra for selected peaks of crystal violet on solid SERS substrates. | ||
The use of hydrogen peroxide makes it possible to register SERS spectra of 5 × 10⁻⁹ M crystal violet solution (Fig. 8) and 5 × 10⁻⁹ M rhodamine 6G solution (Fig. 9), which was impossible using the same substrates and setup without hydrogen peroxide addition. The number and Raman shifts of peaks in spectra obtained via this method are identical to those obtained without hydrogen peroxide. The exception is the peak at 878 cm−1, corresponding to O–O bond stretching in molecules of hydrogen peroxide.38
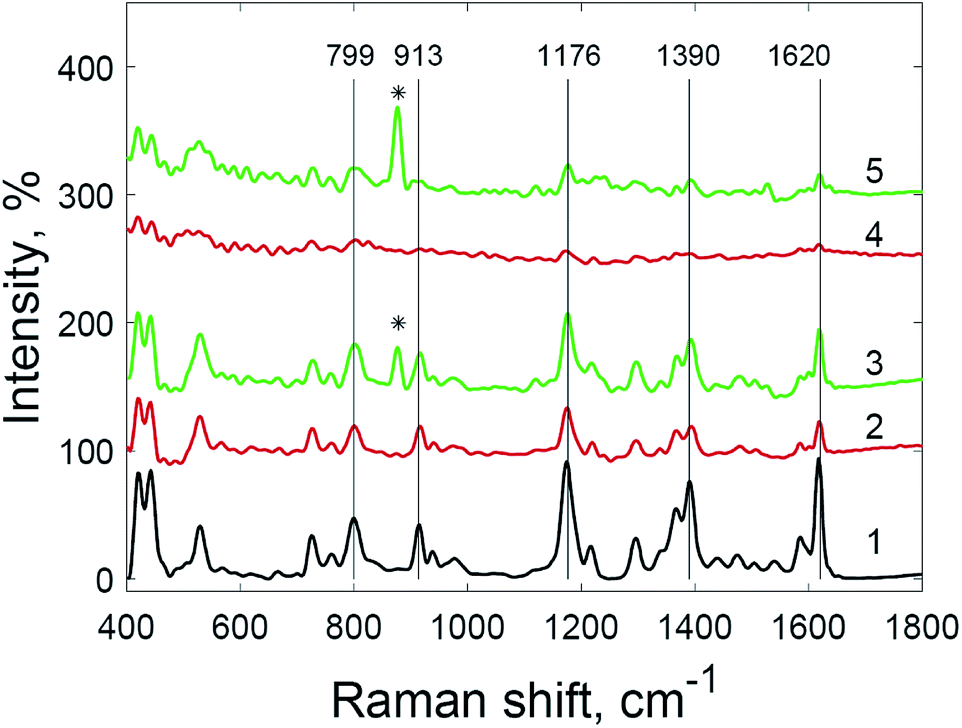 | ||
| Fig. 8 Raman spectrum of crystal violet (1) and SERS spectra of crystal violet at various concentrations: (2) 5 × 10⁻⁸ M; (3) 5 × 10⁻⁸ M with hydrogen peroxide; (4) 5 × 10⁻⁹ M; and (5) 5 × 10⁻⁹ M with hydrogen peroxide (* = peak from hydrogen peroxide O–O stretching). | ||
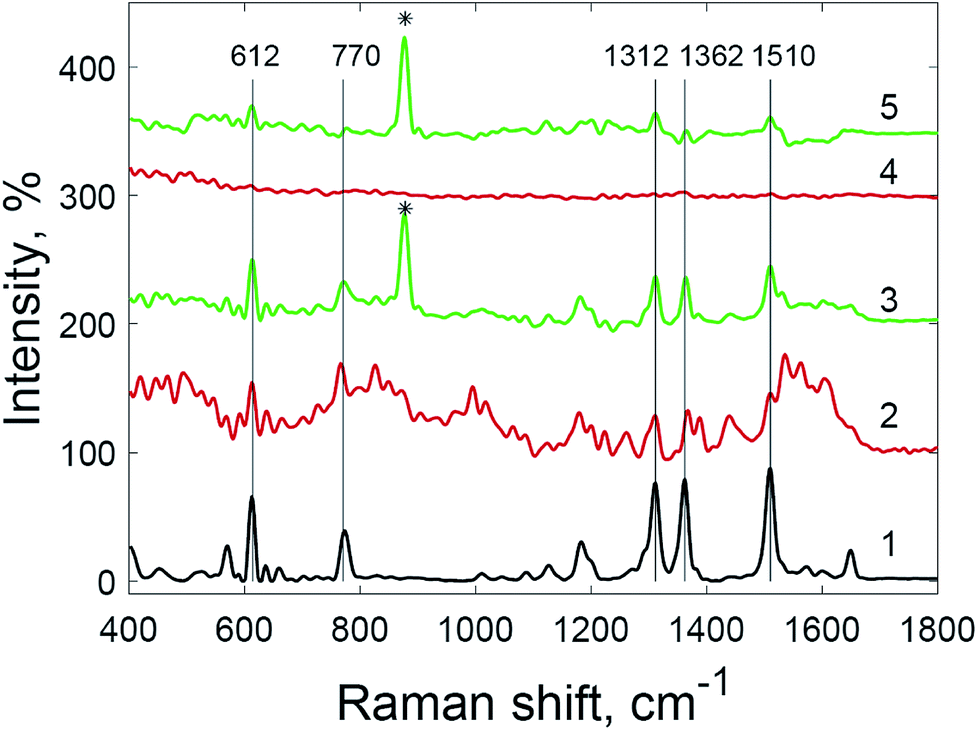 | ||
| Fig. 9 Raman spectrum of rhodamine 6G (1) and SERS spectra of rhodamine 6G at different concentrations: (2) 5 × 10⁻⁸ M; (3) 5 × 10⁻⁸ M with hydrogen peroxide; (4) 5 × 10⁻⁹ M; and (5) 5 × 10⁻⁹ M with hydrogen peroxide (* = peak from hydrogen peroxide O–O stretching). | ||
Experimental
Materials and methods
Tetrachloroauric acid (HAuCl4·3H2O, 99.9%), sodium citrate dihydrate (99%), and rhodamine 6G were purchased from Sigma-Aldrich (St. Louis, MO, USA). Sodium hydroxide (99%), hydrogen peroxide (37 vol%), crystal violet, nitric acid and hydrochloric acid were acquired from Chimmed (Moscow, Russia). All chemicals were used as received without further purification. Deionized water with resistivity of no less than 18 MΩ × cm (Simplicity UV, Millipore, USA) was used to prepare all aqueous solutions. Glassware was cleaned before use by soaking in freshly prepared aqua regia and rinsing with deionized water.Synthesis of gold nanoparticles
SEM images were recorded with a JIB-4501 electron microscope (JEOL, Japan).
SERS spectra were processed automatically using GNU/Octave subroutines.40 Briefly, spectra were imported from the spectrometer-generated source data files, the fluorescence background was subtracted via a polynomial-fitting method,41 high-frequency noise was filtered via designed filters, and the peak lists were extracted and exported to Excel files for visualization and interpretation. Filters were designed using a function from the GNU/Octave “signal” package with the following specifications: passband at 0.10 × f; stopband at 0.15 × f; allowed ripple less than 0.5 dB; and attenuation 30 dB. A Chebyshev type II filter was used because it had the lowest order, which favours computational stability. Furthermore, the nanoparticle spectrum was subtracted from the spectra of analytes after normalization.
To register the SERS spectra, 2 μL of analyte was dried on the substrate spot. The laser was focused on the spot, and 1 μL of H2O2 solution was applied to the spot without changing the laser focus position. The H2O2 concentration varied from 1 to 6 vol%. SERS spectra were continuously recorded for 35 minutes after the addition of hydrogen peroxide solution with an acquisition time of 8 s per spectrum.
Conclusions
Cheap and scalable SERS substrates prepared from gold nanoparticles are wanted for routine analytical implementation. One of the inherent problems with such substrates is the presence of oxidized reducing and capping agents adsorbed on the surfaces of nanoparticles. We discovered a fast and simple method for the amplification of SERS signals with gold nanoparticle-based substrates, allowing for the detection of analytes at concentrations lower by an order of magnitude than the detection limit in the absence of such treatment. This effect should be accounted for in emerging studies of “nanozymes”, which often include redox processes on the surfaces of nanoparticles.Conflicts of interest
There are no conflicts to declare.Acknowledgements
This work was supported by the Ministry of Education and Science of the Russian Federation (Grant No. 14.Z50.31.0035). The authors would like to thank the anonymous reviewers for their helpful and inspiring comments.Notes and references
- N. Takeyasu, R. Kagawa, K. Sakata and T. Kaneta, J. Phys. Chem. C, 2016, 120, 12163–12169 Search PubMed.
- W. Xie, B. Walkenfort and S. Schlücker, J. Am. Chem. Soc., 2013, 135, 1657–1660 CrossRef PubMed.
- B. N. Zope, D. D. Hibbitts, M. Neurock and R. J. Davis, Science, 2010, 330(6000), 74–78 CrossRef PubMed.
- N. Thielecke, K.-D. Vorlop and U. Prüße, Catal. Today, 2007, 122, 266–269 CrossRef.
- M. Haruta, T. Kobayashi, H. Sano and N. Yamada, Chem. Lett., 1987, 16, 405–408 CrossRef.
- M. Haruta, N. Yamada, T. Kobayashi and S. Iijima, J. Catal., 1989, 115(2), 301–309 CrossRef.
- J. Piella, F. Merkoçi, A. Genç, J. Arbiol, N. G. Bastús and V. Puntes, J. Mater. Chem. A, 2017, 5, 11917–11929 Search PubMed.
- M. D. Hughes, Y. J. Xu, P. Jenkins, P. McMorn, P. Landon, D. I. Enache, A. F. Carley, G. A. Attard, G. J. Hutchings, F. King, E. H. Stitt, P. Johnston, K. Griffin and C. J. Kiely, Nature, 2005, 437(7062), 1132–1135 CrossRef PubMed.
- M. Valden, X. Lai and D. W. Goodman, Science, 1998, 281(5383), 1647–1650 CrossRef PubMed.
- D. T. Thompson, Nano Today, 2007, 2(4), 40–43 CrossRef.
- A. Wittstock, V. Zielasek, J. Biener, C. M. Friend and M. Baumer, Science, 2010, 327(5963), 319–322 CrossRef PubMed.
- D. T. Campbell, Science, 2004, 306(5694), 234–235 CrossRef PubMed.
- J. T. Krug, G. D. Wang, S. R. Emory and S. Nie, J. Am. Chem. Soc., 1999, 121, 9208–9214 CrossRef.
- S. E. J. Bell and M. R. McCourt, Phys. Chem. Chem. Phys., 2009, 11, 7455 RSC.
- K. Zhang, J. Zhao, J. Ji, Y. Li and B. Liu, Anal. Chem., 2015, 87, 8702–8708 CrossRef PubMed.
- J. Zhang, S. A. Winget, Y. Wu, D. Su, X. Sun, Z. X. Xie and D. Qin, ACS Nano, 2016, 10(2), 2607–2616 CrossRef PubMed.
- Y. Ma, K. Promthaveepong and N. Li, ACS Sens., 2017, 2(1), 135–139 CrossRef PubMed.
- S. Zaleski, M. F. Cardinal, D. V. Chulhai, A. J. Wilson, K. A. Willets, L. Jensen and R. P. Van Duyne, J. Phys. Chem. C, 2016, 120, 24982–24991 Search PubMed.
- K. N. Heck, B. G. Janesko, G. E. Scuseria, N. J. Halas and M. S. Wong, ACS Catal., 2013, 3(11), 2430–2435 CrossRef.
- H. Wei and E. Wang, Chem. Soc. Rev., 2013, 42(14), 6060–6093 RSC.
- T. K. Sharma, R. Ramanathan, P. Weerathunge, M. Mohammadtaheri, H. K. Daima, R. Shukla and V. Bansal, Chem. Commun., 2014, 50, 15856–15859 RSC.
- D. Ratautas, E. Ramonas, L. Marcinkevičienė, R. Meškys and J. Kulys, ChemCatChem, 2018, 10, 971–974 CrossRef.
- J. Piella, N. G. Bastús and V. Puntes, Bioconjugate Chem., 2017, 28, 88–97 CrossRef PubMed.
- I. Ojea-Jimenez and V. Puntes, J. Am. Chem. Soc., 2009, 131(37), 13320–13327 CrossRef PubMed.
- I. Ojea-Jimenez, X. Lopez, J. Arbiol and V. Puntes, ACS Nano, 2012, 6(3), 2253–2260 CrossRef PubMed.
- T. Simão, P. Chevallier, J. Lagueux, M.-F. Côté, C. Rehbock, S. Barcikowski, M.-A. Fortin and D. Guay, J. Mater. Chem. B, 2016, 4, 6413–6427 RSC.
- M. R. Kalus, C. Rehbock, N. Bärsch and S. Barcikowski, Mater Today., 2017, 4, S93–S100 CrossRef.
- L. M. Maestro, E. Camarillo, J. A. Sánchez-Gil, R. Rodríguez-Oliveros, J. Ramiro-Bargueño, A. J. Caamaño, F. Jaque, J. G. Solé and D. Jaque, RSC Adv., 2014, 4, 54122–54129 RSC.
- B. L. Darby and E. C. Le Ru, J. Am. Chem. Soc., 2014, 136(31), 10965–10973 CrossRef PubMed.
- Y. Kitahama, D. Araki, Y. S. Yamamoto, T. Itoh and Y. Ozaki, Phys. Chem. Chem. Phys., 2015, 17, 21204–21210 RSC.
- Y. Kitahama, Y. Tanaka, T. Itoh and Y. Ozaki, Phys. Chem. Chem. Phys., 2011, 13, 7439 RSC.
- K. N. Pearce and L. K. Creamer, Aust. J. Chem., 1975, 28, 2409–2415 CrossRef.
- J. W. Park and J. S. Shumaker-Parry, J. Am. Chem. Soc., 2014, 136, 1907–1921 CrossRef PubMed.
- J. Turkevich, P. C. Stevenson and J. Hillier, Discuss. Faraday Soc., 1951, 11, 55 RSC.
- S. K. Sivaraman, S. Kumar and V. Santhanam, J. Colloid Interface Sci., 2011, 361, 543–547 CrossRef PubMed.
- Y. Gu, Y. Zhang, Y. Li, X. Jin, C. Huang, S. A. Maier and J. Ye, RSC Adv., 2018, 8, 14434–14444 RSC.
- M. V. Gorbachevskiy, D. S. Kopitsyn, I. A. Tiunov, M. S. Kotelev, V. A. Vinokurov and A. A. Novikov, Russ. J. Phys. Chem. A, 2017, 91, 141–144 CrossRef.
- A. V. Levanov, D. V. Sakharov, A. V. Dashkova, E. E. Antipenko and V. V. Lunin, Eur. J. Inorg. Chem., 2011, 2011, 5144–5150 CrossRef.
- N. G. Bastus, J. Comenge and V. Puntes, Langmuir, 2011, 27(17), 11098–11105 CrossRef PubMed.
- J. W. Eaton, D. Bateman, S. Hauberg, and R. Wehbring, GNU Octave version 4.2.1 manual: a high-level interactive language for numerical computations, 2017, https://www.gnu.org/software/octave/doc/v4.2.1 Search PubMed.
- C. A. Lieber and A. Mahadevan-Jansen, Appl. Spectrosc., 2003, 57, 1363–1367 CrossRef PubMed.
Footnote |
| † Electronic supplementary information (ESI) available: TEM images of gold nanoparticles, Raman and SERS spectra. See DOI: 10.1039/c8ra00417j |
| This journal is © The Royal Society of Chemistry 2018 |