
 Open Access Article
 This Open Access Article is licensed under a
 Creative Commons Attribution 3.0 Unported Licence
High N2 selectivity in selective catalytic reduction of NO with NH3 over Mn/Ti–Zr catalysts
Bolin Zhang,
Shengen Zhang *,
Bo Liu,
Hanlin Shen and
Lin Li
*,
Bo Liu,
Hanlin Shen and
Lin Li
Institute for Advanced Materials and Technology, University of Science and Technology Beijing, Beijing 100083, P. R. China. E-mail: zhangshengen@mater.ustb.edu.cn
First published on 3rd April 2018
Abstract
A series of Mn-based catalysts were prepared by a wet impregnation method for the selective catalytic reduction (SCR) of NO with NH3. The Mn/Ti–Zr catalyst had more surface area, Lewis acid sites, and Mn4+ on its surface, and showed excellent activity and high N2 selectivity in a wide temperature range. NH3 and NO oxidation was investigated to gain insight into NO reduction and N2O formation. The formation of N2O was primarily dominated by the reaction of NO with NH3 in the presence of O2 via the Eley–Rideal mechanism. An intimate synergistic effect existed between the Mn-based and the Ti–Zr support. It was demonstrated that the Ti–Zr support greatly promoted the catalytic performance of Mn-based catalysts.
1. Introduction
According to the BP Statistical Review of World Energy June 2017, oil and coal remain the world's leading fuels, contributing to 61.4% of global energy consumption in 2016. The combustion of fossil fuels produces numerous nitrogen oxides, which has resulted in a series of environmental issues. The technique of selective catalytic reduction (SCR) of NOx with NH3 (NH3-SCR) based on the V2O5–WO3(MoO3)/TiO2 catalyst has played a pivotal role in alleviating these issues since the 1970s.1 Nevertheless, 5.519 megatons of NOx were emitted by coal-fired plants in China in 2015, with the low removal rate of 50.4%.2 Considering the advantages of energy conservation and long service time, low-temperature NH3-SCR is recognized as a promising candidate to optimize this technique and solve some of the critical problems, including the low removal rate and toxicity of vanadium species.Mn-based catalysts, such as MnOx/TiO2,3–7 MnOx–CeO2,8–11 Mn–ZrO2,12 Fe–Mn/TiO2 (ref. 13) and Mn/Ce–ZrO2,14 show a relatively high activity at low temperature.15 Moreover, Mn could improve the performance of V2O5/TiO2 catalyst.16 However, most of previous work placed emphasis on the NO conversion. The overall performance has yet to be improved further, especially related to N2 selectivity and SO2 resistance. The formation of N2O occurs simultaneously during the SCR process over Mn-based catalysts.10 Moreover, the production of N2O goes up sharply along with the reaction temperature. This restricts its operation window and even its industrial application.
Some studies have been made to investigate the mechanism of N2O generation with the aim to improve N2 selectivity. For instance, aggregated MnOx species accelerated the formation of N2O.17 MnOx species supported on Fe–Ti spinel exhibits a good N2 selectivity for the special construction of Fe–Ti spinel.18 N2O formation over MnOx/TiO2 catalysts can be suppressed by doping with transition elements.19 The mechanism of N2O formation is not evident and the method to improve N2 selectivity, or in other words, to inhibit N2O generation, is insufficiently explained. In summary, Mn-based catalysts are potential candidates for low-temperature SCR and further efforts are needed to improve the overall performance. In this study, a MnOx/Ti–Zr catalyst was prepared by co-precipitation and impregnation methods. Compared to the MnOx/Ti and MnOx/Zr catalysts, the MnOx/Ti–Zr catalyst showed a higher NO conversion, N2 selectivity and a wider operation window. In addition, the mechanism of N2O formation was investigated.
2. Experimental
2.1. Catalyst preparation
The Ti–Zr support was synthesized by co-precipitation method using titanium sulfate (Ti(SO4)2, CP) and zirconium nitrate (Zr(NO3)4·5H2O, AP) as precursors and ammonium hydroxide (NH3·H2O, 25 wt%) as precipitator. Specified amounts of titanium sulfate and zirconium nitrate were dissolved in deionized water, and the mixture was added to a 12.5 wt% ammonium hydroxide solution dropwise under vigorous magnetic stirring. The resulting precipitate was filtered under vacuum, washed by deionized water 3 times, dried for 6 h at 90 °C. The obtained support was mainly composed of hydroxides. The molar ratio of Ti/Zr was set as 1![[thin space (1/6-em)]](https://www.rsc.org/images/entities/char_2009.gif) :1. Ti and Zr supports were prepared following the same precipitation method.
:1. Ti and Zr supports were prepared following the same precipitation method.
The Mn/Ti–Zr catalyst was prepared by a wet impregnation method. Manganese nitrate (Mn(NO3)2·4H2O, CP) was dissolved in an appropriate amount of deionized water. Ti–Zr support was added to the solution under magnetic stirring for 30 min and treated by ultrasonic wave for another 30 min. The excess water was evaporated at 70 °C. Finally, the specimen was dried for 6 h at 90 °C and calcined under air for 2 h at 500 °C. The Mn/Ti and Mn/Zr catalysts were prepared following the same procedure. The atomic ratios of Mn/Ti, Mn/Zr and Mn/(Ti + Zr) were set as 3:10.
2.2. Catalytic activity measurements
The catalytic activity measurements of all specimens were carried out in a fixed-bed quartz tube reactor with 0.8 cm internal diameter at atmospheric pressure. The volume of the evaluated catalysts with 60–100 mesh was 0.5 cm3 and the corresponding mass was ∼350 milligram. The components of the simulated flue gas, with a total flow rate of 300 ml min−1 and gas hourly space velocity (GHSV) of 36000 h−1 controlled by mass flow meters, was composed of 600 ppm NO, 600 ppm NH3, 5% O2 and N2 balance. The concentrations of NO, NO2, N2O, and O2 in the outlet flue gas were measured by an infrared gas analyzer paired up with a professional gas conditioner (Madur Photon & PGD-100, Austria). The concentrations of the feed gas were determined before measuring catalytic activity. The reaction temperature was increased from 100 to 340 °C and sampled at an interval of 20 °C. The NO conversion and N2 selectivity were calculated in terms of the following formulas:9,20
where [NO]in, [NO]out, [NO2]out and [N2O]out indicate the inlet and outlet concentration of NO, NO2 and N2O, respectively. All data were collected under the steady state condition.
The reaction rates normalized by the surface area were calculated with the following formula:21
2.3. Catalyst characterization
The powder X-ray diffraction (XRD) patterns of the samples were recorded on a Rigaku Ultima IV diffractometer (Japan) with Cu Kα radiation (λ = 1.5406 Å, 40 kV, 40 mA) by a sampling interval of 0.02 degree. The specific surface area, pore volume and average pore diameter of the prepared catalysts were determined from the nitrogen adsorption–desorption isotherms at liquid nitrogen temperature (77 K) by a Quadrasorb SI automated surface area and pore size analyzer (Quantachrome, USA). The Fourier transform infrared (FT-IR) spectra were recorded at room temperature on a FTIR-8400s Fourier transform infrared spectrophotometer (Shimadzu, Japan). Powder materials mixed with KBr were tableted into small rounds of 0.2–0.3 mm thickness. The contribution of KBr to the sample spectra was reduced by referring and normalizing to the spectrum of KBr.The X-ray photoelectron spectroscopy (XPS) experiments were carried out on an EscaLab 250Xi ThermoFisher Scientific (USA) X-ray photoelectron spectrometer system equipped with a monochromated Al Kα (150 W) as a X-ray source. High resolution scans of binding energies were measured for C 1s, O 1s, Mn 2p, Ti 2p, and Zr 3d with the pass energy of 20 eV and an energy step size of 0.05 eV. The binding energies were modified by referencing to the C 1s binding energy of 284.8 eV. The O 1s and Mn 2p peak were deconvoluted optimally into several sub-bands by the Gaussian–Lorentzian function with the correlation coefficients (r2) above 0.99 referring to the overlapped peak.
3. Results and discussion
3.1. NH3-SCR activity
Fig. 1a shows the NO conversion of different catalysts. NO conversion increased overall with the increasing of temperature over Mn/Ti, Mn/Zr and Mn/Ti–Zr catalysts. The Mn/Ti–Zr catalyst showed the highest NO conversion in the investigated temperature range and the Mn/Zr catalyst showed a relatively lower conversion. Especially, excellent NO conversion of nearly 100% was obtained over both Mn/Ti–Zr and Mn/Ti catalysts in the temperature range of 180 to 280 °C. This result indicates that all of NO were involved in the catalytic reaction at 180 to 280 °C, and there were enough active sites for NO on the Mn/Ti–Zr and Mn/Ti. Fig. 1b presents the normalized reaction rates of different catalysts at 100 to 160 °C. The reaction rates were similar with the reported catalysts.22 Since of the high specific surface area (Table 1), the Mn/Ti–Zr catalyst obtained a low reaction rate. The result could indicate an equilibrium of reaction exists in the SCR reaction at this temperature.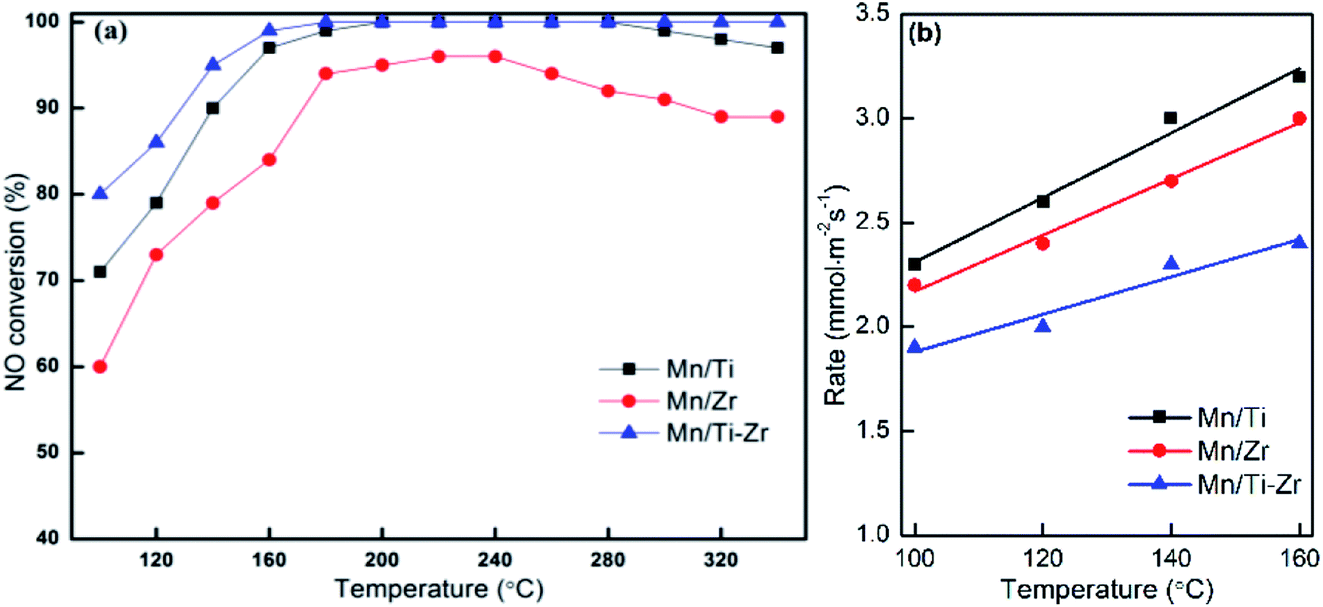 | ||
| Fig. 1 (a) NO conversion and (b) normalized reaction rates for different catalysts. Reaction conditions: [NO] = 600 ppm, [NH3] = 600 ppm, [O2] = 5%, N2 balance and GHSV = 36000 h−1. | ||
| Samples | BET surface area (m2 g−1) | Pore volume (cm3 g−1) | Average pore diameter (nm) | Mole ratio of Mn/(Ti + Zr) |
|---|---|---|---|---|
| Mn/Ti | 114 | 0.33 | 11.6 | 0.3 |
| Mn/Zr | 104 | 0.31 | 7.6 | 0.3 |
| Mn/Ti–Zr | 189 | 0.51 | 8.4 | 0.3 |
In general, Mn-based catalysts show a high activity when the reaction temperature is above 150 °C and however, the N2 selectivity decreases gradually along with the increasing of temperature.23–26 Fig. 2a shows the N2 selectivity results of samples. Overall, the N2 selectivity of the Mn/Ti and Mn/Zr catalysts decreased with the increasing of temperature. The increase in N2 selectivity in the temperature range of 100 °C to 120 °C was attributed to the increasing in NO conversion. However, a high N2 selectivity (nearly 100%) was obtained above 160 °C for the Mn/Ti–Zr catalyst.
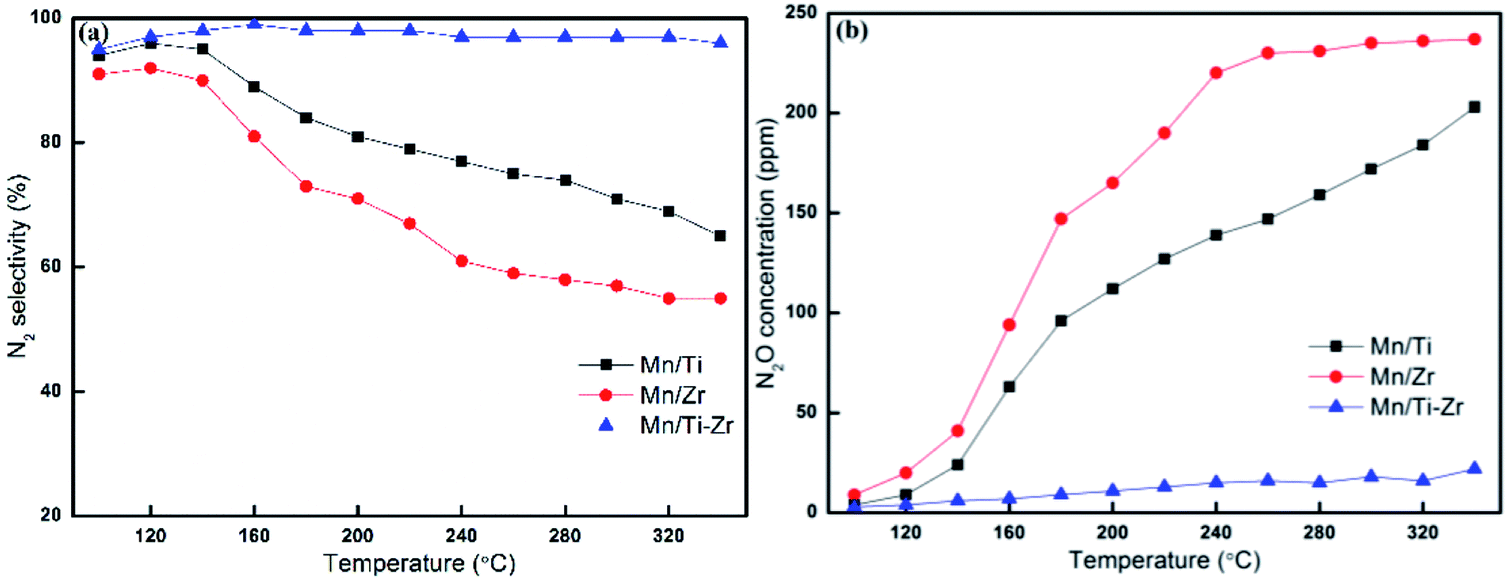 | ||
| Fig. 2 (a) N2 selectivity and (b) outlet concentration of N2O for different catalysts. Reaction conditions: [NO] = 600 ppm, [NH3] = 600 ppm, [O2] = 5%, N2 balance and GHSV = 36000 h−1. | ||
Fig. 2b shows the plot of N2O concentration, which could be a more appropriate parameter to describe the N2 selectivity, as a function of temperature. It can be clearly seen that a small amount of N2O was produced over the Mn/Ti–Zr catalyst. Nevertheless, N2O was generated in large quantities over the Mn/Ti and Mn/Zr catalysts with the maximum of 203 ppm and 237 ppm at 340 °C, respectively. The result manifests that even though NO was involved in the catalytic reaction over Mn/Ti and Mn/Zr, the product was N2O and not N2. As mentioned above, it is a common issue that N2 selectivity decreases with the increasing of temperature for Mn-based catalysts. Referring to the high N2 selectivity of Mn/Ti–Zr catalysts, it can be deduced that the Ti–Zr composite support is in favor of suppressing the generation of N2O and improving the N2 selectivity of Mn-based.
Fig. 3 reveals the durability of H2O and SO2 for different catalyst at 180 °C. The No conversion of all catalysts decreased slightly after the introducing of 3 vol% H2O (Fig. 3a). When 3 vol% H2O was cutting off, the NO conversion returned to the original level gradually. The result agrees with the previous publication that the competitive adsorption of H2O blocks the active sites. As shown in Fig. 3b, the NO conversion decreased sharply after 50 ppm SO2 was introduced at 180 °C. Moreover, when 50 ppm SO2 was removed, the catalytic activities cannot recover to the original level. The irreversible deactivation indicates that the deactivation by SO2 is ascribed to the sulfation of active sites and deposition of ammonium sulfates.15
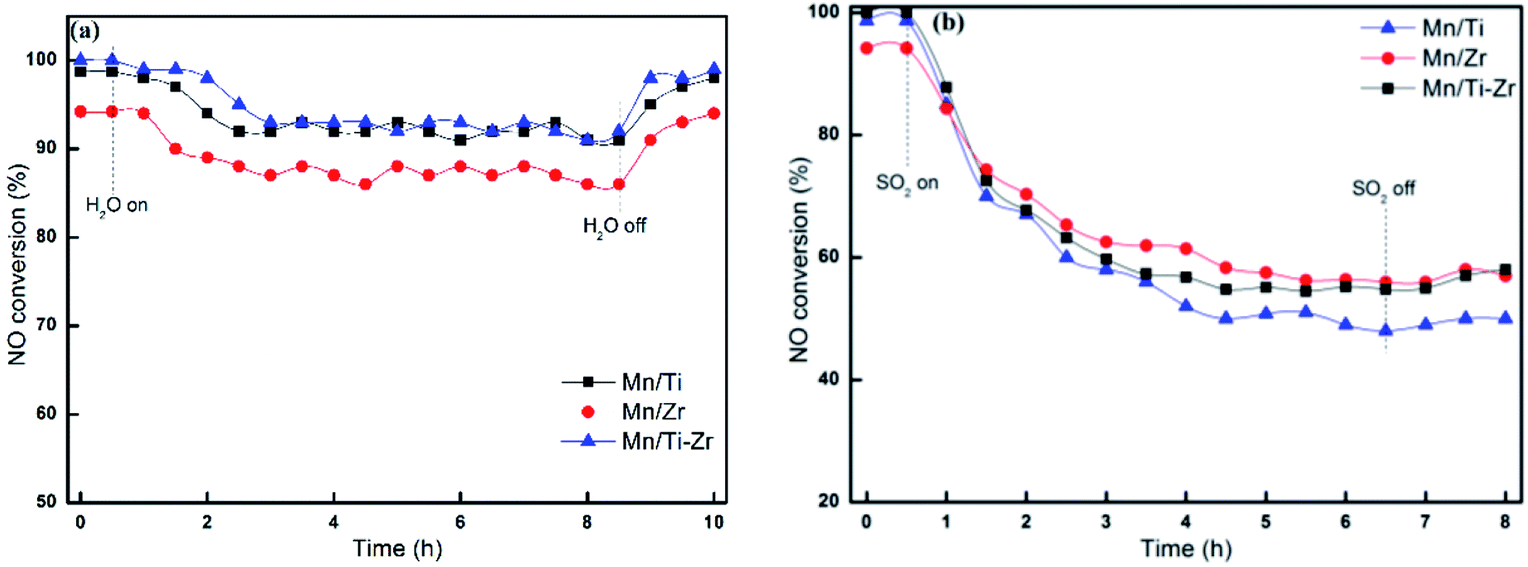 | ||
| Fig. 3 NO conversion for different catalysts in the presence of (a) 3 vol% H2O or (b) 50 ppm SO2 at 180 °C. Reaction conditions: [NO] = 600 ppm, [NH3] = 600 ppm, [O2] = 5%, N2 balance and GHSV = 36000 h−1. | ||
3.2. NH3 and NO oxidation
In order to investigate the origin of N2O and the catalytic oxidation activity of NH3 and NO, separate NH3 and NO oxidation experiments were carried out over Mn/Ti, Mn/Zr and Mn/Ti–Zr catalysts. The comparative experiments were conducted with an empty quartz tube as blank control group. Fig. 4 presents the results of NH3 and NO oxidation. As shown in Fig. 4a, only small quantities of N2O were detected over the Mn/Ti–Zr catalyst, which was nearly the same result as that achieved for the blank control group. The result indicated that the Mn/Ti–Zr catalyst could hardly catalyze NH3 to N2O. The Mn/Zr catalyst showed the best catalytic oxidation activity of NH3 to N2O, following with the Mn/Ti catalyst. These results agreed with the N2 selectivity results shown in Fig. 2. Furthermore, there was a downtrend of N2O generation over the Mn/Ti, Mn/Zr and Mn/Ti–Zr catalysts at 260, 220, and 300 °C, respectively. Referring to Fig. 2b, a different trend was observed with the results depicted in Fig. 4a. As shown in Fig. 2b, the concentration of N2O increased with the increase in temperature from 100 °C to 340 °C. Therefore, it can be concluded that the direct oxidation of NH3 is just one of the origins of N2O.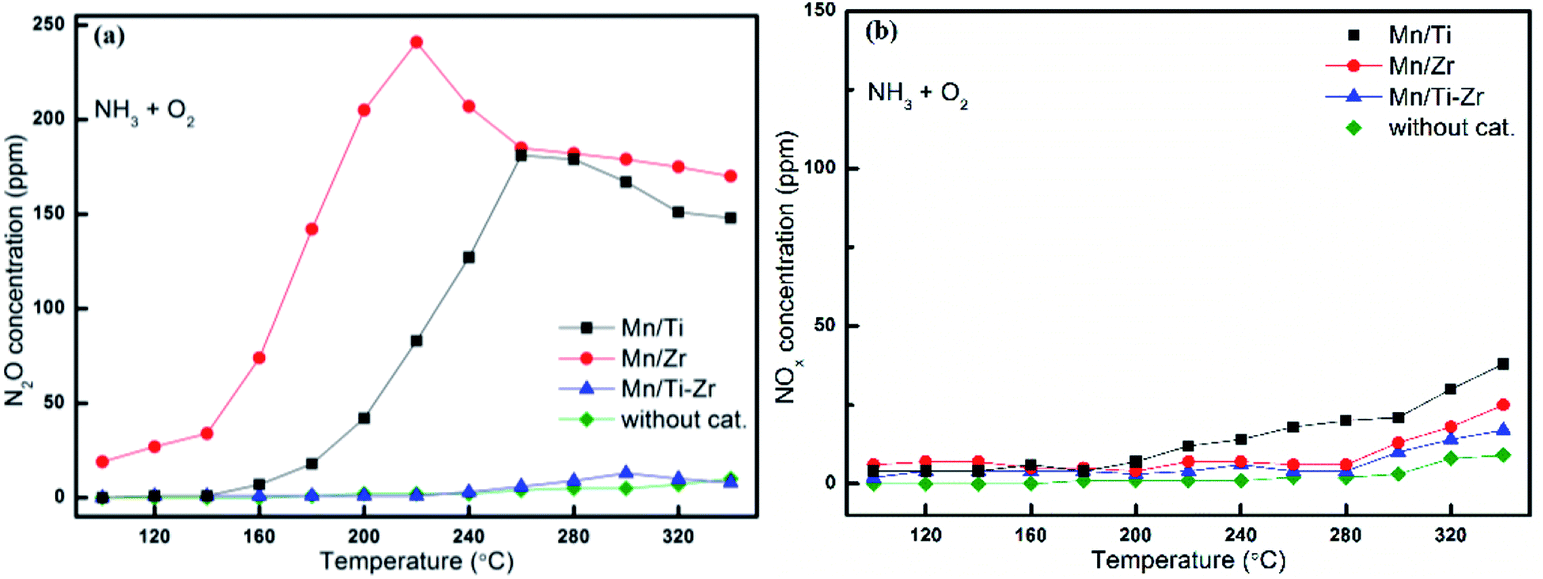 | ||
| Fig. 4 Oxidation of NH3 to (a) N2O and (b) NOx (x = 1, 2) over different catalysts. Reaction conditions: [NH3] = 600 ppm, [O2] = 5%, N2 balance and GHSV = 36000 h−1. | ||
As shown in Fig. 4b, the concentrations of NOx (x = 1, 2) originated from NH3 oxidation were far below the concentrations of N2O formed from NH3 oxidation, but increased slowly with the increasing temperature. NO could be oxidized to NO2 under oxygen atmosphere with a reaction equilibrium as shown in following equation:
| 2NO + O2 → 2NO2 | (1) |
It is well agreed that the SCR process could be accelerated by the generation of NO2 through the so-called Fast SCR process.22,27 Fig. 5a shows the outlet concentrations of NO2 originated from NO oxidation for different catalysts, which represents the property of NO oxidation to NO2 as a function of temperature. It was observed that the concentrations of NO2 increased with the increasing temperature apparently.
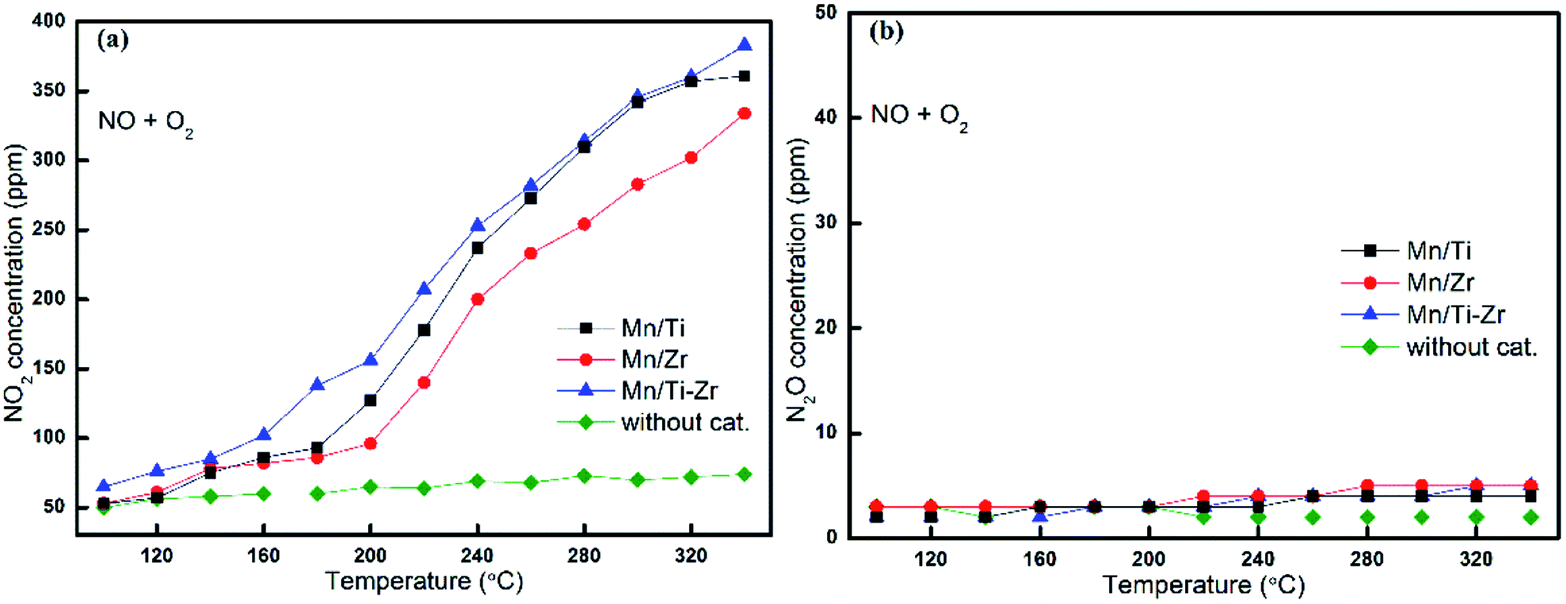 | ||
| Fig. 5 Formation of (a) NO2 and (b) N2O by the reaction of NO with O2 over different catalysts. Reaction conditions: [NO] = 600 ppm, [O2] = 5%, N2 balance and GHSV = 36000 h−1. | ||
The Mn/Ti–Zr catalyst obtained the highest NO2 concentration, followed by Mn/Ti and Mn/Zr in order. Comparing with Fig. 4b, it can be found that the favorable formation of NO2 mainly originated from the oxidation of NO. The results indicate that the Mn/Ti–Zr catalyst presented the best property of NO oxidation to NO2, which likely contributed to the Fast SCR process. Referring to the NO conversion as shown in Fig. 1a, there was a similar trend between NO conversion and NO2 formation. However, contrasting Fig. 1a with 5a, it can be found that the SCR reaction was not dominated by the Fast SCR process. Especially, there was a very low NO2 concentration but a high NO conversion in the temperature range of 100 °C to 160 °C. Thus, it could be deduced that the SCR process was primarily attributed to the Standard SCR. Fig. 5b shows the formation of N2O by a disproportionation reaction in the presence of O2. Hardly any N2O was detected in the outlet.
3.3. XRD and BET analysis
Fig. 6 shows the XRD patterns of all samples. The diffraction peaks at 2θ = 28.7°, 37.4°, 42.8° and 56.7° assigned to the MnO2 species (PDF card No. 81-2261) were detected in all samples, since the atomic ratio of Mn/(Ti + Zr) with 3:10 is a heavy load. It can be speculated that the MnO2 species dispersed over the supports and the redundant MnO2 species was in crystal form. It has been widely reported that MnO2 exhibits excellent activity as compared to other MnOx species.28 The diffraction peaks assigned to anatase TiO2 (PDF card No. 99-0008) and baddeleyite ZrO2 (PDF card No. 86-1449) were detected in the Mn/Ti and Mn/Zr samples, respectively. The results demonstrate that the support of TiO2 and ZrO2 were crystallized by calcined at 500 °C for 2 h.
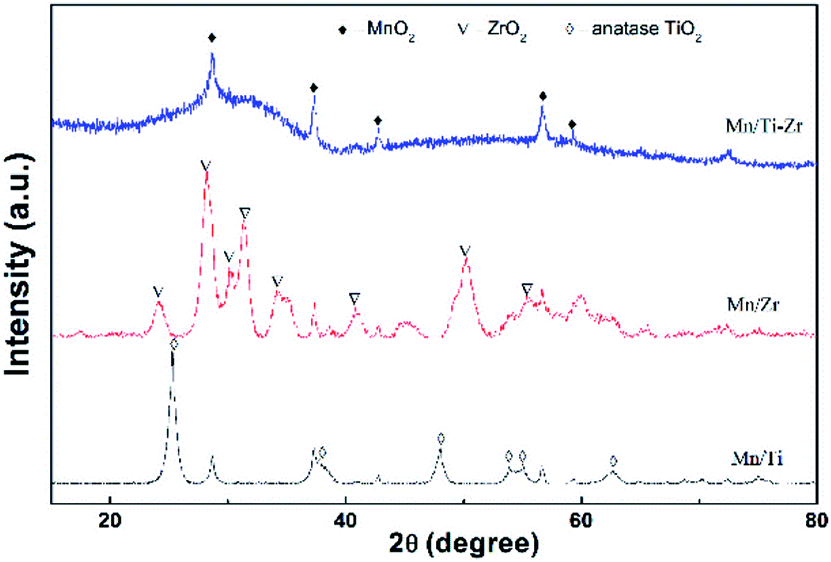 | ||
| Fig. 6 XRD patterns of the Mn/Ti, Mn/Zr and Mn/Ti–Zr catalysts. | ||
However, strong amorphous peaks was detected for Mn/Ti–Zr sample, which was related to the amorphous structure of TiZrO4. The devitrification temperature of TiZrO4 is about 700 °C.29 The amorphous structure support provided a higher surface area and pore volume.30 The combination of titanium and zirconium enhanced the dispersion to some extent. This observation is consistent with the specific surface area and pore volume results (Table 1). In addition, the amorphous oxides could enhance the SCR activity owing to the strong interactions between Ti, Zr and Mn.31,32 In consideration of the catalytic activity, it is a reasonable inference that the support not only provided a sufficient surface area and pore volume, but was also involved in the SCR process.
BET surface area, pore volume and average pore diameter of the samples are given in Table 1. The decreasing order of the surface area and pore volume was Mn/Ti–Zr > Mn/Ti > Mn/Zr. This order was in accordance with that of the NO conversion. It agrees the generic studies that the surface area and pore volume are important to catalytic activity.
3.4. FT-IR analysis
The NH3 molecules adsorbed on the catalysts were analyzed by FT-IR spectroscopy at room temperature to obtain information about the acid sites and the behavior of ammonia on the surface. The prepared catalysts were exposed to the gas mixture of 2% NH3/N2 for 20 min and their FT-IR spectra were obtained (Fig. 7). The peaks at 1064, 1114, 1134 and 1627 cm−1 are assigned to the ammonia coordinated on the Lewis acid sites.33,34 The peaks at 1064 and 1627 cm−1 were observed for all samples and were stronger in the case of the Mn/Ti–Zr catalyst as compared to the Mn/Ti and Mn/Zr samples. A strong peak at 1134 cm−1 was observed for Mn/Ti–Zr and the weak peak at 1114 cm−1 was detected for Mn/Ti and Mn/Zr. It can be found that the peaks assigned to ammonia coordinated on the Lewis acid sites for Mn/Ti–Zr and Mn/Ti are stronger than that for Mn/Zr. In terms of the results, it can be deduced that the combination of Mn and Ti could promote formation of the Lewis acid sites. The peaks at around 1401 and 1460 cm−1 are assigned to the NH4+ of on the Brønsted acid sites.9,14 The peaks at 1344 and 1542 cm−1 detected for the Mn/Ti and Mn/Zr are related to the NH3 adsorbed on Brønsted acid sites.19,35 In addition, the peaks at 2363 and 2333 cm−1 are assigned to the anti-symmetric stretching vibration of CO2, which was adsorbed from the air.36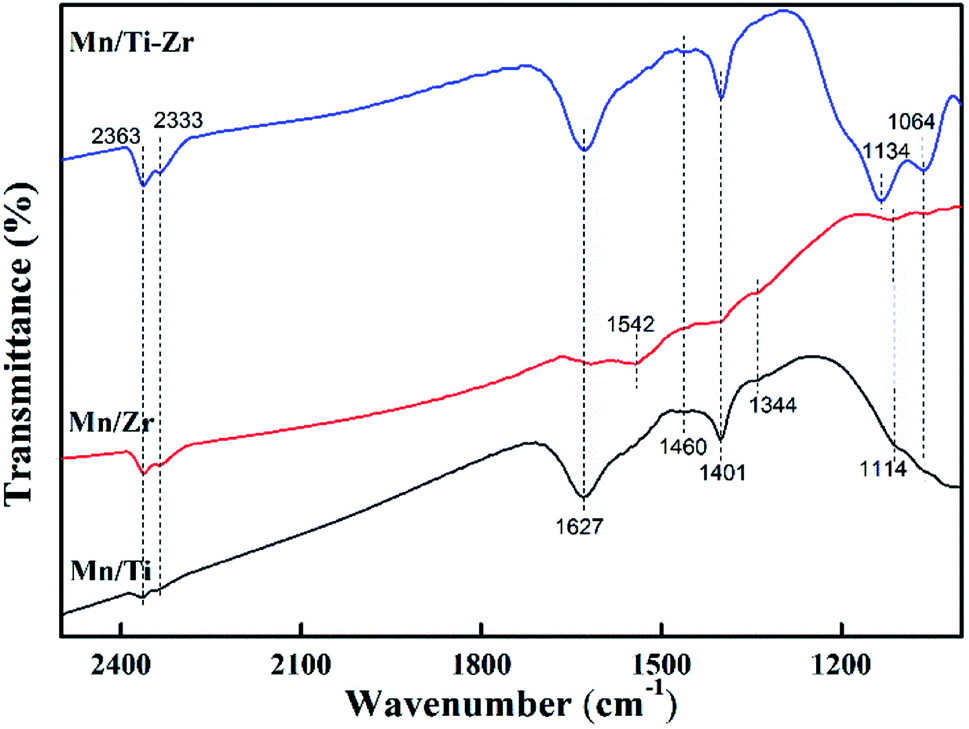 | ||
| Fig. 7 FT-IR spectra of the Mn/Ti, Mn/Zr and Mn/Ti–Zr catalysts. | ||
The results indicate that the Mn/Ti–Zr catalyst possesses more Lewis acid sites. The Mn/Ti catalyst showed strong peaks corresponding to Lewis acid sites and the Brønsted acid sites. Referring to the observed band of Mn/Zr, it is worth noting that peak at 1542 cm−1 was of a strong intensity, which indicated a high proportion of Brønsted acid sites on the Mn/Zr catalyst surface. It has been previously reported that Lewis acid sites are beneficial to NO conversion, which agreed with the result of activity measurements.37 Besides, the Brønsted acid sites are advantage for the adsorption of NH3.38 In fact, although gaseous NH3 could be adsorbed on both Lewis acid sites and Brønsted acid sites during the SCR process, it was the Lewis acid sites that mainly exerted a positive effect.
3.5. XPS analysis
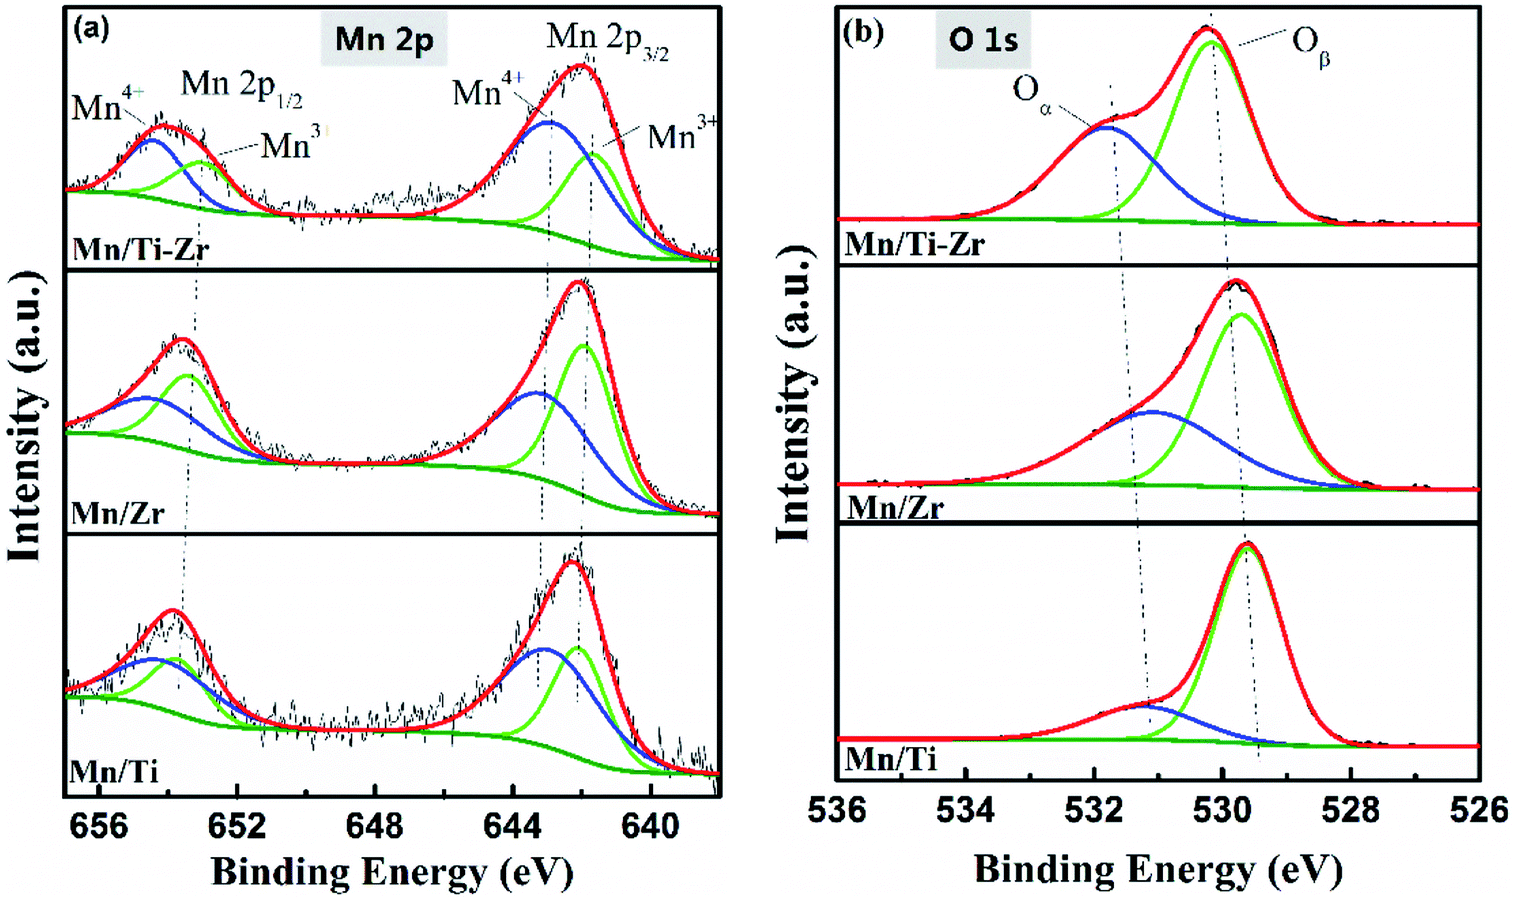
X-ray photoelectron spectroscopy was carried out to get insight into the oxidation states and atomic concentrations of the surface layer of the catalysts. As listed in Table 2, the main element on the surface was oxygen with percentage concentrations of 66.81, 70.39, and 71.33 for the Mn/Ti, Mn/Zr and Mn/Ti–Zr, respectively. Moreover, the Mn/Zr catalyst obtained the highest concentration of surface Mn element (4.54%), which were 3.81% and 3.48% in the case of Mn/Ti–Zr and Mn–Ti, respectively.| Sample | Surface element concentration (%) | Molar ratios | ||||
|---|---|---|---|---|---|---|
| Mn | O | Ti | Zr | Mn4+/(Mn4+ + Mn3+) | Oα/(Oα + Oβ) | |
| Mn/Ti | 3.48 | 66.81 | 29.72 | — | 0.62 | 0.21 |
| Mn/Zr | 4.54 | 70.39 | — | 25.06 | 0.49 | 0.42 |
| Mn/Ti–Zr | 3.81 | 71.33 | 11.07 | 13.8 | 0.67 | 0.40 |
The high-resolution XPS spectra of Mn 2p and O 1s are shown in Fig. 8. Fig. 8a shows the high-resolution XPS spectra of Mn 2p (Mn 2p1/2 and Mn 2p3/2), which could be deconvoluted into two sets of double-peaks characterized Mn3+ and Mn4+ located in the ranges of 641.6–642.2 eV and 643.8–643.9 eV, repectively.21,39 The peaks assigned to Mn4+ were found at 642.9, 643.1, and 642.8 eV for the Mn/Ti, Mn/Zr and Mn/Ti–Zr catalysts, respectively. There was a shift to lower binding energy of Mn4+ over the Mn/Ti–Zr catalyst for the interaction between the manganese oxide and the support. It is reported that a lower binding energy indicates a more active state. This manifests the Mn4+ on the Mn/Ti–Zr promoting the catalytic reaction.40–42 Table 2 presents the mole ratios of Mn4+/(Mn4+ + Mn3+). The Mn/Ti–Zr catalyst provided a highest ratio of Mn4+ species, followed by that of the Mn/Ti and Mn/Zr catalysts in descending order. The high ratio of Mn4+ may be attributed to the Ti component of the support. Referring to the FT-IR results, it was found that Mn/Zr–Ti and Mn/Ti samples have more Lewis acid sites and high ratios of Mn4+ simultaneously. Therefore, it is a reasonable speculation that the Mn4+ provides more Lewis acid sites.
 | ||
| Fig. 8 High resolution XPS spectra of (a) Mn 2p and (b) O 1s of Mn/Ti, Mn/Zr and Mn/Ti–Zr. | ||
As is well known, high concentration of surface Mn4+ is conducive to the catalytic oxidation ability and enhances the NH3-SCR activity.34 This result is in accordance with the catalytic activity, as shown in Fig. 1a. The superior NO conversion of the Mn/Ti–Zr and Mn/Ti catalysts could be attributed to the high concentration of Mn4+. Mn species have an intimate interaction between Mn and Ti–Zr, which allows more electronic transfer between Mn, Ti and Zr.43,44
The O 1s XPS spectra were deconvoluted into two sub-bands as shown in Fig. 8b. The higher binding energy of 531.0–531.8 eV are assigned to chemisorbed oxygen (defect-oxygen of O22−/O− and hydroxyl-like group of OH−) and the lower binding energy of 529.6–530.2 eV are assigned to surface lattice oxygen (O2−), donated as Oα and Oβ, respectively.45,46 The Oα/(Oα + Oβ) ratios are given in Table 2. The Mn/Ti catalyst obtained the lowest Oα ratio and, on the contrary, showed a high ratio of Oβ, which could be attributed to the high crystallization of MnO2 and anatase TiO2. These results were consistent with those obtained from the XRD profiles, and the previous articles that stated that Oβ was mainly derived from Ti–O of anatase TiO2 and Oα originated from the OH− bonded with the metal cations of Mn, Ti, and Zr on the surface.47 The relative concentration ratio of Oα of Mn/Zr and Mn/Ti–Zr was twice that of the Mn/Ti. It was speculated that the Zr component of the support enhanced the formation of chemisorbed labile oxygen, which demonstrated a higher activity than lattice oxygen for the superior mobility. This facilitated the oxidation of NO to NO2 and consequently, increased the NH3-SCR performance.48,49 Moreover, there is a shift to higher binding energies for Mn/Ti–Zr samples, which could be ascribed to the interaction between the manganese oxide and Ti–Zr support.
3.6. Mechanism discussion
Based on the above analysis, a mechanism of NH3-SCR process and N2O formation were proposed to address the main reaction. It is widely reported that NO is mainly abated in two ways as follows:50,51| 4NH3 + 4NO + O2 → 4N2 + 6H2O | (2) |
| 4NH3 + 2NO + 2NO2 → 4N2 + 6H2O | (3) |
As mentioned in Subsection 3.2, the generation of NO2 is dominated by reaction (1) and, however, the concentration of NO2 is very low in the temperature range of 100 °C to 160 °C (Fig. 5a). Thus, the NO reduction is dominated by reaction (2) and not reaction (3) in the temperature range of 100 °C to 160 °C. In fact, the Gibbs free energy for reaction (2) (ΔG0298 = −1651 kJ mol−1) is far below that of reaction (1) (ΔG0298 = −70 kJ mol−1).15 In addition, reaction (3) is limited by reaction (1). Therefore, it can be concluded that the reduction of NO was dominated by reaction (2) in the investigated temperature range.
On the basis of above analysis, the Mn/Ti–Zr catalyst showed the excellent NO conversion should be ascribed to the high concentration of Mn4+ and an intimated interaction between Mn and Ti–Zr, which allows more electronic transfer between Mn, Ti and Zr. A redox mechanism of NO reduction via the Eley–Rideal mechanism over the Mn/Ti–Zr catalyst is proposed (Fig. 9). Ti4+ and Zr4+ can restore the Mn3+ to Mn4+. The intimate interaction facilitates the electronic transfer and accelerates the circulation of Mn4+ and Mn3+ redox couple, which promotes the NH3-SCR process.
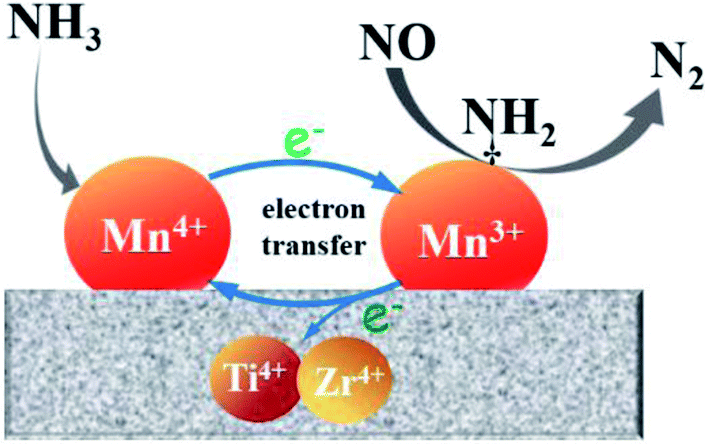 | ||
| Fig. 9 Schematic illustration of the redox cycle and NO reduction over the Mn/Ti–Zr catalyst. | ||
N2O can be generated by several approaches, including the disproportionation reaction of NO, NH3 oxidation and the reaction of NOx with NH3. The low N2O formation to should be ascribed to the synergistic effect between Mn species and Ti–Zr support as shown in Fig. 9. The disproportionation reaction of NO can be described as the following reaction:52,53
| 3NO → N2O + NO2 | (4) |
Referring to Fig. 5b, almost no N2O was generated by the disproportionation reaction of NO in the presence of O2. The result indicates that reaction (4) can barely happen when oxygen is fed into the flue gas.
In the presence of O2, NH3 oxidation leads to the undesired ammonia loss and decreases the N2 selectivity of the NH3-SCR process. The following reactions describe the NH3 oxidation process.54–56
| 4NH3 + 3O2 → 2N2 + 6H2O | (5) |
| 4NH3 + 4O2 → 2N2O + 6H2O | (6) |
| 4NH3 + 5O2 → 4NO + 6H2O | (7) |
| 4NH3 + 7O2 → 4NO2 + 6H2O | (8) |
Referring to Fig. 4, it is evident that NH3 oxidation is dominated by reaction (6), and the reaction (7) and (8) occurred difficultly in the SCR process. The Mn/Ti–Zr catalyst exhibited a low catalytic oxidation activity of NH3 to N2O, which also explains the high N2 selectivity. Analysing the total N atoms, reaction (5) should exist in the process. As mentioned in Subsection 3.2, it is evident by comparing Fig. 2b and 4a that the concentration of N2O increased in the NH3-SCR process, while the concentration of N2O generated by reaction (6) decreased at high temperature. It can be concluded that the NH3 oxidation is just one of the origin of N2O. Referring to the previous studies, more N2O could be originated by the following reactions:19,56,57
| 4NH3 + 4NO + 3O2 → 4N2O + 6H2O | (9) |
| 4NH3 + 4NO2 + O2 → 4N2O + 6H2O | (10) |
Similar to the Fast SCR, reaction (10) is limited by the generation of NO2 and is not the main reaction for N2O formation. In conclusion, both reaction (6) and (9) could generated N2O but reaction (9) dominated the generation of N2O. It is reported that N2O is mainly generated from reaction (9) via the Eley–Rideal mechanism and not the Langmuir–Hinshelwood mechanism.13,53 In addition, the Langmuir–Hinshelwood mechanism is suppressed at high temperature and the Eley–Rideal mechanism dominates the NH3-SCR process subsequently.58 In a similar manner, N2O formation is enhanced via the Eley–Rideal mechanism at high temperature. This is consistent with the results shown in Fig. 2b. Based on the analysis above, a mechanism of N2O formation is proposed as follows:37
| NH3(ad) + Mn4+ = O → NH2(ad) + Mn3+–OH | (11) |
| NH2(ad) + Mn4+ = O → NH(ad) + Mn3+–OH | (12) |
| NH(ad) + NO(g) + Mn4+ = O → N2O(g) + Mn3+–OH | (13) |
4. Conclusion
Mn/Ti–Zr, Mn/Zr and Mn/Ti catalysts, prepared by a wet impregnation method, showed good NO conversion in the NH3-SCR in a wide temperature range. The Mn/Ti–Zr catalyst showed a high N2 selectivity and suppressed the oxidation of NH3 to N2O. The formation of N2O was primarily dominated by the reaction of NO with NH3 in the presence of O2 via the Eley–Rideal mechanism. The Mn/Ti–Zr catalyst possessed more special surface area, Lewis acid sites and Mn4+ on catalyst's surface, which synergistically enhanced the catalytic activity and N2 selectivity. It was also found that the Ti–Zr support greatly promoted the performance of Mn-based catalysts in the NH3-SCR, especially the N2 selectivity. There was an intimate synergistic effect between the Mn species and the Ti–Zr support. In order to improve the catalytic performance, further research is required with a focus on not only the active component but also the support. Moreover, more researches will be done to clarify the reaction mechanism and the synergistic effect further.Conflicts of interest
There are no conflicts to declare.Acknowledgements
This work is sponsored by National Natural Science Foundation of China (Grants U1360202, 51672024, 51472030 and 51502014) and Fundamental Research Funds for the Central Universities (2302017FRF-IC-17-005 and 2302017FRF-BR-17-005A). The authors would like to thank the editor for editing of the manuscript and the anonymous reviewers for their detailed and helpful comments.References
- M. Radojevic, Environ. Pollut., 1998, 102, 685–689 CrossRef CAS.
- M.o.E.P.o.t.P.s.R.o. China, Annual Statistic Report on Environment in China, 2015, Ministry of Environmental Protection of the People's Republic of China, Beijing, 2017 Search PubMed.
- R. Guo, M. Li, P. Sun, S. Liu, S. Wang, W. Pan, S. Liu, J. Liu and X. Sun, RSC Adv., 2017, 7, 19912–19923 RSC.
- B. Li, S. Xiong, Y. Liao, X. Xiao, N. Huang, Y. Geng, S. Zou and S. Yang, J. Phys. Chem. C, 2016, 120, 23511–23522 CAS.
- E. Park, M. Kim, H. Jung, S. Chin and J. Jurng, ACS Catal., 2013, 3, 1518–1525 CrossRef CAS.
- X. Wang, X. Li, Q. Zhao, W. Sun, M. Tade and S. Liu, Chem. Eng. J., 2016, 288, 216–222 CrossRef CAS.
- D. K. Pappas, T. Boningari, P. Boolchand and P. G. Smirniotis, J. Catal., 2016, 334, 1–13 CrossRef CAS.
- D. Yan, Y. Yu, X. Huang, S. Liu and Y. Liu, J. Fuel Chem. Technol., 2016, 44, 232–238 CrossRef CAS.
- X. Xiao, Z. Sheng, L. Yang and F. Dong, Catal. Sci. Technol., 2016, 6, 1507–1514 CAS.
- Z. Liu, Y. Yi, S. Zhang, T. Zhu, J. Zhu and J. Wang, Catal. Today, 2013, 216, 76–81 CrossRef CAS.
- G. Qi, R. T. Yang and R. Chang, Appl. Catal., B, 2004, 51, 93–106 CrossRef CAS.
- Z. Liu, Y. Liu, Y. Li, H. Su and L. Ma, Chem. Eng. J., 2016, 283, 1044–1050 CrossRef CAS.
- B. Jiang, B. Deng, Z. Zhang, Z. Wu, X. Tang, S. Yao and H. Lu, J. Phys. Chem. C, 2014, 118, 14866–14875 CAS.
- B. Shen, X. Zhang, H. Ma, Y. Yao and T. Liu, J. Environ. Sci., 2013, 25, 791–800 CrossRef CAS.
- S. Zhang, B. Zhang, B. Liu and S. Sun, RSC Adv., 2017, 7, 26226–26242 RSC.
- Z. Liu, Y. Li, T. Zhu, H. Su and J. Zhu, Ind. Eng. Chem. Res., 2014, 53, 12964–12970 CrossRef CAS.
- W. S. Kijlstra, E. K. Poels, A. Bliek, B. M. Weckhuysen and R. A. Schoonheydt, J. Phys. Chem. B, 1997, 101, 309–316 CrossRef CAS.
- S. Yang, F. Qi, S. Xiong, H. Dang, Y. Liao, P. K. Wong and J. Li, Appl. Catal., B, 2016, 181, 570–580 CrossRef CAS.
- Y. Niu, T. Shang, S. Hui, X. Zhang, Y. Lei, Y. Lv and S. Wang, Fuel, 2016, 185, 316–322 CrossRef CAS.
- Y. Xiong, C. Tang, X. Yao, L. Zhang, L. Li, X. Wang, Y. Deng, F. Gao and L. Dong, Appl. Catal., A, 2015, 495, 206–216 CrossRef CAS.
- L. J. France, Q. Yang, W. Li, Z. Chen, J. Guang, D. Guo, L. Wang and X. Li, Appl. Catal., B, 2017, 206, 203–215 CrossRef CAS.
- L. Huang, K. Zha, S. Namuangruk, A. Junkaew, X. Zhao, H. Li, L. Shi and D. Zhang, Catal. Sci. Technol., 2016, 6, 8516–8524 CAS.
- R. Guo, Q. Wang, W. Pan, W. Zhen, Q. Chen, H. Ding, N. Yang and C. Lu, Appl. Surf. Sci., 2014, 317, 111–116 CrossRef CAS.
- Y. Shi, S. Chen, H. Sun, Y. Shu and X. Quan, Catal. Commun., 2013, 42, 10–13 CrossRef CAS.
- X. Lu, C. Song, S. Jia, Z. Tong, X. Tang and Y. Teng, Chem. Eng. J., 2015, 260, 776–784 CrossRef CAS.
- Z. Liu, J. Zhu, J. Li, L. Ma and S. I. Woo, ACS Appl. Mater. Interfaces, 2014, 6, 14500–14508 CAS.
- B. Opitz, M. Bendrich, A. Drochner, H. Vogel, R. E. Hayes, J. F. Forbes and M. Votsmeier, Chem. Eng. J., 2015, 264, 936–944 CrossRef CAS.
- F. Kapteijn, L. Singoredjo, A. Andreini and J. A. Moulijn, Appl. Catal., B, 1994, 3, 173–189 CrossRef CAS.
- H. Wei, X. Yan, X. Li, S. He and C. Sun, J. Hazard. Mater., 2013, 244–245, 478–488 CrossRef CAS PubMed.
- T. Boningari, P. R. Ettireddy, A. Somogyvari, Y. Liu, A. Vorontsov, C. A. McDonald and P. G. Smirniotis, J. Catal., 2015, 325, 145–155 CrossRef CAS.
- J. Liu, X. Li, Q. Zhao, J. Ke, H. Xiao, X. Lv, S. Liu, M. Tadé and S. Wang, Appl. Catal., B, 2017, 200, 297–308 CrossRef CAS.
- P. Li, Y. Xin, Q. Li, Z. Wang, Z. Zhang and L. Zheng, Environ. Sci. Technol., 2012, 46, 9600–9605 CrossRef CAS PubMed.
- X. Li, J. Li, Y. Peng, H. Chang, T. Zhang, S. Zhao, W. Si and J. Hao, Appl. Catal., B, 2016, 184, 246–257 CrossRef CAS.
- B. Thirupathi and P. G. Smirniotis, J. Catal., 2012, 288, 74–83 CrossRef CAS.
- B. Thirupathi and P. G. Smirniotis, Appl. Catal., B, 2011, 110, 195–206 CrossRef CAS.
- M. Kantcheva, M. Milanova and S. Mametsheripov, Catal. Today, 2012, 191, 12–19 CrossRef CAS.
- S. Yang, S. Xiong, Y. Liao, X. Xiao, F. Qi, Y. Peng, Y. Fu, W. Shan and J. Li, Environ. Sci. Technol., 2014, 48, 10354–10362 CrossRef CAS PubMed.
- M. S. Maqbool, A. K. Pullur and H. P. Ha, Appl. Catal., B, 2014, 152–153, 28–37 CrossRef CAS.
- M. Stanciulescu, G. Caravaggio, A. Dobri, J. Moir, R. Burich, J. P. Charland and P. Bulsink, Appl. Catal., B, 2012, 123–124, 229–240 CrossRef CAS.
- S. Boxiong, Y. Yan, C. Jianhong and Z. Xiaopeng, Microporous Mesoporous Mater., 2013, 180, 262–269 CrossRef.
- N. Fang, J. Guo, S. Shu, H. Luo, Y. Chu and J. Li, Chem. Eng. J., 2017, 325, 114–123 CrossRef CAS.
- B. Shen, F. Wang and T. Liu, Powder Technol., 2014, 253, 152–157 CrossRef CAS.
- P. R. Ettireddy, N. Ettireddy, S. Mamedov, P. Boolchand and P. G. Smirniotis, Appl. Catal., B, 2007, 76, 123–134 CrossRef CAS.
- L. Huang, X. Hu, S. Yuan, H. Li, T. Yan, L. Shi and D. Zhang, Appl. Catal., B, 2017, 203, 778–788 CrossRef CAS.
- C. Gao, J. Shi, Z. Fan, Y. Yu, J. Chen, Z. Li and C. Niu, Fuel Process. Technol., 2017, 167, 322–333 CrossRef CAS.
- J. Zuo, Z. Chen, F. Wang, Y. Yu, L. Wang and X. Li, Ind. Eng. Chem. Res., 2014, 53, 2647–2655 CrossRef CAS.
- Z. Zhang, L. Chen, Z. Li, P. Li, F. Yuan, X. Niu and Y. Zhu, Catal. Sci. Technol., 2016, 6, 7151–7162 CAS.
- J. Fan, P. Ning, Z. Song, X. Liu, L. Wang, J. Wang, H. Wang, K. Long and Q. Zhang, Chem. Eng. J., 2018, 334, 855–863 CrossRef CAS.
- H. Chen, Y. Xia, H. Huang, Y. Gan, X. Tao, C. Liang, J. Luo, R. Fang, J. Zhang, W. Zhang and X. Liu, Chem. Eng. J., 2017, 330, 1195–1202 CrossRef CAS.
- H. Chang, X. Chen, J. Li, L. Ma, C. Wang, C. Liu, J. W. Schwank and J. Hao, Environ. Sci. Technol., 2013, 47, 5294–5301 CrossRef CAS PubMed.
- M. Stanciulescu, P. Bulsink, G. Caravaggio, L. Nossova and R. Burich, Appl. Surf. Sci., 2014, 300, 201–207 CrossRef CAS.
- S. Boxiong, M. Hongqing, H. Chuan and Z. Xiaopeng, Fuel Process. Technol., 2014, 119, 121–129 CrossRef.
- X. Tang, J. Li, L. Sun and J. Hao, Appl. Catal., B, 2010, 99, 156–162 CrossRef CAS.
- M. H. Kim and S. W. Park, Catal. Commun., 2016, 86, 82–85 CrossRef CAS.
- D. Pietrogiacomi, A. Magliano, P. Ciambelli, D. Sannino, M. C. Campa and V. Indovina, Appl. Catal., B, 2009, 89, 33–40 CrossRef CAS.
- Y. You, H. Chang, T. Zhu, T. Zhang, X. Li and J. Li, Mol. Catal., 2017, 439, 15–24 CrossRef CAS.
- D. Zhang and R. T. Yang, Appl. Catal., A, 2017, 543, 247–256 CrossRef CAS.
- S. Yang, C. Wang, J. Li, N. Yan, L. Ma and H. Chang, Appl. Catal., B, 2011, 110, 71–80 CrossRef CAS.
| This journal is © The Royal Society of Chemistry 2018 |