 Open Access Article
Novel perovskite-based composites, La1−xNdxFeO3@activated carbon, as efficient catalysts for the degradation of organic pollutants by heterogeneous electro-Fenton reactions
Qijun Wangab,
Shu Zhoua,
Song Xiaoa,
Feifei Weia,
Xuezhu Zhaoa,
Jun’e Quac and
Hairen Wang *ac
*ac
aSchool of Materials Science and Engineering, Hubei University, Wuhan, 430062, P. R. China. E-mail: whr9999whr@163.com
bSchool of Chemistry & Chemical Engineering, Huazhong University of Science & Technology, Wuhan 430074, P. R. China
cMinistry-of-Education Key Laboratory of Green Preparation and Application for Functional Materials, School of Materials Science and Engineering, Hubei University, Wuhan, 430062, P. R. China
First published on 18th April 2018
Abstract
Perovskites, which have excellent electrocatalytic properties, are promising for use in heterogeneous catalysis. However, the design and development of green and effective electrocatalysts for environmental water treatment remains an arduous challenge. To overcome such difficulties, we present a facile sol–gel method for the design and preparation of a series of perovskite-activated carbon (AC) composites (La1−xNdxFeO3@AC) for the degradation of methyl orange (MO) by heterogeneous electro-Fenton reactions. Furthermore, the as-made La0.6Nd0.4FeO3@AC composite anode had the strongest oxidation ability and stability, with MO wastewater and COD removal rates reaching 99.81% and 96.66% within 10 minutes, respectively. As far as we know, the La1−xNdxFeO3@AC composites can be regarded as a series of the most effective catalysts for the degradation of MO to date.
1. Introduction
Perovskite materials have fascinated scientists because of their exceptional physical and chemical properties, such as high temperature stability, high oxygen mobility and high stability of the cation oxidation state.1–3 As one of the most common perovskite-like oxides and a promising material with an abundance of functionalities, lanthanum ortho-ferrite (LaFeO3) has been widely applied in areas like environmental decontamination,4 multi-ferroic materials,5 gas sensors,6 solid oxide fuel cells7 and photocatalysts.8 Moreover, LaFeO3 can produce free radicals in the presence of hydrogen peroxide (H2O2), such as hydroxyl radicals (˙OH), and so can achieve efficient oxidation degradation of organic pollutants.9,10From the composition of perovskite oxide ABO3, it has been found that the type of A site has great influence on the lattice parameters, cell volume and binding energy (BE) of ABO3.11 In addition, when lanthanide ortho-ferrite (LnFeO3) is used as a gas sensor material, replacing the ion at the Ln site with other cations will effectively improve the sensing properties of LnFeO3 as its gas sensitive properties are closely related to the BE of the Ln–O bond.12 The BE between a metal and oxygen, ΔH(M–O), is usually estimated using the formula below:12
| ΔH(M–O) = (Hf − mHs − nD0/2)/(CNm) | (1) |
Here, Hf is the amount of material, MmOn is the formation energy of the oxide, HS is the sublimation energy of the metal, D0 is the dissociation energy for O2 and CN is the coordination number for the metal. The BE of the Ln–O bond is typically less than the absolute value of ΔH(M–O), leading to the easy disruption of the Ln–O bond. Therefore, the smaller the BE of the Ln–O bond, the more oxygen will be generated by the dissociation process, and the accelerated oxidation process will improve the gas sensing properties of LnFeO3.12,13 Significantly, the influence of the introduction of rare earth metals (REM) has been reported to authenticate that REM can enhance textural/structural properties, increase the oxygen storage/release capacity (OSC) and can improve the redox behavior of a ceria–zirconia solid solution.14,15 Interestingly, as one of the REM family, neodymium (Nd) shows its appeal in interatomic interactions. The BEs of Nd–O and La–O bonds are about −136 kJ mol−1 and −142 kJ mol−1, respectively.13 Since the absolute value of the BE of Nd–O is less than that of La–O, it indicates that Nd–O is much easier to dissociate than La–O. We suppose that when La is replaced by Nd, theoretically, the chemisorption of oxygen on the surface of LaFeO3, along with the rate of the oxidation reaction, will increase.
In terms of electrochemistry during the past few decades, electrochemical advanced oxidation processes (EAOPs) have drawn scientists’ interest in the reclamation of water contaminated with non-biodegradable organics16–18 because of the capability of EAOPs in generating strong oxidizing radicals that can completely oxidize organic pollutants into CO2, H2O and inorganic ions. Electro-Fenton (EF) is the most ubiquitous of these EAOPs, in which the weak oxidant H2O2 is continuously generated and supplied to an acidic contaminated solution from the two-electron cathodic reduction of O2 gas, which proceeds as follows:19
| O2 + 2H+ + 2e− → H2O2 | (2) |
Then, it can be catalytically converted into highly powerful hydroxyl radicals in the presence of an iron catalyst (e.g. Fe2+ or iron oxides):20
| H2O2 + Fe2+ → Fe3+ + ˙OH + OH− | (3) |
However, the classical EF process has some critical limitations, like the need to operate at pH = 2.0 or 3.0 for an optimum run and the precipitation of soluble iron species used as a catalyst.17,37 These imperfections could be overcome using an Fe-containing solid catalyst as the source of Fe2+ ions instead of soluble iron salt. Hence, it was practically significant to develop a solid heterogeneous catalyst with high activity and stability to deactivation and to metal leaching.
In addition, activated carbon (AC) is a well-known material which is widely used as an admirable adsorbent and supporting material, due to its excellent properties in mechanical strength and porosity.21
Therefore, taking into consideration the aforementioned inconveniences of the electro-Fenton system, a strategy is proposed here to prepare a heterogeneous catalyst containing both perovskite oxide and activated carbon (AC). In this study, we prepared La1−xNdxFeO3@AC composites via a facile sol–gel method. Organic pollutants in wastewater have had a great negative impact on ecological environments, and the latest research has all been devoted to the degradation of organic pollutants.22,23 Methyl orange (MO), a typical azo dye in textile wastewater, was used as the target pollutant, because azo dye-rich textile wastewater is resistant to conventional biological treatment due to the stability and toxicity of the dye. As an important part of our research system, methyl orange degradation experiments, along with gas chromatography-mass spectrometry (GC-MS) analysis, have been completed precisely to evaluate the electrochemical activities of the La1−xNdxFeO3@AC composites.
2. Experimental section
2.1. Materials preparation
All of the chemicals used in this study were of analytical grade and used as received, without further purification. Methyl Orange (MO) (Sinopharm Chemical Reagent Co., Ltd.), which is widely used in the textile industry and as a biological stain, was regarded as the target pollutant. Sodium sulphate (99%, anhydrous) was the supporting electrolyte and iron (III) nitrate nonahydrate (97%, AR), lanthanum nitrate hydrate (99.9%, AR), neodymium nitrate hexahydrate (99.0%, AR) were used as catalysts. Citric acid (99.5%) was obtained from Tianjin Bodi Chemical Co., Ltd and used as received. Deionized water, obtained with a Milli-Q water purification system (Millipore, France), was used for the preparation of solutions.2.2. Modification of activated carbon and preparation of La1−xNdxFeO3@AC catalysts
2.3. Electrochemical system
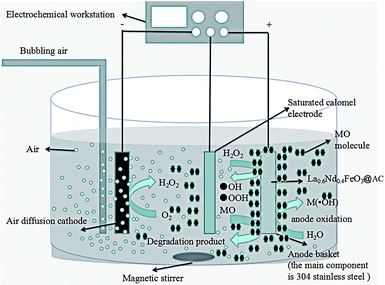
A cylindrical glass cell (0.5 L and a diameter of 5 cm) was used to carry out the electrochemical experiments. A PAN air diffusion cathode (3 cm × 5 cm) was fitted on the inner side of the cell. An anode basket made from a stainless steel wire mesh full of the LaFeO3@AC catalyst was centered into the cell. The electrolysis solution was prepared by adding sodium sulphate into methyl orange solution. The pH of the solution was set to 2.0 using sulfuric acid solution (1 mol L−1) and a pH meter. After that, the solution was transferred to the electrochemical cell and stirred (500 rpm) with a magnetic stirrer. The oxygen demand of the system was provided by air bubbling with a compressed air system. The current was controlled with an electrochemical workstation.Liquid samples were withdrawn periodically for UV-vis spectro-photometer analysis and chemical oxygen demand (COD) measurements. Before each analysis, sample aliquots withdrawn from treated solutions were filtered with 0.45 μm PTFE filters.
All of the investigations were carried out in triplicate to avoid any discrepancy in experimental results and averages were reported. The removal efficiency of phenol could be calculated using the following equation:
| Removal (%) = [C0 − Ct]/C0 × 100% | (4) |
2.4. Composite La1−xNdxFeO3/AC characterization and analytical method
The specific surface areas of the binding catalysts were determined by the nitrogen adsorption method (automated gas adsorption apparatus, Micromeritics Inc. ASAP 2020 HD88), performed at −196 °C. Before the gas adsorption measurement, all of the samples were degassed at 250 °C in a vacuum (10−3 torr) for 12 h. Surface areas and the micropore volume of samples were determined using the Brunauer–Emmett–Teller (BET) and Dubinin–Radushkevich (D–R) equations.The pH at the point of zero charge (pHPZC) was determined by mixing 0.05 g of each sample with 20 mL of 0.01 mol L−1 NaCl aqua-solution, with pH values adjusted between 2.0 and 11.0 by adding 0.1 mol L−1 HCl or 0.1 mol L−1 NaOH aqua-solution. The final pH was measured after 48 h of shaking at room temperature. Blank experiments (without the addition of carbon) were also performed for each pH and the values measured after 48 h are considered as the initial pH, in order to avoid the variation of pH caused by the effect of CO2 present in the headspace. The pHPZC value of each carbon sample was determined by intercepting the obtained final pH vs. initial pH curve with the straight line final pH = initial pH.24
The phases of the binding catalysts were identified by means of X-ray diffraction (XRD), using a Rigaku D/max-IIIC under Cu Kα radiation (λ = 1.5418 Å), at a scanning range of 2 theta (2θ) = 10–80° and under a speed of 4° per minute. The average crystallite size of the catalysts was estimated using the Debye–Scherrer equation:
 | (5) |
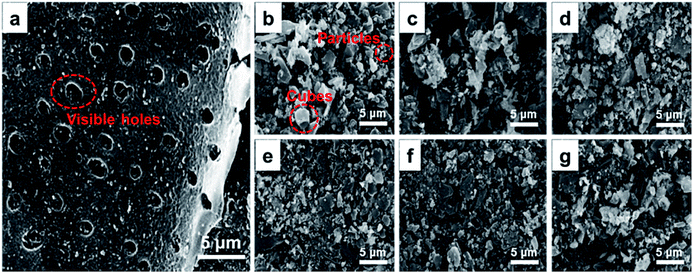
The morphology and size distribution of the metal oxides as well as the elemental analyses of the binding catalysts were examined using a scanning electron microscope (SEM-JEOL JSM6510LV) equipped with energy dispersive spectrometry (EDS).
X-ray photoelectron spectra (XPS) were recorded at room temperature on a Thermo Fisher Scientific 250Xi analyzer with a magnesium anode under Kα (hν = 1486.6 eV) radiation. Gas chromatography-mass spectrometry analysis was carried out using an Agilent 6890 GC/5975MSD GC-MS analyzer.
3. Results and discussion
3.1. Characterization of the composite La1−xNdxFeO3@AC
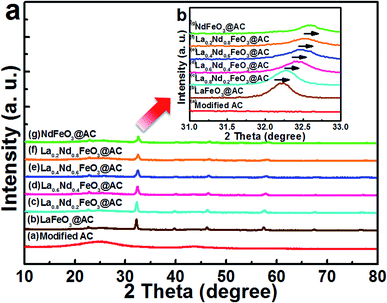 | ||
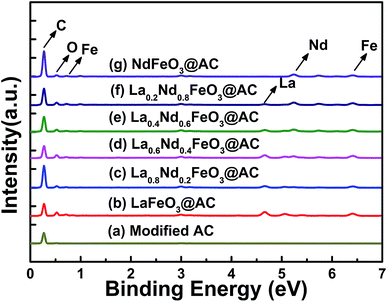
| Fig. 1 XRD energy spectra of (a) modified AC; (b) LaFeO3@AC; (c) La0.8Nd0.2FeO3@AC; (d) La0.6Nd0.4FeO3@AC; (e) La0.4Nd0.6FeO3@AC; (f) La0.2Nd0.8FeO3@AC; (g) NdFeO3@AC. | ||
As is shown in Fig. 1b (after the magnification of 2θ between 31–33° in Fig. 1a), with an enhanced ratio of Nd in La1−xNdxFeO3@AC, the diffraction peak at 2θ = 32.18° continues to drift to the right, along with the continuous change for the lattice of La1−xNdxFeO3. By Bragg’s law,26 2d![[thin space (1/6-em)]](https://www.rsc.org/images/entities/char_2009.gif) sin
sin![[thin space (1/6-em)]](https://www.rsc.org/images/entities/char_2009.gif) θ = nλ, an increase in the diffraction angle θ will lead to a decrease in the crystal interplanar spacing d, which simply means that the cell of La1−xNdxFeO3@AC has a tendency to shrink gradually with an increase in the doping ratio of Nd. When x = 1.0, the diffraction peaks which appear at 22.96°, 25.64°, 32.31°, 40.37°, 46.50°, 53.33°, 58.54°, 68.33° and 77.79° (Fig. 1a) correspond to the characteristic diffraction peak of orthorhombic NdFeO3 (JCPDS#25-1149).27 No characteristic peaks of La2O3, Nd2O3 and Fe2O3 were detected, indicating that the metal nitrates have been completely decomposed to form single phase La1−xNdxFeO3 composite oxides. Furthermore, as shown in Table 1, the cell volume (V) and the average grain size tended to be smaller with increases in the proportion of Nd in La1−xNdxFeO3@AC, because the radius of Nd3+ (0.983) is slightly smaller than that of La3+ (0.114).28 Therefore, the cell volume of NdFeO3@AC is the smallest one (233.0093 Å3) in this series of La1−xNdxFeO3@AC composites.
θ = nλ, an increase in the diffraction angle θ will lead to a decrease in the crystal interplanar spacing d, which simply means that the cell of La1−xNdxFeO3@AC has a tendency to shrink gradually with an increase in the doping ratio of Nd. When x = 1.0, the diffraction peaks which appear at 22.96°, 25.64°, 32.31°, 40.37°, 46.50°, 53.33°, 58.54°, 68.33° and 77.79° (Fig. 1a) correspond to the characteristic diffraction peak of orthorhombic NdFeO3 (JCPDS#25-1149).27 No characteristic peaks of La2O3, Nd2O3 and Fe2O3 were detected, indicating that the metal nitrates have been completely decomposed to form single phase La1−xNdxFeO3 composite oxides. Furthermore, as shown in Table 1, the cell volume (V) and the average grain size tended to be smaller with increases in the proportion of Nd in La1−xNdxFeO3@AC, because the radius of Nd3+ (0.983) is slightly smaller than that of La3+ (0.114).28 Therefore, the cell volume of NdFeO3@AC is the smallest one (233.0093 Å3) in this series of La1−xNdxFeO3@AC composites.
| Samples | a (Å) | b (Å) | c (Å) | V (Å3) | α = β = γ (°) | Average grain size (nm) | pHPZC |
|---|---|---|---|---|---|---|---|
| Modified AC | — | — | — | — | — | — | 2.82 |
| LaFeO3@AC | 5.9237 | 5.7267 | 7.1342 | 242.0153 | 90 | 309 | 6.56 |
| La0.8Nd0.2FeO3@AC | 5.6241 | 5.5751 | 7.6785 | 240.7594 | 90 | 251 | 6.63 |
| La0.6Nd0.4FeO3@AC | 5.5295 | 5.7329 | 7.5548 | 239.4875 | 90 | 207 | 6.90 |
| La0.4Nd0.6FeO3@AC | 5.5216 | 5.5280 | 7.7742 | 237.2951 | 90 | 189 | 7.20 |
| La0.2Nd0.8FeO3@AC | 5.8160 | 5.6117 | 7.2449 | 236.4567 | 90 | 185 | 7.36 |
| NdFeO3@AC | 5.3326 | 5.5479 | 7.8760 | 233.0093 | 90 | 210 | 7.58 |
![[thin space (1/6-em)]](https://www.rsc.org/images/entities/char_2009.gif) :
:![[thin space (1/6-em)]](https://www.rsc.org/images/entities/char_2009.gif) Fe
Fe![[thin space (1/6-em)]](https://www.rsc.org/images/entities/char_2009.gif) :
:![[thin space (1/6-em)]](https://www.rsc.org/images/entities/char_2009.gif) O is 1
O is 1![[thin space (1/6-em)]](https://www.rsc.org/images/entities/char_2009.gif) :
:![[thin space (1/6-em)]](https://www.rsc.org/images/entities/char_2009.gif) 1
1![[thin space (1/6-em)]](https://www.rsc.org/images/entities/char_2009.gif) :
:![[thin space (1/6-em)]](https://www.rsc.org/images/entities/char_2009.gif) 3, which is much closer to that of the theoretical value.
3, which is much closer to that of the theoretical value.
| Sample | C | O | La | Nd | Fe | |||||
|---|---|---|---|---|---|---|---|---|---|---|
| Wt% | At% | Wt% | At% | Wt% | At% | Wt% | At% | Wt% | At% | |
| Modified AC | 92.81 | 94.50 | 7.19 | 5.50 | — | — | — | — | — | — |
| LaFeO3@AC | 51.15 | 79.85 | 10.81 | 12.67 | 26.36 | 3.56 | — | — | 11.68 | 3.92 |
| La0.8Nd0.2FeO3@AC | 71.82 | 90.68 | 6.12 | 5.80 | 10.74 | 1.17 | 4.37 | 0.46 | 6.69 | 1.89 |
| La0.6Nd0.4FeO3@AC | 50.36 | 81.56 | 8.66 | 10.53 | 17.15 | 2.40 | 13.08 | 1.76 | 10.75 | 3.74 |
| La0.4Nd0.6FeO3@AC | 58.85 | 86.88 | 6.50 | 7.20 | 9.73 | 1.24 | 16.61 | 2.04 | 8.31 | 2.64 |
| La0.2Nd0.8FeO3@AC | 60.17 | 86.19 | 7.73 | 8.31 | 4.00 | 0.50 | 19.33 | 2.31 | 8.76 | 2.70 |
| NdFeO3@AC | 73.03 | 91.94 | 5.08 | 4.80 | — | — | 16.07 | 1.68 | 5.83 | 1.58 |
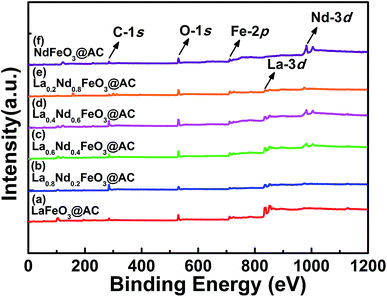 | ||
| Fig. 4 Survey XPS spectrum of perovskite catalysts: (a) LaFeO3@AC; (b) La0.8Nd0.2FeO3@AC; (c) La0.6Nd0.4FeO3@AC; (d) La0.4Nd0.6FeO3@AC; (e) La0.2Nd0.8FeO3@AC; (f) NdFeO3@AC. | ||
As shown in Fig. 5, after the O-1s XPS peak deconvolution of La1−xNdxFeO3@AC, two peaks can be clearly observed at 529.37–529.64 eV and 531.30–531.47 eV. The former corresponds to lattice oxygen in perovskite oxides (Oα) and the latter belongs to chemically adsorbed oxygen (Oβ).29 The binding energy peaks of chemisorbed H2O between 532.86–533.07 eV did not appear in Fig. 4a–f, or the peak intensity was quite weak, which coincided with the O-1s XPS energy spectrum of LaBO3 (B![[double bond, length as m-dash]](https://www.rsc.org/images/entities/char_e001.gif) Cu, Fe, Mn, Co, Ni) reported in the literature.8 As can be seen from Table 3, according to the ratio of peak intensity between Oα and Oβ, the relative amounts of Oβ in LaFeO3@AC, La0.8Nd0.2FeO3@AC, La0.6Nd0.4FeO3@AC, La0.4Nd0.6FeO3@AC, La0.2Nd0.8FeO3@AC and NdFeO3@AC (denoted as Oβ/(Oα + Oβ)) are 24.39%, 48.19%, 64.40%, 57.80%, 40.38% and 39.12%, respectively. Furthermore, the analysis of the XPS peak splitting could be seen to show that the addition of neodymium may induce the formation of ferrous ions, due to the presence of ferrous ions in lanthanum ferrite and oxygen vacancies (or oxygen defects) can be produced while the chemisorbed oxygen content is proportional to the oxygen defect concentration.30 Therefore, the addition of neodymium greatly increases the catalytic activity of lanthanum ferrite.
Cu, Fe, Mn, Co, Ni) reported in the literature.8 As can be seen from Table 3, according to the ratio of peak intensity between Oα and Oβ, the relative amounts of Oβ in LaFeO3@AC, La0.8Nd0.2FeO3@AC, La0.6Nd0.4FeO3@AC, La0.4Nd0.6FeO3@AC, La0.2Nd0.8FeO3@AC and NdFeO3@AC (denoted as Oβ/(Oα + Oβ)) are 24.39%, 48.19%, 64.40%, 57.80%, 40.38% and 39.12%, respectively. Furthermore, the analysis of the XPS peak splitting could be seen to show that the addition of neodymium may induce the formation of ferrous ions, due to the presence of ferrous ions in lanthanum ferrite and oxygen vacancies (or oxygen defects) can be produced while the chemisorbed oxygen content is proportional to the oxygen defect concentration.30 Therefore, the addition of neodymium greatly increases the catalytic activity of lanthanum ferrite.
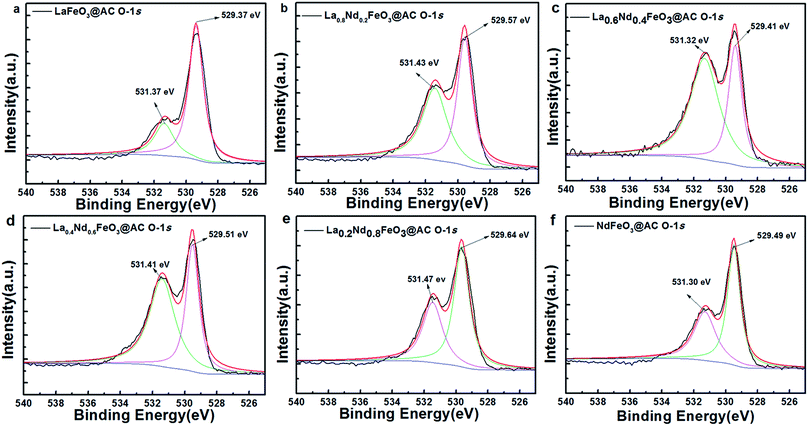 | ||
| Fig. 5 O-1s XPS patterns of the perovskite catalysts: (a) LaFeO3@AC; (b) La0.8Nd0.2FeO3@AC; (c) La0.6Nd0.4FeO3@AC; (d) La0.4Nd0.6FeO3@AC; (e) La0.2Nd0.8FeO3@AC; (f) NdFeO3@AC. | ||
| Sample | Binding energy (eV) | Oβ/(Oα + Oβ), % | |
|---|---|---|---|
| Oα | Oβ | ||
| LaFeO3@AC | 529.37 | 531.37 | 24.39 |
| La0.8Nd0.2FeO3@AC | 529.57 | 531.43 | 48.19 |
| La0.6Nd0.4FeO3@AC | 529.41 | 531.32 | 64.40 |
| La0.4Nd0.6FeO3@AC | 529.51 | 531.41 | 57.80 |
| La0.2Nd0.8FeO3@AC | 529.64 | 531.47 | 40.38 |
| NdFeO3@AC | 529.49 | 531.30 | 39.12 |
To gain an in-depth understanding of the stability and metal leaching of the composite anodes, we further performed an extra XPS contrast measurement of the La0.6Nd0.4FeO3@AC composite anode before and after the electrocatalytic oxidation process (Fig. 6).
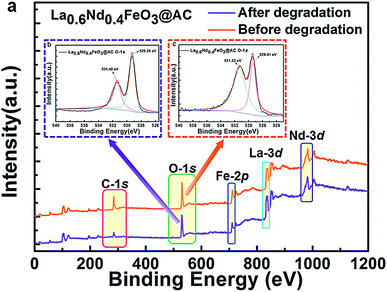 | ||
| Fig. 6 Survey XPS spectrum and O-1s XPS patterns of the La0.6Nd0.4FeO3@AC composite anode, before and after the electrocatalytic oxidation process. | ||
As can be seen from Fig. 6a, the survey XPS spectrum of the used La0.6Nd0.4FeO3@AC composite anode (before and after electrocatalytic oxidation) showed the same characteristic peaks of C-1s, O-1s, Fe-2p, La-3d and Nd-3d. Moreover, Fig. 6b and c show that after O-1s XPS peak deconvolution, four peaks can be clearly observed at 529.29–529.41 eV (lattice oxygen in perovskite oxides) and 531.32–531.40 eV (chemically adsorbed oxygen). This same peak intensity and binding energy clearly indicates that the La0.6Nd0.4FeO3@AC composite anode is of perfect stability during the electrocatalytic oxidation process. Particularly, after electrocatalytic oxidation the characteristic peaks of Fe-2p are the same as the original, which can further demonstrate that the interference of the leaching of iron species is negligible.
3.2. Adsorption and electrochemical catalytic oxidation performance of the modified AC and La1−xNdxFeO3@AC composite electrodes
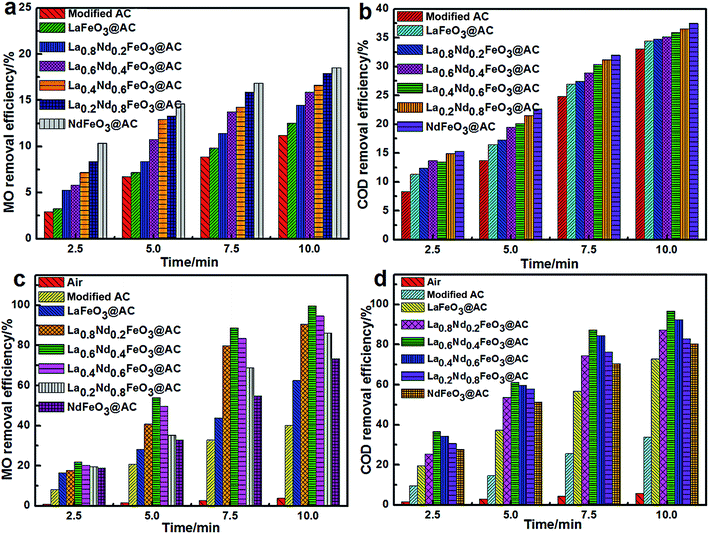
Under conditions without input current, the pH of MO wastewater was adjusted to 2.0 using dilute H2SO4 solution, the physical adsorption (Fig. 7a and b) along with electrocatalytic degradation (Fig. 7c and d) performance of the composite anodes was investigated according to the method described above in the experimental section and the removal rates of MO and COD in wastewater were taken as the research index.As can be seen from Fig. 7a, using modified AC, LaFeO3@AC, La0.8Nd0.2FeO3@AC, La0.6Nd0.4FeO3@AC, La0.4Nd0.6FeO3@AC, La0.2Nd0.8FeO3@AC and NdFeO3@AC composite electrodes to perform physical adsorption for 10 minutes, the removal rate of MO can reach 11.21%, 12.52%, 14.48%, 15.87%, 16.63%, 17.94% and 18.53%, respectively. Moreover, as shown in Fig. 7b, under the same physical adsorption time, the COD removal rates of these composite electrodes are 33.05%, 34.46%, 34.78%, 35.17%, 35.86%, 36.53% and 37.49%, respectively. The above results show that modified AC, LaFeO3@AC, La0.8Nd0.2FeO3@AC, La0.6Nd0.4FeO3@AC, La0.4Nd0.6FeO3@AC, La0.2Nd0.8FeO3@AC and NdFeO3@AC composite electrodes have a gradually increasing trend in the physical adsorption of MO. In addition, the abilities of the different composite electrodes in the Fe–C primary cell process to remove organic pollutants are very similar to each other,31 which suggests that the primary cause of differences in MO adsorption capacity between the composite electrodes is the different internal adsorption capacities of AC.
The pHPZC of modified AC, LaFeO3@AC, La0.8Nd0.2FeO3@AC, La0.6Nd0.4FeO3@AC, La0.4Nd0.6FeO3@AC, La0.2Nd0.8FeO3@AC and NdFeO3@AC is 2.82, 6.56, 6.63, 6.90, 7.20, 7.36 and 7.58 respectively (Table 1). According to the theory of pHPZC, if pH < pHPZC (in solution), the surface of the AC will have positive charge.25 However, when the pH in MO wastewater is 2.0, the surface positive charge in these composite materials can arrange in order and increase gradually, while the positive charge in anionic C14H14N3O3S− in MO gradually increases.32 Therefore, a larger pHPZC value can lead to more La1−xNdxFeO3@AC molecules being adsorbed on MO, along with a higher removal rate of MO and COD.
Under the conditions of pH = 2.0 in MO wastewater and an electrolyte concentration of Na2SO4 of 7 g L−1, the composite electrodes were prepared and the electrocatalytic oxidation test along with the direct aeration oxidation experiment were carried out. The results are shown in Fig. 7c and d.
Fig. 7c and d show that the removal rates of MO and COD in 10 min were 3.77% and 5.71% when the reaction system was only treated by aeration, which indicates that the air in the MO wastewater oxidation degradation capacity is quite limited.
Furthermore, the removal rates of MO and COD are greatly improved when using the composite electrodes, such as modified AC and La1−xNdxFeO3@AC. The modified AC composite electrode is much weaker than the La1−xNdxFeO3–AC series of composite electrodes in the resolution reaction of H2O2. The electrolytic current density is 400 mA dm−2, and the removal rates of MO and COD in 10 minutes can only reach 40.15% and 33.88%, respectively.
Significantly, the ratio of Nd in La1−xNdxFeO3–AC has a great influence on the performance of the composite electrode. When the electrolysis current density is at 400 mA dm−2, in 10 minutes the MO removal rate can reach 62.48%, 90.64%, 99.81%, 94.67%, 86.18% and 73.36% using LaFeO3@AC, La0.8Nd0.2FeO3@AC, La0.6Nd0.4FeO3@AC, La0.4Nd0.6FeO3@AC, La0.2Nd0.8FeO3@AC and NdFeO3@AC composite electrodes. Meanwhile, the removal rates of COD can reach 72.85%, 87.31%, 96.66%, 92.57%, 82.93% and 80.24% in 10 minutes, respectively. In terms of the MO and COD removal rates in MO wastewater, the La0.6Nd0.4FeO3@AC composite electrode has the strongest activity, and the removal rates of MO and COD can reach 99.81% and 96.66%, respectively, within 10 minutes. In the absence of surface adsorbed H2O, the highest content of Oβ on the surface of La0.6Nd0.4FeO3@AC is 64.40%, leading to the strongest oxidation capacity.33,34
Additionally, in order to better understand the MO degradation procedure, color removal properties are investigated and the results are shown in Fig. 8.
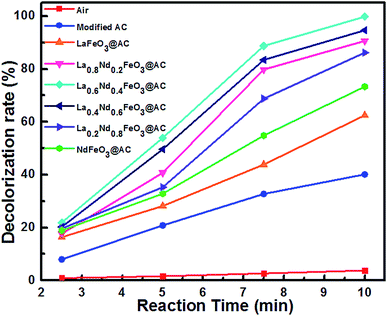 | ||
| Fig. 8 The decolorization rate of MO wastewater using different composite anodes and air during the electrocatalytic process. | ||
It can be clearly seen from Fig. 8 that with the electrocatalysis of La0.6Nd0.4FeO3@AC composite anodes, the decolorization rate of MO can reach 100% within 10 minutes, while the removal rate of COD is as high as 96.66%. These results demonstrate that the chromophore in MO has been basically destroyed, and the organic species are degraded almost completely, which corresponds with the GC-MS analysis.
3.3. Infrared spectrum analysis of MO wastewater before and after reaction
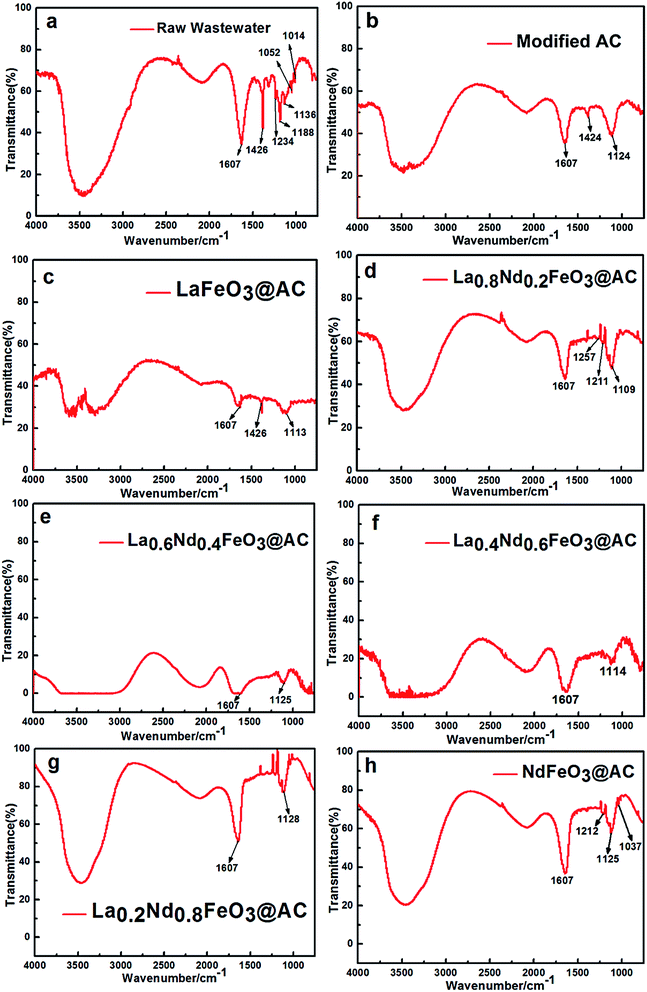
As shown in Fig. 9, the infrared spectra of MO wastewater treated with different composite anodes, such as modified AC and La1−xNdxFeO3@AC (x = 0, 0.2, 0.4, 0.6, 0.8 or 1.0), have been obtained in the range of 4000–750 cm−1.As shown in Fig. 9a, untreated MO wastewater appeared at 1607 cm−1 with a double aromatic ring (benzene ring) stretching vibration peak,35 while in Fig. 9e and f, the transmittance of the stretching vibration peak at 1607 cm−1 is almost close to 0, which indicates that the aromatic ring of the MO molecule has been completely destroyed after the MO wastewater was treated using La0.6Nd0.4FeO3@AC and La0.4Nd0.6FeO3@AC, and the destruction of the aromatic rings in Fig. 9e is more violent than in Fig. 9f.
In Fig. 9f and g, the stretching vibration peaks of aromatic rings can still be observed, indicating that the ability of La1−xNdxFeO3@AC (x = 0, 0.2, 0.8 or 1) and modified AC composite anodes to catalyze the oxidation of MO molecules is less than that of x = 0.4 and 0.6 in La1−xNdxFeO3@AC. As can be seen from Fig. 9b and c, the –N![[double bond, length as m-dash]](https://www.rsc.org/images/entities/char_e001.gif) N– vibration peak of MO can be observed at 1424 and 1426 cm−1 after being treated with a composite anode such as modified AC and LaFeO3@AC.36 However, as shown in Fig. 9d–h, the vibrational peaks of –N
N– vibration peak of MO can be observed at 1424 and 1426 cm−1 after being treated with a composite anode such as modified AC and LaFeO3@AC.36 However, as shown in Fig. 9d–h, the vibrational peaks of –N![[double bond, length as m-dash]](https://www.rsc.org/images/entities/char_e001.gif) N– are already very weak or cannot be observed, and so it can be seen that the composite anodes such as modified AC and LaFeO3@AC have a weaker decoloration ability for MO wastewater than La1−xNdxFeO3@AC (x = 0.2, 0.4, 0.6, 0.8 or 1.0).
N– are already very weak or cannot be observed, and so it can be seen that the composite anodes such as modified AC and LaFeO3@AC have a weaker decoloration ability for MO wastewater than La1−xNdxFeO3@AC (x = 0.2, 0.4, 0.6, 0.8 or 1.0).
When comparing Fig. 9g and h with 9b and c, although the vibrational peaks of –N![[double bond, length as m-dash]](https://www.rsc.org/images/entities/char_e001.gif) N– in Fig. 9g and h have disappeared or are not apparent, the stretching vibration peaks of the aromatic rings in the MO molecule at 1607 cm−1 are still quite strong, which shows that the –N
N– in Fig. 9g and h have disappeared or are not apparent, the stretching vibration peaks of the aromatic rings in the MO molecule at 1607 cm−1 are still quite strong, which shows that the –N![[double bond, length as m-dash]](https://www.rsc.org/images/entities/char_e001.gif) N– bond in MO molecules is more susceptible to destruction than the aromatic ring during the electrochemical oxidation degradation process.
N– bond in MO molecules is more susceptible to destruction than the aromatic ring during the electrochemical oxidation degradation process.
3.4. UV-vis spectrum analysis of MO reaction products degraded by the La0.6Nd0.4FeO3@AC composite electrode
Under the conditions of pH = 2.0 in MO wastewater, an electrolyte concentration of Na2SO4 of 7 g L−1 and an electrolytic current density of 400 mA dm−2, the La0.6Nd0.4FeO3@AC composite electrode was used to catalyze the degradation of MO wastewater. After sampling every 2.5 minutes for each day, the water samples were analyzed to produce a UV ultraviolet visible spectrum and the results are shown in Fig. 10.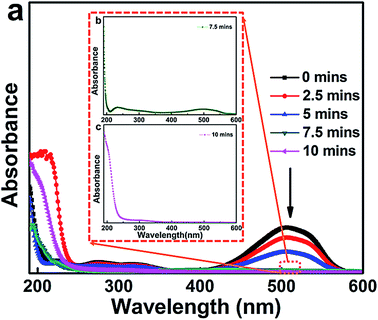 | ||
| Fig. 10 UV-vis spectral changes of the 500 mg L−1 MO solution during the degradation process as a function of reaction time in the presence of 7 g L−1 Na2SO4, I = 400 mA dm−2 and pH = 2.0. | ||
The latest result shows that the maximum absorption wavelength of MO is affected by the initial pH.37 When the initial pH is between 3.1–12.0, the maximum absorption wavelength λmax = 464 nm, and moreover, λmax = 507 nm for pH = 0.0–3.1.
As can be seen from Fig. 10a, when the pH of MO wastewater is 2.0, the maximum absorption wavelength (λmax) position is basically consistent with 507 nm. Moreover, there are two distinct absorption peaks at 270 nm and 507 nm when the reaction time was 0 minutes. The former peak (270 nm) is in the ultraviolet band, which corresponds to π → π* conversion of two adjacent aromatic rings in MO molecules. The latter peak (507 nm) is in the visible light band, which corresponds to the transition from n → π* of the azo bond of the conjugated structure in MO molecules.38 With an increase in reaction time (0–10 minutes), the intensity of the absorption peaks at 270 nm and 507 nm has been obviously weakened. At a reaction time of 7.5 minutes, the peak at 507 nm cannot be observed, and if the UV spectrum of MO wastewater at 7.5 minutes reaction time is magnified (Fig. 10b) only a weak absorption peak can be seen at 507 nm. However, in Fig. 10c, the peak at 507 nm has completely disappeared, and there is no new absorption peak, indicating that at 10 minutes reaction time, the MO in the wastewater has been completely degraded.
3.5. Gas chromatography-mass spectrometry (GC-MS) analysis on the electrocatalytic oxidation degradation of MO
For the purpose of determining the intermediates during the degradation process of methyl orange (MO), GC-MS was performed to study the qualitative composition of the intermediates. 20 mL MO wastewater (after degradation for 10 min) was extracted using dichloromethane (30 mL) for 30 min, then an amount of anhydrous sodium sulfate (Na2SO4) was added for dehydration and condensed to 5 mL by a rotary evaporator to satisfy the sampling conditions. The experimental results are shown in Fig. 11.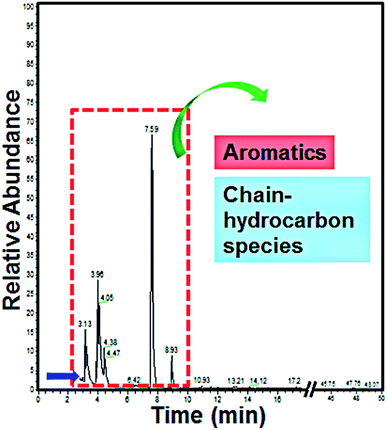 | ||
| Fig. 11 GC-MS spectrum of MO wastewater after degradation by a La0.6Nd0.4FeO3@AC composite anode for 10 min. | ||
As can be seen from Fig. 11, the MO wastewater was degraded into a few intermediates during the degradation process, which indicated that the La0.6Nd0.4FeO3@AC composite anode shows excellent ability for the electrocatalytic degradation of MO. When the time was 3.13, 3.96, 4.05, 4.38, 4.47, 7.59 and 8.93 min, the intermediates are the aromatics and chain hydrocarbon species, which corresponds with the literature.39,40 The results indicate that during the process of MO electrocatalytic degradation by a La0.6Nd0.4FeO3@AC composite anode, the large conjugated system formed by azo bonds and benzene rings in methyl orange molecules was destroyed. During the degradation process, at first, the azo bond will probably fracture to form benzene substances under the effect of the La0.6Nd0.4FeO3@AC composite electrocatalyst. With the electrocatalysis, the benzene ring will be further opened to form chain-like molecules, which are finally degraded to H2O and CO2. These results are consistent with the analysis of UV-vis and FT-IR spectra.
3.6. Mechanism of electrocatalytic oxidation degradation of the La0.6Nd0.4FeO3@AC composite anode
Fig. 12 shows the mechanism of a La0.6Nd0.4FeO3@AC composite anode in the degradation of MO wastewater.The main part is divided into a cathode oxygen reduction, a Fenton oxidation reaction system at the central part of the surface of the anode and the electrocatalytic oxidation of the MO reaction. Significantly, the segmentation process can probably be accounted for by a mechanism as follows:
(I) Cathodic process – reduction of oxygen
| O2(g) + 2H+ + 2e− → H2O2 | (6) |
| O2(g) + 4H+ + 4e− → 2˙O + 4[H] → 2H2O | (7) |
(II) Fenton oxidation reaction in the middle of the reaction system
(1) The iron wire supplied by the anode wire network migrates between the anode and cathode (middle), and the Fenton reaction occurs with the cathode H2O2
| Fe − 2e− → Fe2+ | (8) |
| Fe2+ + H2O2 → Fe3+ + ˙OH + OH− | (9) |
| Fe3+ + H2O2 → Fe2+ + ˙HO2 + H+ | (10) |
(2) Degradation process of MO in the middle of the electrode
| ˙OH + MO → CO2 + H2O | (11) |
| HO2˙ + MO → CO2 + H2O | (12) |
(III) Anode surface: the anode consists of two parts, the outer steel wire mesh anode and the composite catalyst (La0.6Nd0.4FeO3@AC) anode inside the wire mesh. Their electrocatalytic oxidation process is as follows:
(1) Wire mesh near the anode
(i) The Fe2+ provided by the wire mesh reacts with the convective migration of H2O2 to the anode (or the electrochemical reaction of the anode) to produce a Fenton reaction
| Fe − 2e− → Fe2+ | (8) |
| Fe2+ + H2O2 → Fe3+ + ˙OH + OH− | (9) |
| Fe3+ + H2O2 → Fe2+ + ˙HO2 + H+ | (10) |
(ii) The degradation process of MO
| ˙OH + MO → CO2 + H2O | (11) |
| HO2˙ + MO → CO2 + H2O | (12) |
(2) Electrochemical oxidation of H2O on the surface of the La0.6Nd0.4FeO3@AC composite catalyst anode and steel wire mesh
| M + H2O → M(˙OH) + H+ + e− | (13) |
| 2M(˙OH) → 2MO + H2O2 | (14) |
(3) Catalytic oxidation of reactive oxygen species on the anode surface of the composite catalyst (La0.6Nd0.4FeO3@AC). (![[triple bond, length as m-dash]](https://www.rsc.org/images/entities/char_e002.gif) Fe3+–OH means a fixed carrier above the oxide containing Fe3+)
Fe3+–OH means a fixed carrier above the oxide containing Fe3+)
![[triple bond, length as m-dash]](https://www.rsc.org/images/entities/char_e002.gif) Fe3+–OH + H2O2 ↔ Fe3+–OH + H2O2 ↔ ![[triple bond, length as m-dash]](https://www.rsc.org/images/entities/char_e002.gif) FeHO22+ + H+ FeHO22+ + H+
| (15) |
![[triple bond, length as m-dash]](https://www.rsc.org/images/entities/char_e002.gif) Fe3+–OH + H2O ↔ Fe3+–OH + H2O ↔ ![[triple bond, length as m-dash]](https://www.rsc.org/images/entities/char_e002.gif) FeOH2+ + H+ FeOH2+ + H+
| (16) |
![[triple bond, length as m-dash]](https://www.rsc.org/images/entities/char_e002.gif) FeHO22+ → FeHO22+ → ![[triple bond, length as m-dash]](https://www.rsc.org/images/entities/char_e002.gif) Fe2+ + HO2˙ Fe2+ + HO2˙
| (17) |
![[triple bond, length as m-dash]](https://www.rsc.org/images/entities/char_e002.gif) FeHO22+ + FeHO22+ + ![[triple bond, length as m-dash]](https://www.rsc.org/images/entities/char_e002.gif) FeOH2+ → 2 FeOH2+ → 2![[triple bond, length as m-dash]](https://www.rsc.org/images/entities/char_e002.gif) Fe2+ + O2 + H2O Fe2+ + O2 + H2O
| (18) |
![[triple bond, length as m-dash]](https://www.rsc.org/images/entities/char_e002.gif) Fe2+ + H2O2 → Fe2+ + H2O2 → ![[triple bond, length as m-dash]](https://www.rsc.org/images/entities/char_e002.gif) Fe3+–OH + ˙OH + OH− Fe3+–OH + ˙OH + OH−
| (19) |
(4) Physical and electrochemical adsorption processes of MO on the La0.6Nd0.4FeO3@AC anode surface of the composite catalysts
| MO + La0.6Nd0.4FeO3@AC → C6H5OH − La0.6Nd0.4FeO3@AC | (20) |
(5) MO degradation process on the anodic surface
| ˙OH + MO → CO2 + H2O | (11) |
| HO2˙ + MO → CO2 + H2O | (12) |
| M(˙OH) + MO → CO2 + H2O | (21) |
4. Conclusions
In summary, we have prepared a series of perovskite-based composites, La1−xNdxFeO3@AC (x = 0, 0.2, 0.4, 0.6, 0.8 or 1.0), using a facile sol–gel method, and then the La1−xNdxFeO3–AC composite anodes were prepared for the electrochemical degradation of methyl orange (MO). In terms of the oxidative degradation of methyl orange, the La0.6Nd0.4FeO3@AC composite anode has the strongest oxidation ability and stability, with MO wastewater and COD removal rates reaching 99.81% and 96.66% within 10 minutes, respectively. According to ultraviolet spectrum detection, the absorption peak of methyl orange wastewater at 507 nm has disappeared entirely, which indicated that MO has been thoroughly degraded. The results demonstrate that La1−xNdxFeO3@AC is a catalyst of unique significance with efficiency in the application of the treatment of MO. Furthermore, to the best of our knowledge, no research on the electrochemical properties of a La1−xNdxFeO3@AC composite material has been reported. Our studies in this current paper provide a series of novel perovskite–carbon composites, and ingenious methods for the electrochemical treatment of refractory pollutants, which are expected to play more important roles in the treatment of organic pollutant wastewater.Author contributions
Q. J. W., S. Z., and H. R. W. conceived the idea and co-wrote the manuscript. Q. J. W., S. Z., F. F. W. and X. Z. Z. carried out the materials synthesis and the electrochemical catalysis. Q. J. W., S. X., S. Z. and J’e Q. performed the materials characterizations. H. R. W. proposed, planned and supervised the project. All of the authors discussed the results and commented on the manuscript. The manuscript was written through the contributions of all authors. All authors have given approval of the final version of the manuscript. Q. J. W. and S. Z. contributed equally to this work.Conflicts of interest
The authors declare no conflict of interest.Acknowledgements
The authors gratefully acknowledge the financial support of the National Natural Science Foundation of China (Grant No. 51001045) and the Youth Foundation of Hubei Provincial Education Bureau (Grant No. Q20120110).References
- M. A. Peña and J. L. G. Fierro, Chem. Rev., 2001, 101, 1981–2018 CrossRef.
- S. Ponce, M. A. Peña and J. L. G. Fierro, Appl. Catal., B, 2000, 24, 193–205 CrossRef CAS.
- V. A. Sadykov, L. A. Isupova, I. A. Zolotarskii, L. N. Bobrova, A. S. Noskov, V. N. Parmon, E. A. Brushtein, T. V. Telyatnikova, V. I. Chernyshev and V. V. Lunin, Appl. Catal., A, 2000, 204, 59–87 CrossRef CAS.
- B. P. Barbero, J. A. Gamboa and L. E. Cadús, Appl. Catal., B, 2006, 65, 21–30 CrossRef CAS.
- Y. Shimakawa, M. Azuma and N. Ichikawa, Materials, 2011, 4, 153–168 CrossRef CAS PubMed.
- A. Cyza, A. Kopia, Ł. Cieniek and J. Kusinski, Mater. Today: Proc., 2016, 3, 2707–2712 CrossRef.
- A. S. Nesaraj, S. Dheenadayalan and I. A. Raj, J. Ceram. Process. Res., 2012, 13, 601–607 Search PubMed.
- Y. Sun, X. Wu and L. Yuan, Chem. Commun., 2017, 5, 2499–2502 RSC.
- O. P. Taran, A. B. Ayusheev and O. L. Ogorodnikova, Appl. Catal., B, 2016, 180, 86–93 CrossRef CAS.
- P. Xiao, J. P. Hong, T. Wang, X. L. Xu, Y. H. Yuan, J. L. Li and J. J. Zhu, Catal. Lett., 2013, 143, 887–894 CrossRef CAS.
- S. D. Song, P. Zhang, M. F. Han and S. C. Singhal, J. Membr. Sci., 2012, 415–416, 654–662 CrossRef CAS.
- Y. X. Tong, Y. Zhang, B. Jiang, J. P. He, X. J. Zheng and Q. C. Liang, IEEE Sens. J., 2017, 17, 2404–2410 CrossRef CAS.
- M. Siemons, A. Leifert and U. Simon, Adv. Funct. Mater., 2007, 17, 2189–2197 CrossRef CAS.
- L. Y. Yang, S. Y. Lin, X. Yang, W. M. Fang and R. X. Zhou, J. Hazard. Mater., 2014, 279, 226–235 CrossRef CAS PubMed.
- H. He, H. X. Dai, L. H. Ng, K. W. Wong and C. T. Au, J. Catal., 2002, 206, 1–13 CrossRef CAS.
- P. Marco and C. Giacomo, Chem. Rev., 2009, 109, 6541–6569 CrossRef PubMed.
- I. Sires, E. Brillas and M. A. Oturan, Environ. Sci. Pollut. Res., 2014, 21, 8336–8367 CrossRef CAS PubMed.
- N. Anglada, A. Urtiaga and I. Ortiz, J. Chem. Technol. Biotechnol., 2009, 84, 1747–1755 CrossRef.
- E. Brillas, I. Sires and M. A. Oturan, Chem. Rev., 2009, 109, 6570–6601 CrossRef CAS PubMed.
- V. Kavitha and K. Palanivelu, Water Res., 2005, 39, 3062–3072 CrossRef CAS PubMed.
- S. A. Messele, F. Stüber, C. Bengoa, A. Fortuny, A. Fabregat and J. Font, Procedia Eng., 2012, 42, 1373–1377 CrossRef.
- J. B. Xi, Q. J. Wang, J. Liu, L. Huan, Z. L. He, Y. Qiu, J. Zhang, C. Y. Tang, J. Xiao and S. Wang, J. Catal., 2018, 359, 233–241 CrossRef CAS.
- J. B. Xi, H. Y. Sun, D. Wang, Z. Y. Zhang, X. M. Duan, J. W. Xiao, F. Xiao, L. M. Liu and S. Wang, Appl. Catal., B, 2018, 225, 291–297 CrossRef CAS.
- S. A. Messele, O. S. G. P. Soaresb, J. J. M. Órfãb, F. Stüber, C. Bengoa, A. Fortuny, A. Fabregat and J. Font, Appl. Catal., B, 2014, 154–155, 329–338 CrossRef CAS.
- S. D. Li and X. L. Wang, Optik, 2015, 126, 408–410 CrossRef CAS.
- W. H. Bragg and W. L. Bragg, Proc. R. Soc. London, Ser. A, 1913, 88, 428–438 CrossRef CAS.
- M. Yousefi, S. S. Zeid and M. K. Motlagh, Current Chemistry Letters, 2017, 6, 23–30 CrossRef.
- O. M. Hemeda, M. M. Barakat and D. M. Hemeda, Turk. J. Phys., 2003, 27, 537–549 CAS.
- X. F. Tang, Y. G. Li, X. M. Huang, Y. D. Xu, H. Q. Zhu, J. G. Wang and W. J. Shen, Appl. Catal., B, 2006, 62, 265–273 CrossRef CAS.
- Y. Zheng, K. Z. Li, H. Wang, D. Tian, Y. H. Wang, X. Zhu, Y. G. Wei, M. Zheng and Y. M. Luo, Appl. Catal., B, 2017, 202, 51–63 CrossRef CAS.
- B. Lai, Y. X. Zhou, Y. Ping, J. H. Yang and J. L. Wang, Chemosphere, 2013, 90, 1470–1477 CrossRef CAS PubMed.
- T. D. Nguyen, N. H. Phan, M. H. Do and K. T. Ngo, J. Hazard. Mater., 2011, 185, 653–661 CrossRef CAS PubMed.
- S. S. Lin, C. L. Chen, D. J. Chang and C. C. Chen, Water Res., 2002, 36, 3009–3014 CrossRef CAS PubMed.
- H. Chen, A. Sayari and A. Adnot, Appl. Catal., B, 2001, 32, 195–204 CrossRef CAS.
- W. Yao, S. J. Yu, J. Wang, Y. D. Zou, S. S. Lu, Y. J. Ai, N. S. Alharbi, A. Alsaedi, T. Hayat and X. K. Wang, Chem. Eng. J., 2017, 307, 476–486 CrossRef CAS.
- Y. Liu and D. Z. Sun, Appl. Catal., B, 2007, 72, 205–211 CrossRef CAS.
- E. W. Wang, S. M. Lei, S. C. Zhang, T. Huang and L. L. Zhong, J. Wuhan Univ. Technol., Mater. Sci. Ed., 2015, 30, 185–192 CrossRef.
- J. Fan, Y. H. Guo, J. J. Wang and M. H. Fan, J. Hazard. Mater., 2009, 166, 904–910 CrossRef CAS PubMed.
- S. M. Robert, F. X. Webster and D. J. Kieml, Spectrometric identification of organic compounds, East China University of Science And Technology Press, ShangHai, 2007, pp. 85–127 Search PubMed.
- W. Zhong, T. Jiang, Y. L Dang, J. K. He, S. Y. Chen, C. H. Kuo, D. Kriz, Y. T. Meng, A. G. Meguerdichiana and S. L. Sui, Appl. Catal., A, 2018, 549, 302–309 CrossRef CAS.
| This journal is © The Royal Society of Chemistry 2018 |

