 Open Access Article
Accessing individual 75-micron diameter nozzles of a desktop inkjet printer to dispense picoliter droplets on demand†
Rick Waasdorp‡
,
Oscar van den Heuvel‡,
Floyd Versluis‡,
Bram Hajee‡ and
Murali Krishna Ghatkesar *
*
Department of Precision and Microsystems Engineering, Delft University of Technology, Mekelweg 2, 2628CD Delft, The Netherlands. E-mail: M.K.Ghatkesar@tudelft.nl; Tel: +31-15-27 82299
First published on 18th April 2018
Abstract
Desktop inkjet printers are ubiquitous and relatively inexpensive among the variety of available printers. These inkjet printers use an array of micro fluidic pumps, nozzles based on piezoelectric actuation, to dispense individual picoliter volume ink droplets at high speed. In this paper, we show that individual pumps in desktop printers can be accessed to dispense droplets on demand. Access was obtained using the printer’s command language programming. A detailed description of the access procedure is discussed. Droplets were printed on a paper as it rolled underneath the printhead, and with a minor hardware modification, they were also printed on a glass substrate. With this access, individual droplets were deposited, the smallest having an average diameter of 62 μm with a standard deviation of 6.9 μm, with a volume of ∼4 pL. From the intended position, the droplets had a standard deviation of 5.4 μm and 8.4 μm in the vertical and horizontal directions, respectively. The ink droplets were dispensed at a rate of 7.1 kHz. A circularity factor of 0.86 was obtained indicating that the dispensed droplets are of good quality. By replacing the ink in the cartridges with liquids of choice (e.g. cells, proteins, nanoparticles etc.), we believe it provides an opportunity for low-cost, high-speed, high-precision, picoliter volume printing for a variety of applications.
1 Introduction
At the start of the twenty-first century, the requirement for micro-precision processing has a broad significance1 for dispensing different fluid types with micro-precision, such as proteins/DNA,2,3 drugs,4 nanoparticle ink materials5 and living cells.6These days, companies like Microdrop Technologies GmbH, MicroFab Technologies inc. and FUJIFILM Dimatix offer devices that fulfil these needs. However, these devices are either very expensive or lack precision or speed. A promising way of reducing the cost is by using desktop inkjet printers, since these are capable of dispensing droplets of a few picoliters with micro-precision. The two main types of inkjet technologies are continuous inkjet (CIJ) and drop-on-demand (DOD) inkjet printers. CIJ printers are mostly used for coding and marking applications with a droplet diameter of approximately 100 μm. DOD printers are dominant in graphics and text printing with a smaller droplet diameter of typically 20–50 μm.7 DOD printing technology was chosen for this study, since these printers are more economical as they only dispense when required. Furthermore, they have a higher price–quality ratio and can dispense smaller droplets than CIJ printers.
There are two types of DOD desktop inkjet printers, i.e. thermal inkjet and piezoelectric inkjet printers, each with a different method of generating a pressure pulse that lets a droplet dispense. In thermal inkjet printers the nozzle channels in the printhead comprise a small thin-film heater, which creates a vapor bubble when a current is passed through. The bubble expansion and subsequent collapse when the current is removed, generates the pressure pulse required to dispense a droplet. Piezoelectric inkjet printers use piezoelectric actuators to dispense ink. When an electric potential is applied across the piezoelectric element, its shape changes, generating the required pressure pulse to dispense the droplet (Fig. 1a). To keep the range of applications as wide as possible, piezoelectric inkjet printing was chosen over thermal inkjet printing, as the latter affects the temperature of the printed fluid with potentially undesirable effects (e.g. for biological fluids8,9).
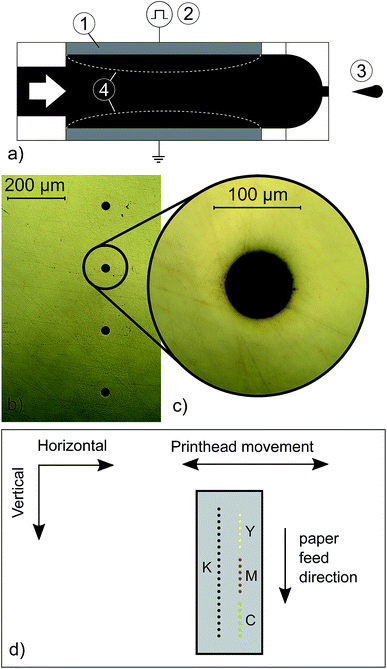 | ||
| Fig. 1 (a) A schematic diagram of the dispensing principle using a piezoelectric actuator. The piezoelectric actuator (1) deforms the membrane of an ink channel when an electric potential (2) is applied. This deformation (4) applies a large enough pressure pulse to dispense a droplet (3).36 (b) Optical microscope image of the printhead of an Epson Stylus SX235W, consisting of 90 black nozzles and 29 nozzles per colour (CMY) with a vertical nozzle spacing of 211.67 μm (1/120 inch) and a nozzle diameter of 75 μm, (c) magnified view of one nozzle, (d) schematic representation of the printhead geometry. During one stroke the printhead moves horizontally over the paper, dispensing droplets on the indicated locations. This results in horizontal lines of dispensed droplets with a vertical distance equal to the fixed nozzle distance. Before the next stroke, the paper is slightly shifted along the paper feed direction. This allows the nozzles to fill the blank spots left behind due to the fixed nozzle distance. This operation repeats itself until the task is finished. | ||
In the past there have already been multiple attempts in various science disciplines to use (modified) consumer-grade desktop inkjet printers for a variety of applications. Dixon et al.10 used a consumer-grade piezoelectric printer to dispense a commercially available silver nanoparticle ink to create digital microfluidic devices (DMF), for an inexpensive, miniaturised diagnostic assay. The performance of these inkjet printed devices was found to be comparable with devices fabricated using traditional clean room techniques, with a material cost of less than $1 per device, demonstrating the potential of desktop inkjet printers for this application.
Hou et al.11 used consumer-grade thermal inkjet printers to dispense tunable solid-state fluorescent materials for supramolecular encryption, enabling encryption of graphical information that can be easily verified upon application of an appropriate authentication reagent. The described procedure is protected from counterfeiting and reverse engineering, and shows the use of fluorescent inks in various concentrations, that are tuned beforehand.
In the field of biology, Merrin et al.12 printed multistrain bacterial patterns using a custom built printing system based on the POSaM (Piezoelectric Oligonucleotide Synthesizer and Microarrayer) design, showing the possibility of printing living cells with a piezoelectric printer. The POSaM inkjet system uses a piezoelectric printhead, a motorized stage, control electronics and a rack of bottle holders for inks, and was first introduced by Lausted et al.13 Using their own developed software, waveforms were generated to drive the piezoelectric actuators inside the printhead to dispense individual droplets.
Scafè et al.14 developed a technique to print radioactive phantoms using a mixture of black ink and sodium pertechnetate using a piezoelectric inkjet printer. By repeating specific parts in the printer command sequences, the method allowed for dispensing multiple droplets on top of each other on a millimeter scale.
In order to dispense fluids other than consumer grade commercial ink with a desktop DOD inkjet printer, fluid properties should be in an appropriate range. Typically, the allowed range of physical properties are as follows: viscosity η (1–25 cP),15 surface tension σ (20–50 dyne per cm),16 ink density ρ (0.9–1.1 g mL−1)17 and preferably the particle size should be smaller than 1 micron.18 Drop formation of Newtonian fluids is determined by the dimensionless Reynolds number, Weber number and Ohnesorge number. The Reynolds number  relates fluid inertia to viscous forces, where d represents the nozzle diameter and v represents the speed of the droplet. The Weber number
  on the other hand relates fluid inertia to surface forces. The ratio
  between these numbers, the Ohnesorge number
  , indicates whether surface forces or viscous forces dominate. The numerical simulation of Reis and Derby19 showed that drop formation is stable within the range 1 > Oh > 0.1.7
Since the nozzle diameter is fixed, viscosity and surface tension become the critical parameters. When the viscosity is too high, the acoustic waves are damped to such a degree that there is not enough energy left to overcome the surface tension and form a droplet. It also hampers quick reservoir refill. Too low a viscosity induces damped oscillations which cause non-uniform drop sizes and satellite droplets. Higher surface tension increases the energy that is required to break the meniscus (i.e. fluid–air surface) and keeps the droplets from spreading on the substrate, thereby increasing the print quality.17 When the surface tension is too low, spontaneous dripping and air-ingestion may occur.20,21
Besides drop formation, the hydrodynamic forces and rheology should also be taken into account, especially when bio-materials are involved. High shear forces present near the orifice may damage living cells.22,23 Also, solutions containing big molecules (e.g. proteins) may retract droplets via the capillary forces of stretched polymer chains.24 This non-Newtonian (viscoelastic) behaviour cannot be characterised with the Ohnesorge number. For printing colloidal suspensions, particle size becomes an important parameter. As small particles tend to aggregate, dispersion must be stable to prevent clogging. Several clogging types are distinguished. In size exclusion clogging a particle or aggregate is larger than the nozzle diameter. Fouling is the build-up of material on the interior of the nozzle, gradually narrowing the orifice. Solvent drying clogs the nozzle from outside. Hydrodynamic bridging occurs when multiple small particles reach the exit at the exact same time and form bridges that block it accordingly. Lastly, shear-induced gelation can take place in suspensions comprising polymers and small particles. Under the influence of shear forces, networks of polymer bridges are formed between the particles resulting in a drastic viscosity increase (i.e. shear thickening).25,26
In most of the studies using commercial inkjet printers to print patterns, the printed patterns deviated from the designed patterns. Dixon et al.10 reported gaps in the printed patterns to be ∼50% smaller (avg. ±1 std. dev.: 55 ± 8 μm) and traces ∼150% larger (avg. ±1 std. dev.: 148 ± 11 μm) than designed (both 100 μm). In various other studies similar deviations in designed and printed patterns were reported, independent of the type of ink used.27–29
This is caused by the print spool process, which rasterises the image data and converts it to command sequences that a printer can understand. Desktop inkjet printers are basically black-boxes, able to print a complete document by actuating many nozzles, with just one key-press. During normal operation (e.g. printing text or images) the print should be readable and colors should be correctly printed. This is only possible by dispensing multiple droplets close to each other, since a single droplet on paper is barely visible. When trying to use this default printing method to print micro scale patterns, the printer will print too much ink trying to ensure a good print quality of the pattern, in the end resulting in inconsistencies between the design and print. The method described by Scafè et al.14 allows for dispensing multiple droplets on top of each other by repeating specific parts in the printer command sequences. However, such methods cannot be used to dispense individual droplets, since individual nozzles cannot be accessed. In order to obtain this access, more control over the initial generation of these printer command sequences is required.
In the past, multiple studies did succeed in actuating individual nozzles of a commercial inkjet printhead, by utilizing the open source POSaM project.12,13,30 However, the POSaM design requires extensive hardware modifications and manufacturing of custom parts, resulting in high setup costs.31
In this paper, a procedure to access individual nozzles of a commercial desktop inkjet printer is described. This is achieved with minor hardware modifications and a newly developed printer control software. The dispensed droplets were analyzed for precision, quality and rate of dispensing. The analysis was done using consumer-grade ink. The results were compared with the specification of a dedicated commercial piezoelectric droplet dispensing system.
2 Materials and methods
2.1 Preparation of droplet dispensing
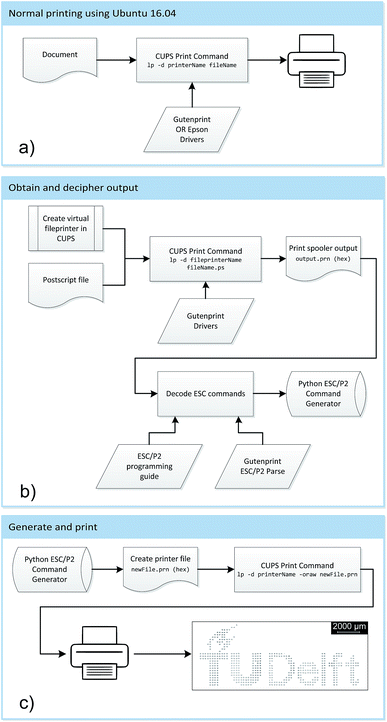
To access the individual nozzles of a desktop inkjet printer the commands created by the print spooler to control the printer, as described in the introduction, were modified. Since Epson is the only manufacturer of piezoelectric desktop inkjet printers, an Epson Stylus SX235W (Seiko Epson Corporation, Suwa, Nagano, Japan) was selected to access the individual nozzles. It costs €50 and is widely available. The manufacturer specification states that the printer can dispense three default droplet volumes, the smallest being 4 pL, through a total of 177 nozzles each with a diameter of 75 μm (Fig. 1b–d). The default Epson printer drivers generate the output in ESC/P-Raster command language; however, these commands could not be adapted since no programming guide for this language is published. To generate an output which could be adapted, Gutenprint 5.2.11 drivers were installed on an HP laptop running the Ubuntu 16.04 operating system. The Gutenprint drivers were used to generate the output of the spooling process in the ESC/P2 (Epson Standard Code for Printers, version 2) command language, which could be adapted using the ESC/P2 programming guide.32 The complete flow chart of the process is shown in Fig. 2.Once the ESC/P2 commands were fully understood, individual nozzles were accessed and all sorts of patterns with adjustable relative distances could be printed to examine the limits of the printer. Together with a created Python script and eventually a developed graphical user interface (GUI) (see ESI Fig. S1†), ESC/P2 commands could be generated without the need of the printer driver (i.e. no filters), and could be sent directly to the printer with CUPS (Common Unix Printing System) print commands via USB or WIFI connection.
The ESC/P2 command language has an option to change the print direction. During normal operation the printhead is dispensing droplets while moving bi-directionally. The bi-directional printing mode is faster than the unidirectional mode where the printhead only dispenses whilst moving to the right. Both modes were evaluated and the mode with the highest precision was selected for further testing.
To show the smallest droplet size four tests were executed to print three default droplet sizes on plain paper, premium glossy photopaper, a microscope glass slide, and a microscope glass slide treated with octyltrichlorosilane (C8H17Cl3Si) to create a hydrophobic surface.
2.2 Printer modification
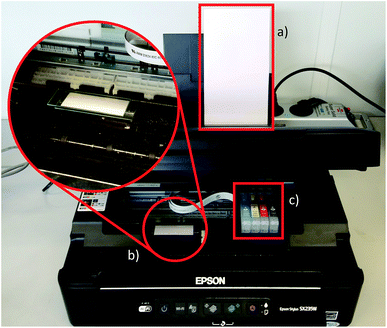
A modified Epson Stylus SX235W was used to conduct all the printer experiments. It was loaded with four default Epson cartridges (black, magenta, yellow and cyan) filled with Epson DuraBrite Ultra Ink (T1285). The printer was modified to print on various substrates at different distances from the printhead (i.e. the platen gap). To print on different substrates, the printer part which guides the paper under the printhead and keeps it flat was first disassembled. After that, the bottom piece of foam which was originally used to absorb undesirable dispensed ink was cut in half and partially reassembled. This results in a gap in the bottom of the printer. A piece of metal with a height of 16 mm was used to fill the gap. On top of the piece of metal, microscope glass slides (or any other substrate) could be stacked to vary and optimize the platen gap. To avoid error from the paper feed sensor, A4 paper cut in half along its length was used. During the printing process, the paper passes without disturbing the substrate. By indicating the proper print location, droplets were dispensed on the substrate. The printer setup with refillable cartridges, substrate and paper is shown in Fig. 3. A movie showing the printing process is included in the ESI (SV8).† In case of clogging, nozzles were flushed using a syringe similar to the method described by Cohen et al.8 Note that when experimenting with plain paper or photo paper, all disassembled parts were replaced to ensure printing on paper without any problems.2.3 Evaluation of the precision
The precision referred to throughout this paper is how precisely the location of the center of a droplet can be controlled. This precision was evaluated by assigning the printer to print a raster of droplets, followed by a measurement of the distance between each droplets center and its intended location (i.e. the deviation).The positioning of the substrate was done manually and was therefore relatively inaccurate. This resulted in an unknown absolute location of the assigned raster on the substrate. When putting the raster under the microscope to measure the deviation, the location where each droplet should have been is unknown. Furthermore, each droplet had its own deviation and therefore a fit had to be made to determine the location where each droplet should have been. To do that, a virtual grid was created and was fitted onto the raster of droplets. For the fitting, all three degrees of freedom were taken into account; horizontal translation, vertical translation and rotation. Fig. 4 illustrates that using a fit that takes all three degrees of freedom into account, the blue grid, is better than the red grid, which is simply a non-rotated grid with its origin at the center of the upper left droplet. The fitting and deviation estimation were done using Matlab. This experiment was repeated for the three default droplet sizes.
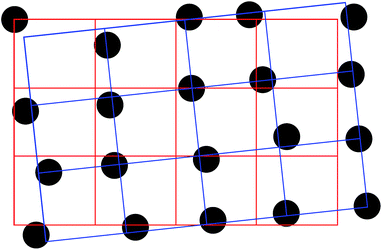 | ||
| Fig. 4 An example of how the droplets could appear on the microscope picture is displayed by the black dots. Simply creating a virtual grid with its origin at the center (the red grid) of the upper left droplet does not give an accurate fit. For a better fit, the grid also needs to be translated and rotated (the blue grid). The fit of the blue grid results in much lower deviations, and gives a better representation of the droplets mutual deviation. See the ESI† for pictures of the printed droplet matrix. | ||
2.4 Evaluation of circularity
Besides measuring the precision, it is also important to have a measure of the quality of the printed droplets and for this a circularity parameter was used. There are multiple ways to describe the circularity of a printed droplet, but most of them are scale dependent. To be able to compare the circularity of droplets of different sizes, the method described by Takashimizu and Iiyoshi33 was used.
 | (1) |
The method results in a dimensionless value for the circularity between zero and one, where a value of one is obtained when the shape is perfectly circular, using eqn (1). To obtain the area and perimeter of the evaluated droplets, a method was developed, the working principle of which is explained in the ESI (Fig. S2†). For validation of the method, the circularity of ellipses with different aspect ratios was measured and compared to the values obtained by Takashimizu and Iiyoshi (see the ESI Fig. S3†).
2.5 Evaluation of print speed
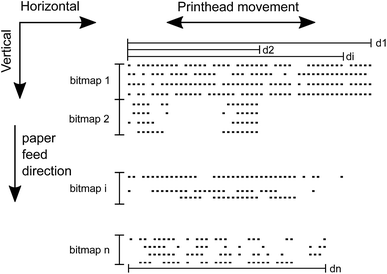
The print speed can be expressed in two ways; the time that is required to print a pattern of droplets (treq) and the maximum frequency with which droplets can be dispensed (the maximum drop rate, which can be derived from treq). To be able to estimate treq for every possible pattern, this pattern first has to be divided into n bitmaps. The number of bitmaps, n, equals the number of rows of the pattern (i.e. the height of the pattern) divided by the number of nozzles, r, of the used printer rounded up to the next integer. For example, if the number of black nozzles is 90 and the number of rows in the required pattern is 183, n equals 3.Each of these n bitmaps are printed individually. The ith bitmap has a certain di, i.e. the horizontal index of the rightmost droplet to dispense. Each bitmap equals a matrix with dimensions r × di, in which a 1 denotes the dispensing a droplet, and a 0 equals a blank spot. Fig. 5 visualises d and n for an arbitrary pattern. To derive the maximum drop rate, treq is measured for a pattern with an optimal drop rate. What this pattern consists of, will be deduced from the measurement data of printing different patterns.
The experiment uses a pattern that consists of 900 droplet rows. These rows are divided into smaller segments, bitmaps, the size of which depends on the number of nozzles, r. The Epson SX235W has 90 black nozzles, therefore 10 bitmaps are created. The width, d, of the patterns varied between 1 and 2888 (the maximum amount of droplets in the horizontal direction on A4 paper).
The printing of the different patterns was recorded using a camera with a frame rate of 30 frames per second. The recordings were analysed to obtain the actual print speed.
3 Results
3.1 Validation of individual droplet dispensing
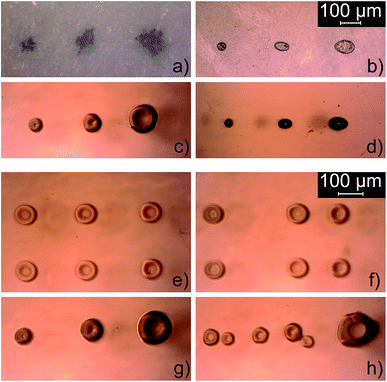
By understanding and adjusting ESC/P2 commands, individual nozzles were accessed. Three different droplet sizes and multiple rasters, dispensed by individual nozzles, with various horizontal spacing could now be programmed to generate a raw ESC/P2 print file, which could be sent directly to the printer. All samples were printed with a programmed horizontal spacing between the droplets of 250 μm. Due to the geometry of the printhead (Fig. 1) and the fact that a fixed substrate is used, the vertical spacing is fixed at approximately 212 μm (1/120 inch).Fig. 6a–d depict the three default droplet sizes dispensed on four different substrates (plain paper, premium glossy photo paper, a microscope glass slide and a hydrophobic microscope glass slide). The droplets have an elliptical shape with the major radius in the horizontal direction. The difference in uni- and bi-directional printing is shown in Fig. 6e and f. The unidirectional printed raster appears to be accurate, whereas the bi-directional printed raster is not. The result of varying the platen gap is shown in Fig. 6g and h. A bigger platen gap results in splitting of the droplets, or more spread out droplets.
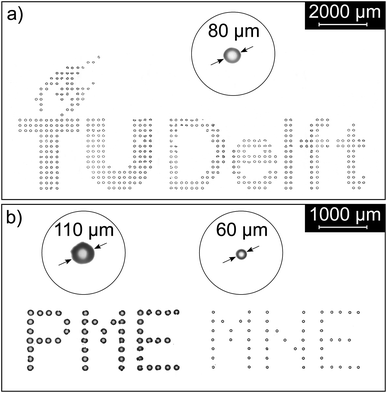
By manually rasterizing an image, an image of individual droplets of different sizes could be created. For example, the TU Delft logo as can be seen in Fig. 7a. A movie (SV8) showing this printing process is included in the ESI.†
3.2 Measuring the precision
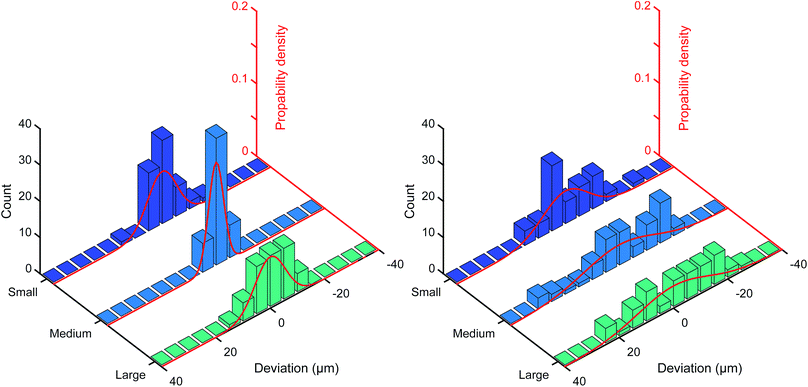
The precision measurements were done on multiple rasters with dimensions of 4 × 13 (52 droplets) for each default droplet size (ESI Fig. S4–S12†). The dispensed droplets deviated from the intended raster. These deviations were measured and put together in six separate histograms. For each default droplet size there are two histograms, one containing the vertical deviation and the other the horizontal deviation. The histograms are depicted in Fig. 8. The data appears to be evenly distributed around zero. For this reason, the average deviation was approximated as a Gaussian distribution with a mean (μ) of approximately zero, also shown in Fig. 8 (red curves). The standard deviation that belongs to an obtained Gaussian distribution is recognised as the precision. The standard deviation (σ), and thus precision, in the horizontal direction is 8.4 μm, 13.1 μm and 13.0 μm for the small, medium and large droplets respectively. The standard deviation in the vertical direction for the same droplet sizes is 5.4 μm, 2.8 μm and 5.6 μm respectively.3.3 Circularity
The circularity value, ranging between zero and one, determines the quality of the droplets. The area and perimeter were measured for the small, medium and large droplets. The circularity was then obtained using eqn (1). The resulting values are shown in Table 1. Since a high circularity value corresponds to a high quality of the droplet, we can conclude that the small and medium droplets have a higher quality than the large droplets.| Droplet size | Circularity |
|---|---|
| Small | 0.86 ± 0.04 |
| Medium | 0.85 ± 0.03 |
| Large | 0.81 ± 0.04 |
3.4 Print speed
The bi-directional print mode is faster, but less accurate, than the unidirectional mode. To measure the print speed, the unidirectional mode was used as this mode was also used for the precision and circularity measurements.By printing different patterns and measuring treq for each pattern, the variables that influence treq were found to be d and n (see Fig. 5). Note that treq is not affected by the complexity of the pattern. Recordings of the printing of the patterns are included in the ESI (SV1–7).†
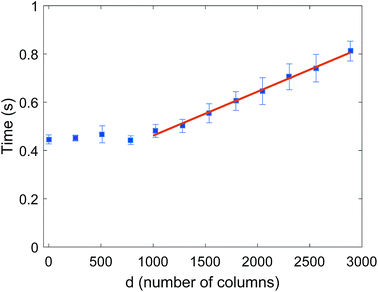
To determine the dependence of treq on d and n, these parameters were varied and each time treq was measured. treq was measured to be directly proportional to n. The measurement results from varying d are displayed in Fig. 9. From this graph, it can be concluded that for large values of d (greater than 1000 columns), treq is approximately linearly dependent on d. Combining these results, treq was found to depend on d and n following eqn (2).
 | (2) |
From eqn (2) it can be deduced that the maximum drop rate is acquired by printing a single raster of 90 rows with an arbitrary length. A large row length was chosen to make the measurement as reliable as possible. The printed raster consisted of 90 rows with a length of 2888 droplets. This took 0.405 seconds and since 259![[thin space (1/6-em)]](https://www.rsc.org/images/entities/char_2009.gif) 920 (90 × 2888) droplets were dispensed, this equals a drop rate of approximately 642 kHz, which is the maximum drop dispense rate for a fluid in the black cartridge. For fluids in one of the three color cartridges, it takes the same time to dispense 83
920 (90 × 2888) droplets were dispensed, this equals a drop rate of approximately 642 kHz, which is the maximum drop dispense rate for a fluid in the black cartridge. For fluids in one of the three color cartridges, it takes the same time to dispense 83![[thin space (1/6-em)]](https://www.rsc.org/images/entities/char_2009.gif) 752 (29 × 2888) droplets, which equals a drop rate of approximately 207 kHz.
752 (29 × 2888) droplets, which equals a drop rate of approximately 207 kHz.
To make a fair comparison of the Epson printhead to a Microdrop system, the dispensing rate of an individual nozzle is required. The measured maximum drop rate of an individual piezoelectric nozzle equals approximately 7.1 kHz (2888 droplets in 0.405 seconds).
4 Discussion
4.1 Droplet dispensing
As depicted by Fig. 6a–d, the droplet sizes vary per substrate. Plain paper is a porous material which absorbs the ink with capillary action.34 Subsequently the ink draws out as it diffuses to areas with a lower concentration. This results in relatively big, irregularly shaped droplets. Premium glossy photo paper has an absorbent coating which limits the diffusion of the ink, resulting in smaller droplets compared to the plain paper. An untreated glass substrate is hydrophilic, therefore the ink is not stopped from spreading, resulting in a relatively big droplet size. On a hydrophobic glass substrate, the droplets are smaller in size.35The elliptical shape visible in Fig. 6b and d could be explained by the continuous movement of the printhead whilst dispensing the droplets. The initial horizontal fall speed of the droplets causes them to smear out on the substrate in the horizontal direction. The continuous movement of the printhead probably also causes the difference in uni- and bi-directional printing (Fig. 6e and f), for which a hypothesis is included in the ESI Fig. S13†.
When the platen gap was increased to 6.8 mm, the droplets split into smaller droplets (Fig. 6h), which is probably caused by the phenomenon of non-reproducible Rayleigh breakup.36,37 This phenomenon states that there are always small perturbations in the tail of the fluid that comes out of the nozzle. Initially, the primary droplet and the tail travel with the same speed. Later, the perturbations from noise in the tail cause instabilities, consisting of growing and decaying sinusoidal components over time, resulting in satellite droplets.38 The tail will break apart, often into multiple smaller satellite droplets. When the platen gap is increased, it is more likely that a growing component becomes dominant over other components, which leads to this Rayleigh breakup. After breaking apart, the different residual oscillations can even lead to a non-axisymmetric motion of the satellite droplets, which induces the misalignment of the printed droplets on the substrate.39 Additionally, the horizontal spreading of the satellite droplets is presumably caused by the horizontal movement of the printhead. It was shown that satellite droplets are influenced by the drive signal to the piezo and liquid properties, like viscosity.40 Furthermore, we assume that Epson printers are using drive signals that will lead to the optimal performance of the printer. The same holds for the viscosity range of their inks. Hence, it is unlikely that satellite droplets are forming due to a non-optimal use of the drive signal or viscosity range of the ink used in this study. ESI Fig. S14† shows a similar result to that depicted in Fig. 6h. As using a platen gap of 6.8 mm obtained undesired droplets, a platen gap of 3.5 mm was chosen for rest of our experiments. It can also be seen that the droplets form doughnut-like shapes, this could be due to momentarily trapped air between the substrate and the droplet, creating a small dimple in the center of the droplet.41
4.2 Limits of the printer
In comparison with a Microdrop dispensing system, DOD desktop inkjet printers offer tremendous potential for high rate dispensing, at a much lower price. Table 2 shows the specification of a complete Microdrop system with an MD-K-130 dispenser head42 versus the Epson SX235W. A MD-K-130 dispenser head has only one nozzle and is very expensive as a stand-alone device. Since the Epson printhead has a lot more nozzles, the maximum drop rate it can dispense at is enormous in comparison with the Microdrop system. Looking at the individual nozzles this difference is as significant. However, the measured drop rate of an individual nozzle (7.1 kHz) might be restricted by the positioning mechanism. Therefore the actual maximum drop rate of a single piezoelectric nozzle might be higher.| Microdrop | Epson | |
|---|---|---|
| MD-K-130 | SX235W | |
| a Depending on the fluid used.b Precision in the horizontal direction, as the vertical position is fixed. | ||
| Minimum droplet volume | 20 pLa | 4 pLa |
| Viscosity range | 0.4–20 cP | 1–25 cP |
| Positioning precision | ≈25 μm | ≈13 μmb |
| Number of nozzles | Max. 2 | 177 |
| Drop rate of a single nozzle | 2 kHz | 7.1 kHz |
| Maximum drop rate | 4 kHz | 1.2 mHz |
It should be noted that, for printing on a stationary substrate, the limited freedom of positioning in vertical (y) direction is a disadvantage of the Epson printer. Furthermore, due to a combination of rounding errors in the software and the printer’s resolution, the horizontal location of the droplets is always rounded to a multiple of ∼4.4 μm (1/5760 inch).32 For these reasons, controlling the printhead outside of the printer could make this dispensing technology broadly applicable.
The resolution of the pictures taken for the precision result in measurements with steps of approximately 1.8 μm. Since the centers of the droplets were identified manually, clearly there is some error in the obtained values for the precision. The same pictures were used to measure the circularity.
5 Conclusion
Technological advancements make inkjet printing technology suitable for a wider variety of applications. These applications require a precise and accurate method to dispense picoliter droplets. Currently available devices that meet these requirements are very expensive (e.g. Microdrop Technologies), therefore a piezoelectric desktop inkjet printer was modified to print individual droplets. Its specification was studied and then compared to a Microdrop system, shown in Table 2.Individual nozzle control was obtained by understanding and adjusting the ESC/P2 commands for a modified Epson Stylus SX235W. The acquired control made it possible to dispense three default droplet sizes from every nozzle, at a maximum rate of 7.1 kHz per nozzle. Using all 177 nozzles results in a maximum drop rate of 1.2 MHz. The precision for the small droplets was measured to be 5.4 μm in the vertical direction and 8.4 μm in the horizontal direction. No meaningful conclusions can be drawn for the accuracy of the droplet location since the substrate was positioned by hand. Furthermore, a GUI was created to facilitate the handling of the proposed printing method.
Hardware adjustments made it possible to print on any substrate. For a flexible substrate droplets can be dispensed at every location, where as for a rigid substrate the vertical position is limited due to the geometry of the printhead. The modified desktop inkjet printer can dispense a smaller droplet volume at a higher drop rate with superior precision at a much lower price.
5.1 Outlook
As a future objective, alternative printers should be addressed as it became clear that there are printers which are more competent than the Epson Stylus SX235W. There are printers available that print with a higher resolution and smaller droplet sizes, although these printers are more expensive. Some printers feature as many as 8 ink channels, each transporting ink from one of the 8 cartridges to its corresponding numerous array of nozzles.As part of next steps in the project, more inks will be printed. We have already started printing conductive silver particle ink (viscosity 5 cP, surface tension 31 dyne per cm) purchased from Novacentrix®. Although further optimisation is required, preliminary results are promising. Images of large, medium and small silver ink droplets are shown in the ESI (Fig. S15–S17†).
Furthermore, an additional experiment to test the hypothesis about the ∼4.4 μm (1/5760 inch) round-off error discussed in Section 4.2 will be done. As defined by the page measurement units, ∼4.4 μm is the maximum resolution. Therefore it is assumed that a multiple of this resolution for the center-to-center distance between the droplets will result in a higher horizontal precision.
Conflicts of interest
There are no conflicts to declare.Acknowledgements
We thank Robert Krawitz and the rest of the Gutenprint development team for helping to obtain and decipher the print spooler output. We thank Burak Eral and Semeer Shingte for their help with the visualisation of the droplets. Furthermore, we thank the technical support team from the Precision and Microsystem Engineering department for their help during the project. The help from Hessel Tijseling, Marten Wijnja, Abel Matser, Tim Wubbe, Auke Prins, Samir den Haan, Daan Treurniet and Thomas van der Hout with the silver ink printing is very much appreciated.References
- P. Shore and P. Morantz, Philos. Trans. R. Soc., A, 2012, 370, 3993–4014 CrossRef PubMed.
- R. Saidur, K. Y. Leong and H. A. Mohammad, Renewable Sustainable Energy Rev., 2011, 15, 1646–1668 CrossRef CAS.
- N. Komuro, S. Takaki, K. Suzuki and D. Citterio, Anal. Bioanal. Chem., 2013, 405, 5785–5805 CrossRef CAS PubMed.
- X. Qiu, S. Leporatti, E. Donath and H. Möhwald, Langmuir, 2001, 17, 5375–5380 CrossRef CAS.
- T. H. Van Osch, J. Perelaer, A. W. de Laat and U. S. Schubert, Adv. Mater., 2008, 20, 343–345 CrossRef CAS.
- R. E. Saunders, J. E. Gough and B. Derby, Biomaterials, 2008, 29, 193–203 CrossRef CAS PubMed.
- B. Derby, Annu. Rev. Mater. Res., 2010, 40, 395–414 CrossRef CAS.
- D. J. Cohen, R. C. Morfino and M. M. Maharbiz, PLoS One, 2009, 4, e7086 Search PubMed.
- A. Roda, M. Guardigli, C. Russo, P. Pasini and M. Baraldini, BioTechniques, 2000, 28, 492–496 CAS.
- C. Dixon, A. H. Ng, R. Fobel, M. B. Miltenburg and A. R. Wheeler, Lab Chip, 2016, 16, 4560–4568 RSC.
- X. Hou, C. Ke, C. J. Bruns, P. R. McGonigal, R. B. Pettman and J. F. Stoddart, Nat. Commun., 2015, 6, 6884 CrossRef PubMed.
- J. Merrin, S. Leibler and J. S. Chuang, PLoS One, 2007, 2, e663 Search PubMed.
- C. Lausted, T. Dahl, C. Warren, K. King, K. Smith, M. Johnson, R. Saleem, J. Aitchison, L. Hood and S. R. Lasky, Genome Biol., 2004, 5, R58 CrossRef PubMed.
- R. Scafè, P. Auer, P. Bennati, L. L. Porta, F. Pisacane, M. Cinti, R. Pellegrini, G. D. Vincentis, G. Conte and R. Pani, Phys. Med., 2011, 27, 209–223 CrossRef PubMed.
- G. Cummins and M. P. Desmulliez, Circuit World, 2012, 38, 193–213 CrossRef CAS.
- C.-T. Chen, Inkjet printing of microcomponents: theory, design, characteristics and applications, INTECH Open Access Publisher, 2011 Search PubMed.
- M. Shlomo, The chemistry of inkjet inks, World Scientific, 2009 Search PubMed.
- S. Towne, V. Viswanathan, J. Holbery and P. Rieke, J. Power Sources, 2007, 171, 575–584 CrossRef CAS.
- N. Reis and B. Derby, MRS Proceedings, 2000, 624, 65 CrossRef.
- D. Glocker and S. Ranade, Medical Coatings and Deposition Technologies, John Wiley & Sons, 2016 Search PubMed.
- M. You, J. Zhong, Y. Hong, Z. Duan, M. Lin and F. Xu, Nanoscale, 2015, 7, 4423–4431 RSC.
- A. Yusof, H. Keegan, C. D. Spillane, O. M. Sheils, C. M. Martin, J. J. O’Leary, R. Zengerle and P. Koltay, Lab Chip, 2011, 11, 2447–2454 RSC.
- J. A. Park, S. Yoon, J. Kwon, Y. K. Kim, W.-J. Kim, J.-Y. Yoo and S. Jung, Sci. Rep., 2017, 7, 14610 CrossRef PubMed.
- J. T. Delaney, P. J. Smith and U. S. Schubert, Soft Matter, 2009, 5, 4866–4877 RSC.
- A. Lee, K. Sudau, K. H. Ahn, S. J. Lee and N. Willenbacher, Ind. Eng. Chem. Res., 2012, 51, 13195–13204 CrossRef CAS.
- B. Cabane, K. Wong, P. Lindner and F. Lafuma, J. Rheol., 1997, 41, 531–547 CrossRef CAS.
- H.-H. Lee, K.-S. Chou and K.-C. Huang, Nanotechnology, 2005, 16, 2436–2441 CrossRef CAS PubMed.
- Y. Kawahara, S. Hodges, B. S. Cook, C. Zhang and G. D. Abowd, Proceedings of the 2013 ACM international joint conference on Pervasive and ubiquitous computing, 2013, pp. 363–372 Search PubMed.
- K. Maejima, S. Tomikawa, K. Suzuki and D. Citterio, RSC Adv., 2013, 3, 9258–9263 RSC.
- C. G. Lausted, C. B. Warren, L. E. Hood and S. R. Lasky, Methods Enzymol., 2006, 410, 168–189 CAS.
- T. G. Henares, K. Yamada, K. Suzuki and D. Citterio, Design of Polymeric Platforms for Selective Biorecognition, Springer, 2015, pp. 197–235 Search PubMed.
- Seiko Epson Corporation, Programming guide for 4 Color EPSON Ink Jet Printer PX-603F/PX-503A/PX-203 WorkForce635/633/630/625/60/T42WD Epson Stylus Office TX620FWD/BX625FWD/BX525WD/B42WD Epson Stylus SX620FW/NX625/TX560WD/SX525WD Epson ME OFFICE 960FWD/900WD/82WD/85ND (Level 1), 2011.
- Y. Takashimizu and M. Iiyoshi, Progress in Earth and Planetary Science, 2016, vol. 3, p. 2 Search PubMed.
- L. Hu and Y. Cui, Energy Environ. Sci., 2012, 5, 6423–6435 Search PubMed.
- G. McHale, N. Shirtcliffe and M. Newton, Langmuir, 2004, 20, 10146–10149 CrossRef CAS PubMed.
- H. Wijshoff, Phys. Rep., 2010, 491, 77–177 CrossRef CAS.
- H. Dong, W. W. Carr and J. F. Morris, Phys. Fluids, 2006, 18, 072102 CrossRef.
- J. Eggers, Rev. Mod. Phys., 1997, 69, 865 CrossRef CAS.
- E. Trinh and T. G. Wang, J. Fluid Mech., 1982, 122, 315–338 CrossRef.
- H. Dong, W. W. Carr and J. F. Morris, Phys. Fluids, 2006, 18, 072102 CrossRef.
- C. W. Visser, P. E. Frommhold, S. Wildeman, R. Mettin, D. Lohse and C. Sun, Soft Matter, 2015, 11, 1708–1722 RSC.
- Microdrop Technologies, Microdrop Dispenser Heads, spec sheet, 2016.
Footnotes |
| † Electronic supplementary information (ESI) available: Microscope images, videos and software. See DOI: 10.1039/c8ra00756j |
| ‡ These authors contributed equally to this work. |
| This journal is © The Royal Society of Chemistry 2018 |

