
 Open Access Article
 This Open Access Article is licensed under a Creative Commons Attribution-Non Commercial 3.0 Unported Licence
Synthesis, characterisation and ion-binding properties of oxathiacrown ethers appended to [Ru(bpy)2]2+. Selectivity towards Hg2+, Cd2+ and Pb2+†
Ruth A. Odhiamboab,
Austin O. Aluoch d,
Lydia W. Njengaa,
Stanley M. Kagwanjac,
Shem O. Wandigaa and
Ola F. Wendt*b
d,
Lydia W. Njengaa,
Stanley M. Kagwanjac,
Shem O. Wandigaa and
Ola F. Wendt*b
aUniversity of Nairobi, P. O. Box 30197 – 00100, Nairobi, Kenya
bLund University, Box 124, Lund, Sweden. E-mail: ola.wendt@chem.lu.se
cChuka University, P. O. Box 109 – 60400, Chuka, Kenya
dThe Technical University of Kenya, P. O. Box 52428 – 00200, Nairobi, Kenya
First published on 17th January 2018
Abstract
A series of complexes with oxathiacrown ethers appended to a [Ru(bpy)2]2+ moiety have been synthesized and characterised using 1H NMR, 13C NMR, IR, electronic absorption and emission spectroscopies, mass spectrometry and elemental analyses. The complexes exhibit strong MLCT luminescence bands in the range 608–611 nm and one reversible metal centred oxidation potential in the range 1.00–1.02 V. Their selectivity and sensitivity towards Hg2+, Cd2+ and Pb2+ metal ions have been investigated using electronic absorption, luminescence, cyclic and differential pulse voltammetry titrations. Their responses towards selected cations and anions have also been investigated using electronic absorption and luminescence. While the complexes are selective towards Hg2+ and Cd2+ ions, none of them is selective towards Pb2+ ions. In particular, complex 2 gives a selective change in the UV/Vis absorbance with Hg2+ making it possible to detect mercury down to a detection limit of 68 ppm. The binding constants and limits of detection of the complexes have been calculated, with values ranging from 4.37 to 5.38 and 1.4 × 10⁻³ to 6.8 × 10⁻⁵ for log![[thin space (1/6-em)]](https://www.rsc.org/images/entities/char_2009.gif) Ks and LOD respectively.
Ks and LOD respectively.
Introduction
The presence of toxic metal ions in the environment poses great danger to humans due to their non-biodegradability and bio-accumulation. Their environmental detection will require the development of simple, highly sensitive and selective analytical methods such as artificial chemosensors and, thus, the design and synthesis of such sensors with high affinity and selectivity have been given a lot of attention.1–4Crown ethers have been extensively used as nucleating ligands and chelators for specific metal ions. Together with their analogues, they permit control of both the coordination environment (donor atoms) and in principle, the stereochemistry at a metal ion. Their selective complexing ability, which depends upon the relative size of the cavity and diameter of the cation, number of donor atoms in the crown ring and the charge of the cation has led to their use in chemosensing; this subject area has been extensively reviewed.5,6 The selectivity in binding metal ions can be fine-tuned either by incorporating different soft and hard donor atoms in the chelating ring or by modifying the flexibility properties of the macrocyclic structure. This offers a tremendous potential in fabricating specific sensors for selected ions.7 Although a lot of work has been done on crown ether based chemosensors (CEBCs), the focus has been on hard donor systems with O and/or N and little emphasis has been put on soft-donor redox-active macrocyclic systems which have significant relevance in both industrial and environmental areas, because of their potential to sense environmentally toxic metals, which are usually soft. Relatively isolated and few systematic studies have been carried out to assess their selectivity towards a range of transition metals.8,9 Such systems would be expected to show enhanced binding capabilities and selectivity in comparison with the hard donor systems. In the present study, a series of oxathiacrown ether ligands (L1–L4) bonded to a [Ru(bpy)2]2+ complexing unit were synthesized, characterized and their recognition ability towards Hg2+, Cd2+ and Pb2+ metal ions investigated by spectroscopic and electrochemical methods. Ligand L3 has been investigated previously but not in a comparative study with the other ligands.9
The [Ru(bpy)2]2+ moiety served as a suitable signalling unit due to its strong MLCT absorption and its emitting excited states.10,11 It has well-defined spectroscopic, photophysical, photochemical and electrochemical properties which are sensitive to variations of external inputs, thus making it useful in the construction of supramolecular systems in sensor applications.12,13 The results obtained will further enhance the understanding of the complexation behaviour and ability of such systems to selectively bind and recover soft toxic metals that have potentially adverse effects on health.
Experimental section
Materials and measurements
Commercial reagents were used as supplied without further purification. Reagents which are not commercially available were prepared using established literature methods with modifications; 3,6-dithiaoctane-1,8-dithiol,14,15 3,8-dithiaoctane-1,8-diol,16 mesylate and dimesylates,17 1,10-phenanthroline-5,6-dione,18 5,6-dihydroxy-1,10-phenanthroline19 and Ru(bpy)2Cl2·2H2O.20 Ruthenium complexes were synthesized using modified literature procedures.9 Dry organic solvents were obtained from a dry solvent dispenser. Sample purification through flash column chromatography was done using neutral alumina or silica gel while the progress of reactions was monitored through thin layer chromatography (TLC) with Al2O3 neutral (type T 150 F254) or silica gel 60 (F254) plates.Microanalytical experiments (C, H, N analysis) were performed by Mikroanalytisches Laboratorium Kolbe, Mülheim an der Ruhr, Germany. Mass spectra were recorded on Micromass Q-TOF Micromass spectrometer while infrared spectra were obtained in solution using a Bruker Alpha FTIR spectrometer. Electronic absorption and luminescence spectra were recorded on a Varian Cary 100 Bio UV/Vis- and Varian Cary Eclipse fluorescence-spectrophotometer, respectively. Luminescence quantum yields were measured in optically dilute solutions, using [Ru(bpy)3]2+ as the reference emitter (Ø = 0.04 in water).21 The different refractive indices for the luminescence standard and sample solvent were corrected for. 1H NMR and 13C NMR spectra were obtained on a Bruker Ultrashield Plus Avance 400 MHz spectrometer and the chemical shifts are reported relative to TMS. All the electrochemical experiments were performed on an Autolab potentiostat/galvanostat (PGSTAT30). The measurements were carried out using a three-electrode cell configuration with a platinum disk working electrode, platinum gauze counter electrode and Ag/0.01 M AgNO3 reference electrode. Solutions of the complexes in acetonitrile containing 0.1 M tetrabutylammonium hexafluoro phosphate as supporting electrolyte were deoxygenated prior to each experiment. Binding constants22 and limits of detection23 were calculated according to literature methods.
Syntheses
:2) as the eluent to afford a red solid. Yield: 0.12 g (30%). 1H NMR (400 MHz, CDCl3): δ = 9.15 (m, 2H, phen), 8.70 (m, 2H, phen), 7.68 (m, 2H, phen), 4.47 (m, 4H, OCH2), 3.02 (dd, 4H, SCH2, J1 = 8.3 Hz, J2 = 4.7 Hz), 2.25 (s, 6H, CH3); 13C NMR: 149.4, 144.5, 142.0, 130.5, 125.9, 123.2 (phen); 72.4 (OCH2), 34.3 (SCH2), 16.2 (CH3). IR (cm−1): 1668 (C![[double bond, length as m-dash]](https://www.rsc.org/images/entities/char_e001.gif) N), 681 (CH2–S–CH2). ESI-MS: m/z calcd (found) 361.1039 (361.1043) ([M + H]+).:hexane (1:1, v/v) yielded a white solid. Yield: 0.14 g (50%). 1H NMR (400 MHz, CDCl3): δ = 9.17 (dd, 2H, phen, J1 = 4.3 Hz, J2 = 1.6 Hz), 8.50 (dd, 2H, phen, J1 = 8.3 Hz, J2 = 1.6 Hz), 7.68 (dd, 2H, phen, J1 = 8.3 Hz, J2 = 4.3 Hz), 4.59 (m, 2H, OCH2), 4.46 (dt, 2H, OCH2, J1 = 12.5 Hz, J2 = 6.2 Hz), 3.18 (m, 2H, SCH2), 3.09 (d, 2H, SCH2, J = 6.3 Hz), 2.96 (dd, 2H, SCH2, J1 = 10.7 Hz, J2 = 7.7 Hz), 2.82 (m, 2H, SCH2); 13C NMR: 149.6, 142.5, 132.8, 130.5, 128.7, 122.7 (phen); 76.1 (OCH2), 31.7, 29.7 (SCH2). IR (cm−1): 1671 (CN), sh (CH2–S–CH2). ESI-MS: m/z calcd (found) 359.0843 (359.0887) ([M + H]+).N), 674 (CH2–S–CH2). ESI-MS: m/z calcd (found) 419.0877 (419.0920) ([M + H]+).N), 688 (CH2–S–CH2). ESI-MS: m/z calcd (found) 479.0911 (479.0954) ([M + H]+).:1, v/v), followed by recrystallization from acetonitrile/diethyl ether to afford a red microcrystalline solid. Yield: 75 mg (42%). 1H NMR (400 MHz, CD3CN): δ = 8.89 (m, 2H, phen), 8.53 (dd, 4H, bpy, J1 = 11.0 Hz, J2 = 8.3 Hz), 8.12 (td, 2H, bpy, J1 = 8.1 Hz, J2 = 8.0 Hz, J3 = 1.5 Hz), 8.02 (m, 4H, bpy), 7.83 (d, 2H, phen, J = 5.6 Hz), 7.74 (m, 2H, bpy), 7.57 (d, 2H, phen, J = 4.4 Hz), 7.46 (dd, 2H, bpy, J1 = 9.7 Hz, J2 = 3.6 Hz), 7.26 (m, 2H, bpy), 4.53 (t, 4H, OCH2, J = 5.0 Hz), 3.04 (m, 4H, SCH2), 2.21 (s, 6H, CH3); 13C NMR: 156.7, 153.3, 151.5, 137.8, 136.4, 131.5, 127.4, 126.7, 125.7, 124.3, 122.9 (phen/bpy), 72.9 (OCH2), 33.5 (SCH2), 15.0 (CH3). ESI-MS: m/z calcd (found) 919.1026 (919.1118) [M+ − PF6], 624.0848 (624.0843) [M+ − C6H14S2(PF6)2]. Elemental analysis: calcd (found) for C38H36F12N6O2P2RuS2·H2O; C: 42.19 (42.15), H: 3.54 (3.48), N: 7.77 (7.99). IR (cm−1): 1622, 1602 (CN), 838 (PF6−), 659 (CH2–S–CH2), N → Ru (558).N), 838 (PF6−), sh (CH2–S–CH2), N → Ru (558).N), 838 (PF6−), sh (CH2–S–CH2), N → Ru (558).N), 834 (PF6−), 703 (CH2–S–CH2), N → Ru (557).
N), 681 (CH2–S–CH2). ESI-MS: m/z calcd (found) 361.1039 (361.1043) ([M + H]+).:hexane (1:1, v/v) yielded a white solid. Yield: 0.14 g (50%). 1H NMR (400 MHz, CDCl3): δ = 9.17 (dd, 2H, phen, J1 = 4.3 Hz, J2 = 1.6 Hz), 8.50 (dd, 2H, phen, J1 = 8.3 Hz, J2 = 1.6 Hz), 7.68 (dd, 2H, phen, J1 = 8.3 Hz, J2 = 4.3 Hz), 4.59 (m, 2H, OCH2), 4.46 (dt, 2H, OCH2, J1 = 12.5 Hz, J2 = 6.2 Hz), 3.18 (m, 2H, SCH2), 3.09 (d, 2H, SCH2, J = 6.3 Hz), 2.96 (dd, 2H, SCH2, J1 = 10.7 Hz, J2 = 7.7 Hz), 2.82 (m, 2H, SCH2); 13C NMR: 149.6, 142.5, 132.8, 130.5, 128.7, 122.7 (phen); 76.1 (OCH2), 31.7, 29.7 (SCH2). IR (cm−1): 1671 (CN), sh (CH2–S–CH2). ESI-MS: m/z calcd (found) 359.0843 (359.0887) ([M + H]+).N), 674 (CH2–S–CH2). ESI-MS: m/z calcd (found) 419.0877 (419.0920) ([M + H]+).N), 688 (CH2–S–CH2). ESI-MS: m/z calcd (found) 479.0911 (479.0954) ([M + H]+).:1, v/v), followed by recrystallization from acetonitrile/diethyl ether to afford a red microcrystalline solid. Yield: 75 mg (42%). 1H NMR (400 MHz, CD3CN): δ = 8.89 (m, 2H, phen), 8.53 (dd, 4H, bpy, J1 = 11.0 Hz, J2 = 8.3 Hz), 8.12 (td, 2H, bpy, J1 = 8.1 Hz, J2 = 8.0 Hz, J3 = 1.5 Hz), 8.02 (m, 4H, bpy), 7.83 (d, 2H, phen, J = 5.6 Hz), 7.74 (m, 2H, bpy), 7.57 (d, 2H, phen, J = 4.4 Hz), 7.46 (dd, 2H, bpy, J1 = 9.7 Hz, J2 = 3.6 Hz), 7.26 (m, 2H, bpy), 4.53 (t, 4H, OCH2, J = 5.0 Hz), 3.04 (m, 4H, SCH2), 2.21 (s, 6H, CH3); 13C NMR: 156.7, 153.3, 151.5, 137.8, 136.4, 131.5, 127.4, 126.7, 125.7, 124.3, 122.9 (phen/bpy), 72.9 (OCH2), 33.5 (SCH2), 15.0 (CH3). ESI-MS: m/z calcd (found) 919.1026 (919.1118) [M+ − PF6], 624.0848 (624.0843) [M+ − C6H14S2(PF6)2]. Elemental analysis: calcd (found) for C38H36F12N6O2P2RuS2·H2O; C: 42.19 (42.15), H: 3.54 (3.48), N: 7.77 (7.99). IR (cm−1): 1622, 1602 (CN), 838 (PF6−), 659 (CH2–S–CH2), N → Ru (558).N), 838 (PF6−), sh (CH2–S–CH2), N → Ru (558).N), 838 (PF6−), sh (CH2–S–CH2), N → Ru (558).N), 834 (PF6−), 703 (CH2–S–CH2), N → Ru (557).Results and discussion
Synthesis and characterization
A new synthetic strategy for generating the oxathiacrown ether ligands is given in Scheme 1 and involved refluxing 5,6-dihydroxy-1,10-phenanthroline with the oxathia mesylate (for L1) or oxathia dimesylate (for L2–L4) in DMF under a nitrogen atmosphere. L2 and L3 were prepared using Schlenk line techniques. 1,10-Phenanthroline-5,6-dione18 and 5,6-dihydroxy-1,10-phenanthroline19 were prepared using established literature methods, whereas the other intermediate compounds were synthesised following modified published procedures.15,17 Previously, a tosylate group has been widely used as a protective group in macrocyclic synthesis and has the advantages of high stability towards harsh reaction conditions, but it leads to many undesired by-products eventually giving low yields.24 Ligand L3 was previously synthesised via an alternative route where 5,6-bis(2-chloroethoxy)-1,10-phenanthroline was refluxed with 2-mercaptoethyl sulphide in ethanol in the presence of NaOH, resulting in a yield of 30%.9 In our hands, attempts to prepare L2 and L3 from the reaction of 5,6-bis(2-tosylatoethoxy)-1,10-phenanthroline with the dithiols and Cs2CO3 under conditions of high dilution gave very low yields. A new method where the thiols are protected by the mesyl group and the corresponding dimesylates reacted with 5,6-dihydroxy-1,10-phenanthroline in DMF was therefore employed. The method involves fewer steps and gives improved yields (50–57%) of the ligands. Attempts to synthesize L4 using Cs2CO3 were unsuccessful, but a yield of 43% was realised after refluxing 5,6-dihydroxy-1,10-phenanthroline and 3,6,9,12-tetrathiatetradecane-1,14-dimesylate with NaH for 24 h. Although no conditions for high dilution were used, no [2 + 2] or higher order adducts were observed in any of the reactions. | ||
| Scheme 1 Synthesis of ligands and complexes. | ||
Synthesis of the ruthenium complexes 1–4 was achieved from the stoichiometric reaction of [Ru(bpy)2Cl2]·2H2O with the corresponding ligand in ethanol; the complexes were precipitated with PF6−. Ligand L3 and complex 3 have been previously reported and their spectral data agree with those in the literature.9
The remaining ligands and complexes were characterised by 1H NMR, 13C NMR and IR spectroscopy and mass spectrometry and this gave results consistent with their expected formulations. In the 1H NMR spectra of the free ligands L1–L4, the phen moiety exhibits its chemical shifts in the aromatic region as expected, Ar–OCH2 protons appear in the range δ 4.60–4.38 while the SCH2 protons of the crown ring appear in the δ 3.18–2.78 region (Fig. S1 in ESI†). In the 1H NMR spectra of the ruthenium complexes 1–4, the aromatic protons in the two bpy and phen rings resonate in the δ 8.93–7.26 region. Each of the bpy units however, lie in magnetically non-equivalent positions and this gives more than the four expected signals (Fig. S2 in ESI†). The aromatic proton signals of the bound ligand in the complexes however show an upfield shift by 0.10–0.63 ppm, compared to those of the corresponding free ligands. This data is in agreement with literature values of similar complexes.9,25 In addition, the ruthenium complexes 1–4 were characterized by elemental analysis, which indicated the presence of one molecule of water/Ru. This is in agreement with literature reports on similar complexes and was corroborated by the presence of a water peak in the 1H NMR spectra. In all complexes, the ESI mass spectral data have a characteristic m/z peak at 624.0843, which may be attributed to the loss of two PF6− anions and the thia-crown groups.
Electronic absorption and emission spectral properties
All the absorption spectra of the free ligands (L1–L4) in CH2Cl2 exhibit intense absorptions in the range ca. 230–250 nm and 270–290 nm with molar extinction coefficients in the order of 104, attributable to intra-ligand, spin-allowed n–π* and π–π* transitions, respectively, centred on the phen unit. The corresponding complexes (1–4) exhibit an extra low-energy absorption band with a molar extinction coefficients in the order of 103 at ca. 451–457 nm. These bands which are typical of [Ru(bpy)3]2+ moieties may be assigned to the MLCT [d(πRu)–π*(phen/bpy)] transitions.26 A red shift of ca. 5–15 cm−1 is observed in the π–π* intra-ligand transitions in the complexes compared to the ligands. These are presumed to result from the localization of the LUMO on the phen unit whose energy is lowered upon coordinating to the metal.27 No remarkable differences are observed in the absorption spectra of complexes 1–4, showing that electronic effects exerted by the substituents on the remote oxathiacrown ether pendants on the phen ring are negligible. Previously, it has been shown that substituents in the 5- and/or 6-positions have negligible effects on the wavelength of absorption.28,29The luminescence spectra of the complexes were recorded in CH3CN at room temperature with excitation at the absorption maxima (λmax) of the MLCT bands. The complexes exhibit broad emission manifolds which may be assigned as 3MLCT phosphorescence, in the 607–611 nm region. These results are consistent with literature data.9,30 The radiative decay rate constants, kr (where kr = Øem/τem; Øem = quantum yield; τem = lifetime) for the ruthenium complexes fall in the 8.4–8.8 × 10⁴ s−1 region, typical of 3MLCT emitters whose values occur at ca. 8 ± 4 × 10⁴ s−1.31 All the complexes show similar emission properties, indicating that varying the oxathiacrown ether cavity size does not influence their excited state energies. Luminescence quantum yields of ca. 0.012 ± 0.002 were obtained from optically dilute samples in air-equilibrated acetonitrile, employing [Ru(bpy)3]Cl2 in water as the standard (Ø = 0.04). These values are lower than 0.018 reported for similar complexes in air saturated acetonitrile.21 The complexes have lifetimes of ca. 0.13–0.16 μs. The relatively long lifetimes in solution are indicative of emissions from the lowest energy 3MLCT excited states. These values are slightly below 0.4 μs found in similar ruthenium complexes of type [Ru(bpy)2phen]2+.32 The photophysical data for the complexes are summarized in Table 1.
Ks) and LOD of complexes 1–4
| Complex | Absorption λabs nm (ε × 104 M−1 cm−1) | Emission maxima λem (nm) | Øemb | Lifetime τ (μs) | Metal | logKs |
LOD | ||
|---|---|---|---|---|---|---|---|---|---|
| Ion | UV/Vis | Emission | UV/Vis | Emission | |||||
| a The spectral changes are too small for accurate determination of the binding constant.b The luminescence quantum yield, measured at room temperature using [Ru(bpy)3]2+ as the standard.c A quantum yield of 0.058 in nitrogen saturated MeCN for complex 3 has been reported in literature.9 | |||||||||
| 1 | 243 (3.517), 288 (6.652), 456 (1.170) | 611 | 0.012 | 0.139 | Hg2+ | 4.60 ± 0.01 | 5.25 ± 0.04 | 3.83 × 10⁻⁴ | 4.74 × 10⁻⁴ |
| Cd2+ | a | 5.21 ± 0.05 | a | 3.56 × 10⁻⁴ | |||||
| Pb2+ | a | a | a | a | |||||
| 2 | 245 (3.428), 283 (6.322), 457 (0.943) | 610 | 0.014 | 0.162 | Hg2+ | 4.72 ± 0.01 | a | 6.83 × 10⁻⁵ | 3.02 × 10⁻⁴ |
| Cd2+ | a | 5.38 ± 0.01 | a | 2.90 × 10⁻⁴ | |||||
| Pb2+ | a | a | a | a | |||||
| 3 | 247 (3.686), 284 (6.140), 451 (1.155) | 607 | 0.013c | 0.157 | Hg2+ | a | 4.59 ± 0.05 | a | 3.79 × 10⁻⁴ |
| Cd2+ | a | a | a | a | |||||
| Pb2+ | a | a | a | a | |||||
| 4 | 244 (3.789), 287 (6.035), 453 (1.112) | 608 | 0.011 | 0.133 | Hg2+ | 4.09 ± 0.02 | 4.79 ± 0.03 | 5.01 × 10⁻⁴ | 2.10 × 10⁻³ |
| Cd2+ | a | 4.45 ± 0.01 | a | 7.79 × 10⁻⁴ | |||||
| Pb2+ | a | a | a | a | |||||
Electrochemical properties
Electrochemical properties of the complexes in CH3CN solution containing 0.1 M nBu4NPF6 as the supporting electrolyte were investigated by cyclic voltammetry. The complexes were subjected to a voltage scan from −2.2 V to 1.5 V and back at a scan rate of 100 mV s−1. The data is summarized in Table 2 below while a typical cyclic voltammogram of a [Ru(bpy)3]2+ derivative is shown in Fig. S3 in the ESI.†| Complex | Oxidation: E1/2, V (ΔEp, mV) | Reduction: E1/2, V (ΔEp, mV) | ||
|---|---|---|---|---|
| a V vs. Ag/Ag+; scan rate = 100 mV s−1, ΔEp = |Epa − Epc| while E1/2 = (Epa + Epc)/2. | ||||
| 1 | 1.02 (81) | −1.62 (67) | −1.81 (71) | −2.03 (68) |
| 2 | 1.00 (90) | −1.62 (76) | −1.81 (78) | −2.04 (73) |
| 3 | 1.00 (71) | −1.64 (62) | −1.82 (64) | −2.06 (63) |
| 4 | 1.00 (87) | −1.65 (84) | −1.83 (76) | −2.07 (76) |
The complexes exhibit a reversible metal-centred oxidation wave attributable to [Ru(II) → Ru(III) + e] at 1.00–1.02 V; and the oxidation potential of complex 3 is in agreement with the literature value of 1.27 V vs. SCE9 [Ag/AgNO3 (0.01 M in MeCN) vs. SCE = 0.3 V]. The peak potentials for all the complexes are however lower than the generally observed value of 1.26 V (vs. Ag/AgNO3) for [Ru(bpy)3]2+,33 due to the presence of electron releasing thiacrown ether substituents in the complexes. Electron-donating groups are known to facilitate the oxidation of the Ru(II) centre by pumping in electrons.34 Although these are one electron transfer systems, plots of √(scan rate) vs. ΔEp (where ΔEp = Eox − Ered) for 1–4 show intercepts ranging between 60 and 90 mV, indicating that the oxidation process may be controlled by both diffusion and kinetic factors. A representative plot is shown in Fig. S4 in ESI.† No ligand centred oxidation potential was observed in this work, although some ruthenium polypyridyl complexes are known to display ligand oxidation around 1.24 V.25
The CVs of the ruthenium complexes also show three reversible reduction peaks between −1.62 V and −2.10 V. Although reduction may involve a metal- or ligand-centred orbital depending on their relative energies, ruthenium polypyridyl complexes are known to undergo a ligand centred reduction process.25 The reversible reduction waves observed in this study may thus be attributed to the addition of electrons into the π*-orbitals of the ligand. It is noteworthy that the reduction processes of heteroleptic ruthenium polypyridyl complexes may be explained by a ‘localization model’ where each reduction step is attributed to one or several finite ligands.33 The reduction peaks observed at −1.63 to −1.65 V and −1.82 to −1.84 V may thus point to the sequential one-electron reduction of the bpy ligands, [bpy → bpy−], consistent with literature9,35 while the third reduction peak at −2.05 to −2.10 V may be associated with the phen unit, as confirmed by Lazarides and co-workers.36 As the macrocyclic cavity increases from L2–L4, an anodic shift of 10–30 mV is observed in the ligand reduction potentials and the ease of reduction follows the L2 > L3 > L4 order. The substituents directly attached to phen pump electrons into the π* orbital of bpy/phen moieties and hence make reduction process harder. The shifts are however too small to affect the dπ–π* separation which has a direct correlation with Eox − Ered. Generally, substituents in the 5- and/or 6-position of the 1,10-phenanthroline have a lesser influence and hence a lower energy gap than when they occupy a position in the N-containing rings.28
Sensitivity and selectivity studies
The sensitivity and selectivity of the oxathia crown ether ruthenium complexes for Hg2+, Cd2+ and Pb2+ ions were investigated by titrating the complexes 1–4 with the metal ions (0–10 equiv.) and monitoring the electronic absorption, luminescence and electrochemical changes.Electronic absorption titrations
The complexes 1–4 were titrated with 0–10 equiv. of Hg2+, Cd2+ and Pb2+ ions in acetonitrile at room temperature and their spectra recorded. On adding Hg2+ ions to 1, 2 and 4, perturbed absorption spectra are observed with the peak at ca. 457 nm diminishing as a new peak forms at ca. 427 nm. The perturbation points to the formation of 1-Hg2+, 2-Hg2+ and 4-Hg2+ complexes in the ground state. The binding of the Hg2+ by the receptor leads to a reduction of the electron-donating ability of the oxathia crown ether conjugated to the phen unit, resulting in a 30 nm blue shift of the absorbance and hence a high selectivity for Hg2+. Three clear isosbestic points are observed at 442, 380 and 323 nm (Fig. 1).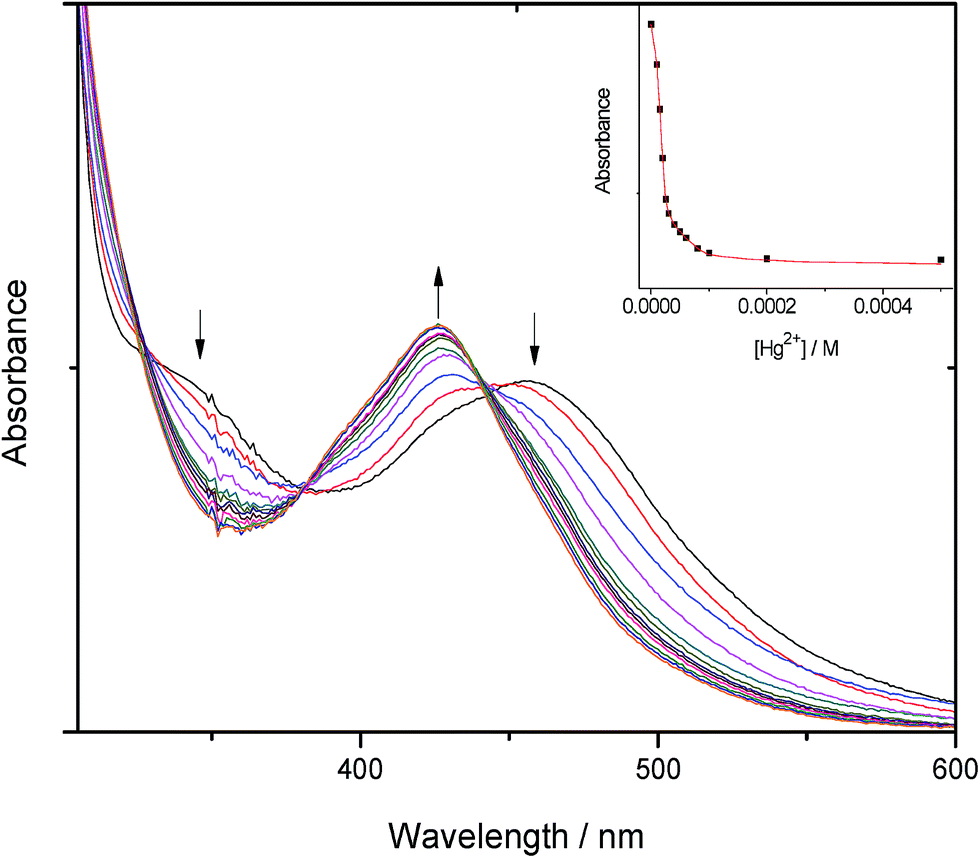 | ||
| Fig. 1 Absorption titration spectra of 2 (5 × 10⁻⁵ M) with added Hg2+ (0–2 × 10⁻⁴ M) in CH3CN at room temperature. Inset: a plot of absorbance vs. [Hg2+] at 500 nm. R2 = 0.995. | ||
These isosbestic points indicate the presence of two absorbing species (the free and the bound host complex) at equilibrium in solution. The absorption spectrum of complex 3, on the other hand, is unperturbed by the presence of Hg2+ ions. This is in agreement with the literature9 and may point to a different binding mode in the macrocyclic cavity. The interaction of Hg2+ with the complexes is also clearly observable by the naked eye as a colour change from red-orange to yellow as shown in Fig. 2.
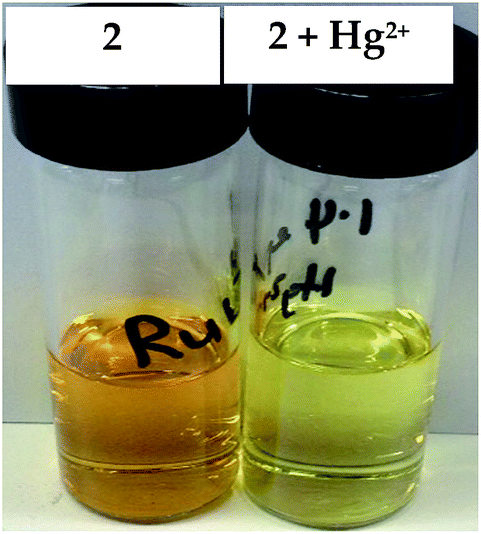 | ||
| Fig. 2 Color change showing the interaction between complex 2 and Hg2+ ions. | ||
Titration of 1–4 with Cd2+ and Pb2+ ions display insignificant spectral changes, hence absorbance changes can be used to selectively identify Hg2+ over the other ions since it is the only metal ion that changes the absorption spectra.
Emission titrations
The emission responses of the complexes 1–4 upon addition of Hg2+, Cd2+ and Pb2+ ions were investigated in acetonitrile solution at room temperature. Addition of Hg2+ to complexes 1 and 4 result in a 10–26% peak enhancement. The strong interaction between the metal ion and the thiacrown ether moiety makes the latter a poor electron donor to quench the emissive 3MLCT state, thus resulting in enhancement of the emission intensity.15 The peak enhancement continues until the right stoichiometric amounts of the metal ions and the complexes have reacted together. Although 2 shows a general peak enhancement, the luminescence spectra display some irregular behaviour. Upon adding Hg2+ (initially upto 0.5 equiv.), a peak enhancement (18%) is observed at 610 nm, followed by a gradually decreasing red shifted emission maximum at 615 nm (Fig. S5 in the ESI†). Similar unusual observations have been made with some crown moieties.22The interaction of Hg2+ with 3 displays a 25% quenching of the ruthenium peak at 1:1 stoichiometric addition. Although a 40% quenching of the same complex with Hg2+ has been previously reported in literature,9 its quenching mechanism was never investigated. A Stern–Volmer plot of I0/I vs. [Hg2+] (where I0 = initial emission intensity of the ruthenium complex without Hg2+, I = emission intensity at a given [Hg2+]) gives a downward curvature concave towards the x-axis. This negative deviation from linearity represents a quenching that is not purely collisional. Although negative deviation may be attributed to ground state complex formation, this is unlikely in the 3-Hg2+ interaction since the absorbance plot is unperturbed. It is however reasonable to assume that Hg2+ reacts with a photo-activated 3 complex to form a new activated species which emits light of energy distribution for both the radiative and non-radiative pathways, different from that emitted by the original 3. Another possible explanation for the negative shift is the fact that binding of Hg2+ to 3 may effect conformational changes on the chromo-ionophore, thus giving rise to a weakly emissive excited state. Similar observations have been noted in other chromo-ionophores.6 Although the fluorescence spectra should in principle be shifted in the same direction as those of the absorption spectra,37 this is not observed when Hg2+ interacts with complexes 1–4. While the absorption spectra of 1, 2 and 4 are blue shifted by ca. 30 nm, the corresponding luminescence spectra including that of 3 are red shifted by ca. 5 nm. The anomaly may be caused by changes in the charge–dipole interaction of Hg2+ and the positively charged ruthenium(II) centre in the excited state which results in a decrease in the emission energy.
On titrating 1–4 with Cd2+, peak enhancement of 30, 54 and 15% are observed with 1, 2 and 4 respectively while 3 trails at 7%. The highest peak enhancement of 54% with 2 is indicative of the optimal chromo-ionophoric cavity size for the Cd2+ ions. Cd2+ has borderline hard and soft acid properties and hence it binds well within the oxathia crown ether moiety. Although 4, has a bigger macrocyclic cavity compared to 3, its peak enhancement is higher probably due to the fact that it can accommodate two Cd2+ ions (the binding isotherm is 1:2) as opposed to 3 whose binding isotherm is 1:1. Sequential addition of Pb2+ ions to 1–4 generally leads to an insignificant peak enhancement of 6 to 8%, with a saturation threshold at 8 equiv. Hence, using luminescence, 3 is selective towards Hg2+ while 2 is selective towards Cd2+. None of the complexes appears to be selective towards Pb2+ ions.
Electrochemical titrations
The electrochemical response of the oxidation potential of Ru(II) in the presence of Hg2+, Cd2+ and Pb2+ was investigated by means of cyclic voltammetry (CV) and differential pulse voltammetry (DPV). Upon sequential addition of Hg2+ ions to complex 3, an anodic shift of the ruthenium(II) oxidation peak potential by 20 mV and an 11% decrease in peak current were observed. This anodic shift may be attributed to the electron-withdrawing effect of the positively charged metal-complexed thia-crown ether moiety which causes the ruthenium to oxidize at a more positive potential. Anodic shifts have been reported in ruthenium polypyridyl complexes attached to calixarenes when they bind Na+, Hg2+ and Pb2+ ions.15 The rest of the complexes (1, 2 and 4 with Hg2+ and 1–4 with Cd2+ and Pb2+) don't display any significant shifts in the oxidation peak potential of the ruthenium(II) centre using neither CV nor DPV. This may indicate a weak or non-existing effective electrochemical communication between the ruthenium(II) centre and the metal-bound thia-crown ether moiety, as far as electrochemistry is concerned.38Binding constant
The binding constants (logKs) shown in Table 1 were determined from the changes recorded in the luminescence or absorbance titrations at appropriate wavelengths where the variations are as large as possible. From luminescence spectral data, the binding constant was obtained following literature method22 in accordance with eqn (1):
 | (1) |
Kdiss whose reciprocal is the binding constant (Ks). Binding constants were also obtained from absorbance spectral data by modifying eqn (1) above into eqn (2).
 | (2) |
Using luminescence, 2 shows a relatively high binding constant with Cd2+ due to its optimal cavity size for the cation while 4 shows a lower binding constant. This may be attributed to the binding stoichiometry of 1:1 in 2:Cd2+ which results in a stronger binding compared to a 1:2 binding model in 4:Cd2+. The binding constant in 2:Cd2+ also appears higher than 1:Cd2+ due to macrocyclic effect which enhances the stability of the complex formed. Using absorbance, the spectral changes were too small for accurate determination of logKs. The binding constants for 1:Hg2+ and 4:Hg2+ determined from the luminescence spectral data are slightly higher than those determined from UV-Vis data, but there may be some underestimation of the errors. Overall it seems that luminescence measurements are more sensitive in the determination of the binding constants of the metal ions in the thiacrown ethers. LogKs obtained from 3:Hg2+ is comparable with the literature value.9 It was not possible to calculate the binding constant in 2:Hg2+ using luminescence due to the irregular behaviour of the spectra. The binding constants of 1–4 with Pb2+ were not determined because the spectral changes are too small for accurate determination of the Ks values.
Limit of detection
The limit of detection was calculated using the standard deviation method38 expressed in eqn (3):
 | (3) |
From the calculations, complex 2 shows the lowest detection limit of 68 ppm towards Hg2+ using absorbance. While the rest of the complexes [1, 3 and 4] detect Hg2+ or Cd2+ at higher concentrations ca. 0.2–0.8 millimolar using luminescence (cf. Table 1).
Interference studies
The responses of the complexes 1–4 towards various mono- and divalent cations (Li+, Na+, K+, Ag+, Ca2+, Mg2+, Cu2+ and Zn2+) and anions (Cl−, Br−, I−, NO3−, OAc−, ClO4−, HSO4− and HPO4−) were investigated by adding 10 equivalent of each ion and noting the spectral changes. The absorbance of the ruthenium peak displays negligible changes upon adding 10 equiv. of the various guest metal ions under investigation. Electronic absorption responses of complex 2 to the addition of 10 equiv. of various metal ions is shown in Fig. 3.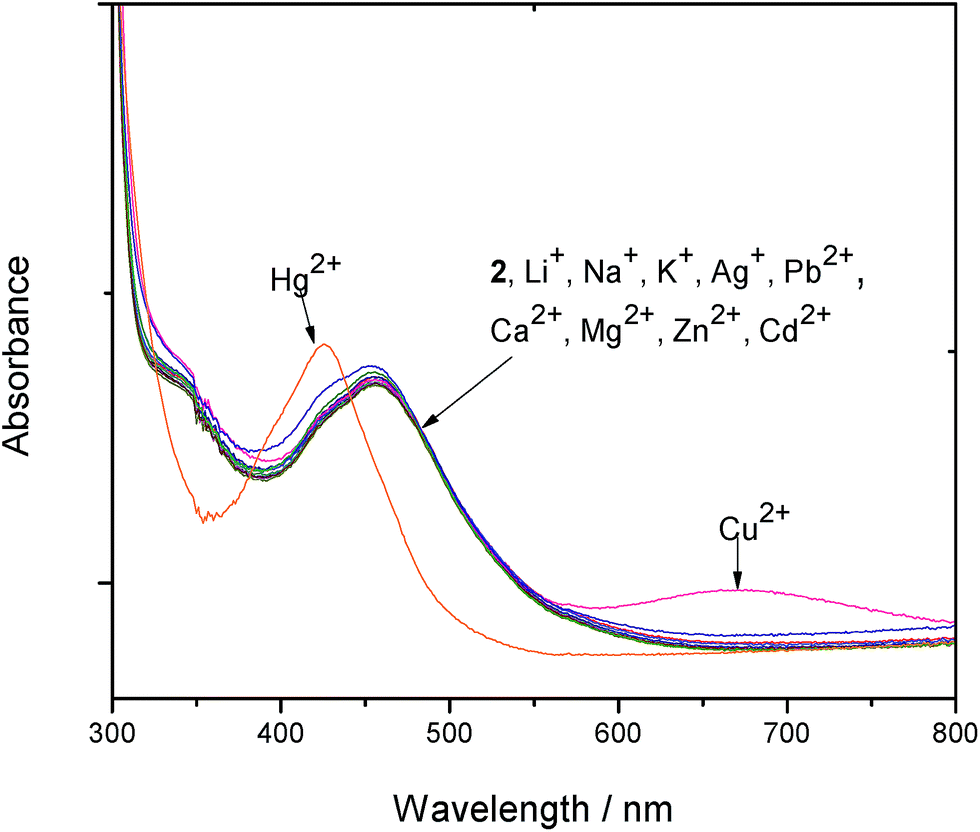 | ||
| Fig. 3 UV-Vis responses of complex 2 towards the addition of 10 equiv. of various metal ions. | ||
Generating a ratiometric signal by calibrating absorption bands at 457 nm and 427 nm for 1, 2 and 4 help eliminate most ambiguous responses to the presence of Hg2+ ions. A typical graphical representation of the ratiometric signals of absorbance at 427 nm/457 nm is shown in Fig. S7 (ESI†). On adding 10 equiv. of various anions to all the complexes 1–4, the ruthenium peak appears unperturbed (Fig. S8 in ESI†).
Using luminescence, ruthenium peak enhancements (0 ≤ 10%) are noted on adding 10 equiv. of various guest cations with no particular trend observed with 1 and small effects with 2. Complexes 3 and 4 exhibit an interesting behaviour with the monovalent cations displaying no effect and the divalent cations showing a peak enhancement of 8 to 10%. This enhancement may be attributed to the strong interaction between divalent cations and the lone pair of electrons on the oxygen atom attached to the phen unit, making it a poor donor to quench the emissive triplet 3MLCT state. The small effect on the ruthenium peak by the monovalent cations may be due to weak interactions between the +1 charge and lone pair of electrons on oxygen. Cu2+ generally shows a quenching of ca. 8% with all the ruthenium complexes. Representative spectra showing the effect of various guest cations on 3 is displayed in Fig. S9 (ESI†) while a graphical representation of the responses of complexes 1–4 to the addition of all the metal ions under investigation is shown in Fig. S10 (ESI†). On adding 10 equiv. of each of the guest anions under investigation to the complexes, the NO3− anion shows a peak enhancement of 6 to 12% while the other anions have no effect.
Conclusion
A series of ruthenium(II) complexes attached to oxathia-crown ether pendants have been synthesized and characterized. Their recognition properties towards Hg2+, Cd2+ and Pb2+ have been investigated by spectroscopic and electrochemical means. The ruthenium complexes 1, 2 and 4 display selectivity towards Hg2+ using electronic absorption spectra. By calibrating their two absorption bands at 457 nm and 427 nm, a ratiometric signal may be generated, and this can eliminate most ambiguities from interfering ions. However, 2 would be a more suitable excellent probe for Hg2+ detection than 1 and 4 using absorbance detection due to its low detection limit and colorimetric changes that can be observed by the naked eye. Using luminescence, complex 2 is selective towards Cd2+ with a binding constant of log 5.38 and LOD of 2.9 × 10⁻⁴. Complex 3 is selective towards Hg2+ even though it has a relatively lower binding constant and higher LOD. None of the ruthenium complexes is selective towards Pb2+ ions. Although the thia-crown has a high affinity for the softer Hg2+ ions, the spectral changes and hence the binding constants obtained are lower than expected. This is due to their remoteness from the phen unit and hence little influence on the π* energy orbital of the phen ligand. Electrochemically, none of the complexes is able to recognize the presence of the guest metal ions due to lack of effective electronic communication between the ruthenium metal centre and the phen-ligand. As the macrocyclic cavity increases from complex 2–4, no obvious trend is observed in the spectroscopic and electrochemical responses to the presence of Hg2+ ions. However in the ligands, an anodic shift of 10–30 mV is observed in the ligand reduction potentials from L2–L4 and the ease of reduction follows the L2 > L3 > L4 order. The substituents directly attached to phen pump electrons into the π* orbital of bpy/phen moieties and hence make reduction process harder.Conflicts of interest
There are no conflicts to declare.Acknowledgements
We gratefully acknowledge the financial support from ISP, IFS, L'Oreal-UNESCO and NACOSTI. We also thank Lund University and the Swedish Research Council for financial support.References
- P. A. Lieberzeit and F. L. Dickert, Anal. Bioanal. Chem., 2007, 387, 237–247 CrossRef CAS PubMed.
- M. R. Knecht and M. Sethi, Anal. Bioanal. Chem., 2009, 394, 33–46 CrossRef CAS PubMed.
- C. Lodeiro and F. Pina, Coord. Chem. Rev., 2009, 253, 1353–1383 CrossRef CAS.
- J. Wu, W. Liu, J. Ge, H. Zhang and P. Wang, Chem. Soc. Rev., 2011, 3483–3495 RSC.
- V. I. Minkin, A. D. Dubonosov, V. A. Bren and V. A. Tsukanov, ARKIVOC, 2008,(iv), 90–102 CAS.
- E. N. Ushakov, M. V. Alfimov and S. P. Gromov, Macroheterocycles, 2010, 3, 189–200 CrossRef CAS.
- V. Lippolis and M. Shamsipur, J. Iran. Chem. Soc., 2006, 3, 105–127 CrossRef CAS.
- H. J. Hartigan, G. Seeber, A. R. Mount, L. J. Yellowlees and N. Robertson, New J. Chem., 2004, 28, 98–103 RSC.
- M.-J. Li, B. W.-K. Chu, N. Zhu and V. W.-W. Yam, Inorg. Chem., 2007, 46, 720–733 CrossRef CAS PubMed.
- D. J. Stewart, P. E. Fanwick and D. R. McMillin, Inorg. Chem., 2010, 49, 6814–6816 CrossRef CAS PubMed.
- S.-H. Fan, A.-G. Zhang, C.-C. Ju, L.-H. Gao and K.-Z. Wang, Inorg. Chem., 2010, 49, 3752–3763 CrossRef CAS PubMed.
- A. A. Marti, C. A. Puckett, J. Dyer, N. Stevens, S. Jockusch, J. Ju, J. K. Barton and N. J. Turro, J. Am. Chem. Soc., 2007, 129, 8680–8681 CrossRef CAS PubMed.
- F. Gao, X. Chen, F. Zhou, L. P. Weng, L. T. Guo, M. Chen, H. Chao and L. N. Ji, Inorg. Chim. Acta, 2011, 370, 132–140 CrossRef.
- J. Buter and R. M. Kellogg, Org. Synth., 1987, 1993(8), 592 Search PubMed.
- R. E. Wolf, J. R. Hartman, J. M. E. Storey, B. M. Foxman and S. R. Cooper, J. Am. Chem. Soc., 1987, 109, 4328–4335 CrossRef CAS.
- T. F. Baumann, J. G. Reynolds and G. A. Fox, J. Chem. Soc., Chem. Commun., 1998, 1637 RSC.
- M. Tanaka, M. Nakamura, T. Ikeda, K. Ikeda, H. Ando, Y. Shibutani, S. Yajima and K. Kimura, J. Org. Chem., 2001, 66, 7008–7012 CrossRef CAS PubMed.
- M. Yamada, Y. Tanaka, Y. Yoshimoto, S. Kuroda and I. Shimao, Bull. Chem. Soc. Jpn., 1992, 65, 1006–1011 CrossRef CAS.
- W. Paw and R. Eisenberg, Inorg. Chem., 1997, 36, 2287–2293 CrossRef CAS PubMed.
- P. A. Lay, A. M. Sargeson, H. Taube, M. H. Chou and C. Creutz, Inorg. Synth., 1986, 24, 291–299 CAS.
- K. Suzuki, A. Kobayashi, S. Kaneko, K. Takehira, T. Yoshihara, H. Ishida, Y. Shiina, S. Oishi and S. Tobita, Phys. Chem. Chem. Phys., 2009, 11, 9850–9860 RSC.
- S. Patra and P. Paul, Dalton Trans., 2009, 8683–8695 RSC.
- S. Saravanan, T. Sudha and B. Surendra, Drug Dev. Ther., 2014, 5, 109–114 CrossRef CAS.
- M. W. Glenny, M. Lacombe, J. B. Love, A. J. Blake, L. F. Lindoy, R. C. Luckay, K. Gloe, B. Antonioli, C. Wilson and M. Schroder, New J. Chem., 2006, 30, 1755–1767 RSC.
- X.-J. Yang, C. Janiak, J. Heinze, F. Drepper, P. Mayer, H. Piotrowski and P. Klufers, Inorg. Chim. Acta, 2001, 318, 103–116 CrossRef CAS.
- F. Cheng, N. Tang, P. Liu, N. Hou and G. Chen, Transition Met. Chem., 2012, 37, 249–255 CrossRef CAS.
- C. Goze, N. Dupont, E. Beitler, C. Leiggener, H. Jia, P. Monbaron, S.-X. Liu, A. Neels, A. Hauser and S. Decurtins, Inorg. Chem., 2008, 47, 11010–11017 CrossRef CAS PubMed.
- L. Wallace and D. P. Rillema, Inorg. Chem., 1993, 32, 3836–3843 CrossRef CAS.
- D. Schallenberg, A. Neubaeur, E. Erdmann, M. Tanzler, A. Villinger, S. Lochbrunner and W. Seidel, Inorg. Chem., 2014, 53, 8859–8873 CrossRef CAS PubMed.
- Y. Chen, X. Zhou, X.-H. Wei, B.-L. Yu, H. Chao and L.-N. Ji, Inorg. Chem. Commun., 2010, 13, 1018–1020 CrossRef CAS.
- K. K.-W. Lo, M.-W. Louie and K. Y. Zhang, Coord. Chem. Rev., 2010, 254, 2603–2622 CrossRef CAS.
- S. Ji, W. Wu, P. Song, K. Han, Z. Wang, S. Liu, H. Guo and J. Zhao, J. Mater. Chem., 2010, 20, 1953–1963 RSC.
- A. Juris and V. Balzani, Coord. Chem. Rev., 1998, 84, 85–277 CrossRef.
- C. M. Elliott and E. J. Hershenhart, J. Am. Chem. Soc., 1982, 104, 7519–7526 CrossRef CAS.
- V. P. Boricha, S. Patra, Y. S. Chouhan, P. Sanavada, E. Suresh and P. Paul, Eur. J. Inorg. Chem., 2009, 1256–1267 CrossRef CAS.
- T. Lazarides, T. A. Miller, J. C. Jeffrey, T. K. Ronson, H. Adams and M. D. Ward, Dalton Trans., 2005, 528–536 RSC.
- Z. Xu, Y. Xiao, X. Qian, J. Cui and D. Cui, Org. Lett., 2005, 7, 889–892 CrossRef CAS PubMed.
- A. K. Bilakhiya, B. Tyagi and P. Paul, Polyhedron, 2000, 1233–1243 CrossRef CAS.
Footnote |
| † Electronic supplementary information (ESI) available. See DOI: 10.1039/c7ra13589k |
| This journal is © The Royal Society of Chemistry 2018 |