 Open Access Article
Titanate nanotubes-bonded organosulfonic acid as solid acid catalyst for synthesis of butyl levulinate†
Shuolin Zhou ab,
Dabo Jianga,
Xianxiang Liu
 a,
Yiping Chena and
Dulin Yin*a
aNational & Local United Engineering Laboratory for New Petrochemical Materials & Fine Utilization of Resources, College of Chemistry and Chemical Engineering, Hunan Normal University, Changsha 410081, P. R. China. E-mail: dulinyin@126.com; Fax: +86-731-8872576; Tel: +86-731-8872576
bChangsha Normal University, Changsha 410100, P. R. China
First published on 18th January 2018
Abstract
In this study, titanate nanotubes-bonded organosulfonic acid (TNTs–SO3H) was prepared and employed as an efficient heterogeneous catalyst for esterification of levulinic acid with n-butanol. Two reaction products pseudo n-butyl levulinate (pseudo-BL) and n-butyl levulinate (BL) were detected by GC-MS. The catalyst showed 86.8% conversion of levulinic acid with 99.7% selectivity towards n-butyl levulinate. TNTs–SO3H exhibited strong acidic sites and high stability even after seven cycles of usage and would be well expected to be a potential candidate for alkyl levulinate production.
1. Introduction
Biomass has received a great deal of attention due to the possibility of becoming an alternative source for the sustainable production of chemicals and fuels.1 Levulinic acid (LA), an important biomass-derived platform molecule, has been used for preparing numerous important products in chemical industries.2,3 Among them, extensive studies have been focused on the production of levulinic esters.4,5 In particular, n-butyl levulinate is a FDA-approved flavor and fragrance, and it also finds application in the solvent and plasticizer sectors.6Traditional acid catalysts such as H2SO4 and p-toluenesulfonic acid are applied for the synthesis of n-butyl levulinate via esterification of LA with n-butyl alcohol.7 However, it is well known that the mineral acid-catalyzed homogeneous processes suffer from severe corrosion, waste and safety problems, which make these catalysts unsuitable for use. Thus, it would be highly desirable to develop a recyclable heterogeneous catalyst.8 Recently, various solid catalysts, for example heteropolyacid supported on acid-treated clay,9 ammonium and silver co-doped phosphotungstic acid,10 modified H-ZSM-5,11 pyrazinium polyoxometalate,12 proved to be effective for esterification reaction. The development of a new and effective solid acid catalyst for the synthesis of biomass-derived compounds is an active ongoing research area.13,14
Over the past few years, TiO2 nanotubes (TNTs) have shown numerous promising applications, for instance in photocatalysis, catalyst support and catalyst owing to some outstanding chemical and physical properties.15–17 In addition, TNTs can be easily obtained by hydrothermal treatment of TiO2 particles (TNPs) in NaOH aqueous solution, followed by a facile post-treatment.18 To the best of our knowledge, till date, there are very few reports of titanate nanotubes as an acid-based catalyst support.19 Although sulfate-TiO2 nanotubes used as catalysts have exhibited high activity for the esterification of acetic acid,20 the challenge of stability occurs in the presence of water due to the detachment of active SO42− ions, which leads to activity loss during recycling of the catalysts. Titanate nanotubes, on the other hand, possess large surface area, abundant surface hydroxyl groups and stable tubular structures, which advantageously make them a versatile candidate in the catalysis field. It was found that the potential to modify TiO2 nanotubes to incorporate organosulfonic acid groups will open new opportunities for their use as acid-based catalysts in a variety of reactions.
In this paper, titanate nanotubes-bonded organosulfonic acid was prepared by chemical grafting-oxidation method using (3-mercaptopropyl)trimethoxysilane as precursor and TiO2 nanotubes as support (Scheme 1) and then used as catalyst for the esterification reaction of levulinic acid with n-butyl alcohol. The effects of different reaction parameters on the catalytic activity of the catalyst and the reusability of the catalyst after several reaction cycles were evaluated. The as-prepared TNTs–SO3H catalyst was expected to be a good candidate for alkyl levulinate production from biomass-derived platform molecules.
2. Experimental
2.1 Catalyst preparation
TiO2 nanotubes were synthesized using a hydrothermal synthesis approach described in literature.18 To prepare TNTs–SO3H, 4 mL of (3-mercaptopropyl)trimethoxysilane was added drop-wise to a three-necked round-bottom flask containing 1.0 g of TNTs and 15 mL of dry toluene, and the reaction mixture was refluxed for 24 h under continuous mechanical stirring. Then, the resultant product was filtered and washed with acetone. Next, the obtained powder was oxidized with 10 wt% H2O2 in methanol (10 mL) at 298 K for 24 h, followed by treatment with 1 mol L−1 H2SO4 for complete protonation. Finally, the mixture was filtered and washed with H2O and acetone to obtain the final TNTs–SO3H catalyst.2.2 Characterization
The samples were dispersed in ethanol and poured onto grids for observation. The morphologies of the samples were investigated using transmission electron microscopy (TEM) with an acceleration voltage of 200 kV (JEOL 2100, Japan). N2 adsorption–desorption isotherms were recorded with an ASAP 2400 physisorption instrument made by Micromeritics Corporation (UNITED STATES). Prior to measurement, all samples were dried under vacuum at 333 K for 24 h. Pore size distribution was calculated by the BJH method. Fourier transform infrared spectra (FT-IR) of the samples were collected by the KBr pellet technique on a Nicolet 370 infrared spectrophotometer in the range 500–4000 cm−1. Thermo gravimetric analysis (TGA) curves were recorded in air flow on a Netzsch Model STA 409PC instrument with a heating rate of 20 K min−1 from room temperature to 973 K using α-Al2O3 as the standard material. The acidity strength of catalyst was determined by Hammett acidity function method combined with UV-visible spectroscopy (Shanghai Tianmei Co. Ltd, China). 4-Nitroaniline was chosen as the basic indicator and CCl4 was chosen as the solvent.2.3 Catalytic testing
In a typical run, the experimental procedure was as follows: 1 mmol of LA and 5 mmol of n-butanol together with catalyst (5 wt% of LA) were added to a round bottom flask and heated in an oil bath. At periodic intervals, 0.2 mL of the reaction solution was withdrawn, centrifuged, and analyzed using an Agilent 6890N gas chromatograph (GC). The gas chromatograph was equipped with a HP-5 capillary column (30 m length, 0.32 mm internal diameter, 0.25 μm film thickness) and a flame ionization detector (FID). The injection port temperature was 523 K, the oven temperature was 453 K, and the detector temperature was 523 K. Degradation intermediates were identified by GC-MS, a Shimadzu GC system equipped with a capillary (30 m length, 0.32 mm internal diameter, 0.25 μm film thickness). Mass spectrometer conditions were the following: ionization mode: EI, electron energy 70 eV, interface temperature: 523 K, ion source temperature: 473 K, mass scan range: 40–640 m/z, solvent delay 3.0 min. The flow rate of the carrier gas (helium) was 1.0 mL min−1. A split ratio of 1![[thin space (1/6-em)]](https://www.rsc.org/images/entities/char_2009.gif) :
:![[thin space (1/6-em)]](https://www.rsc.org/images/entities/char_2009.gif) 50 was used for the injection of 0.2 μL of the solutions. The NIST05S.LIB library was used for the mass spectrum analysis.
50 was used for the injection of 0.2 μL of the solutions. The NIST05S.LIB library was used for the mass spectrum analysis.
3. Results and discussion
3.1 Characterization of catalyst
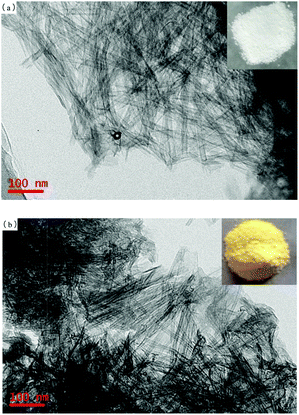
The morphologies of the TNTs and TNTs–SO3H were investigated by employing TEM. As shown in Fig. 1(a), the TNTs reveal a needlelike shape and can be up to several microns in length; each tube tends to have a diameter of approximately 10 nm. Fig. 1(b) shows a typical TEM image of the TNTs–SO3H. It is observed that the tubular structure of TNTs does not change after modification.Fig. 2 presents the nitrogen adsorption and desorption isotherms and the corresponding Barrett–Joyner–Halenda (BJH) pore size distribution curves of the TNTs and TNTs–SO3H. As shown, it can be observed that the nitrogen adsorption isotherms do not change after modification. The as-prepared TNTs–SO3H have a high specific surface area and pore volume of 217 ± 8 m2 g−1 and 0.56 cm3 g−1, respectively. In addition, the obtained pore size distribution plot of TNTs–SO3H shows a narrow microporous distribution with an average pore diameter of 4.8 nm, which are in good accordance with TEM results.
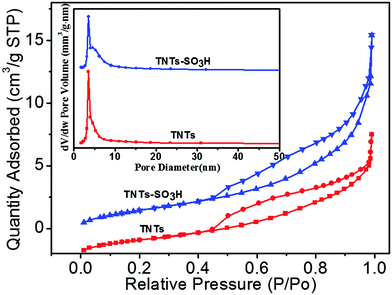 | ||
| Fig. 2 Nitrogen gas adsorption–desorption isotherms and pore size distribution curves of TNTs and TNTs–SO3H. | ||
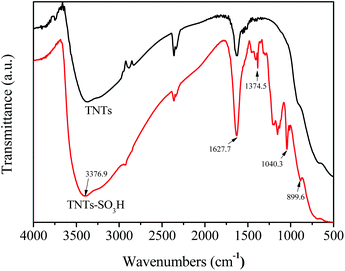
Fig. 3 shows the FT-IR spectra of the pure TNTs and TNTs–SO3H samples. The FT-IR characterization of TNTs is consistent with those reported in the literature.21 The peaks at 3376.9 cm−1 and 1627.7 cm−1 correspond to the –OH stretching and the bending vibrations of the adsorbed water respectively. In the case of TNTs–SO3H, C–H stretching vibrations of silylating agent was observed at 2925 cm−1 and 2825 cm−1. Furthermore, the bands at 1040.3 cm−1 and 899.6 cm−1 can be collectively attributed to Si–O stretching vibrations. The band at 1374.5 cm−1 corresponds to the stretching frequency of S![[double bond, length as m-dash]](https://www.rsc.org/images/entities/char_e001.gif) O in SO3H, which is consistent with the reported IR spectra for –SO3H.22
O in SO3H, which is consistent with the reported IR spectra for –SO3H.22
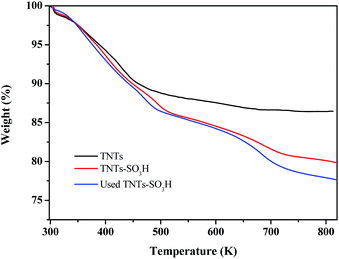
The thermal stability of TNTs and TNTs–SO3H was confirmed by TGA as displayed in Fig. 4. The TGA curve of TNTs shows an initial weight loss (4 wt%) below 373 K, which corresponds to the loss of the physically adsorbed water. At approximately 425 K, the TG curve was slightly inflected, possibly corresponding to the dehydration of interlayer water.23 In the TGA curve of TNTs–SO3H a mass loss of approximately 8% weight occurred between 473 and 823 K, corresponding to the loss of the covalently bound organic group. Simultaneously, from the TGA, it is understood that TNTs–SO3H has greater thermal stability, confirming that it can be used in organic reactions in the range of 353–473 K.
The acidity of the catalyst can be effectively evaluated by determining the Hammett acidity functions (H0) using UV-visible spectroscopy. The H0 can be expressed as:
| H0 = pK(I)aq + log([I]s/[IH+]s) |
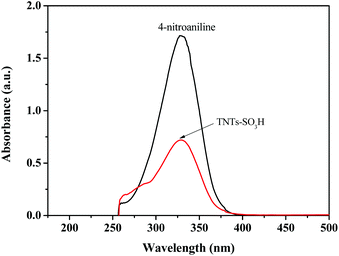
The UV-vis spectra of 4-nitroaniline with the concentration of 1.40 × 10⁻⁴ mol L−1 in CCl4 solution is displayed in Fig. 5. The maximal peak was observed at 329 nm and the corresponding absorbance value was 1.725. After addition of TNTs–SO3H, the absorbance value of the unprotonated form of the indicator was decreased to 0.718, indicating that the indicator is partially in the form of [IH+]s. According to the Lambert–Beer's law, the value of [I]s/[IH+]s can be determined and calculated. TNTs–SO3H showed H0 value of 0.84. The total acid density of the catalyst determined by NaOH titration was around 0.50 mmol g−1.
3.2 Catalytic activity
In the present study, the reaction products, n-butyl levulinate (BL) and pseudo n-butyl levulinate (pseudo-BL), were detected by GC-MS; the corresponding GC-MS spectra are shown in Fig. S1.† Similar results have recently been found by Ciptonugroho et al.24 The catalytic performances of all the materials, i.e., TNPs, TNTs and TNTs–SO3H, were investigated for LA conversion and the results are shown in Table 1. Blank experiment was performed without addition of any catalyst, in which the conversation of LA was calculated to be 6.3% (Table 1, entry 1). In contrast, the presence of catalysts resulted in higher product yields than that corresponding to the blank reaction reference, revealing the necessity of an acid catalyst to carry out this reaction. For TNPs, 11.0% LA conversion with 44.6% BL selectivity is obtained (Table 1, entry 2). This may be because TNPs as a mild Lewis acid catalysts catalyze this reaction.25 The conversion of LA is 15.4% with 64.9% BL selectivity when catalyzed by TNTs (Table 1, entry 3). The enhanced reaction activity may be ascribed to the TNTs with open-tubular structure, providing more active sites. However, when TNTs are used as catalyst and the reaction time is further increased to 6 h, the conversion of LA only reaches 25.5% (Table 1, entry 4). Moreover, TNPs–SO3H obtained from TNPs using the same preparation method was used as a catalyst, resulting in a quantitative LA conversion (Table 1, entry 5). This implies that an acid catalyst with a moderate density and the acid strength of the acidic sites might be required to allow this reaction to proceed effectively. As for the TNTs–SO3H, it exhibits higher catalytic activity (Table 1, entries 6 and 7).| Entry | Catalyst | Time/h | LA Conversion/% | Selectivity/% | |
|---|---|---|---|---|---|
| BL | Pseudo-BL | ||||
| a Experimental conditions: 1 mmol of LA, 5 mmol of n-butanol, 5 wt% catalyst loading, 383 K. | |||||
| 1 | — | 2 | 6.3 | 36.8 | 63.2 |
| 2 | TNPs | 2 | 11.0 | 44.6 | 55.4 |
| 3 | TNTs | 2 | 15.4 | 64.9 | 35.1 |
| 4 | TNTs | 6 | 25.5 | 80.4 | 19.6 |
| 5 | TNPs–SO3H | 2 | 27.9 | 81.5 | 18.5 |
| 6 | TNTs–SO3H | 2 | 37.5 | 84.4 | 15.6 |
| 7 | TNTs–SO3H | 4 | 48.2 | 97.0 | 3.0 |
It is worth noting that the conversion of LA improves to 48.2% after 4 h with 97% selectivity of n-BL. This is due to the grafted accessibility of the SO3H sites in catalyst, which is able to facilitate the reaction. Moreover, the dispersing property of catalyst in reaction media was improved. In view of the relative dimensions of LA and pseudo-BL, the pore openings of TNTs–SO3H should allow these molecules to freely diffuse inside the pore system of the TNTs–SO3H and reach both internal and external active sites. Overall, the trend in conversion of LA over the prepared catalyst samples is as follows: TNTs–SO3H > TNTs > TNPs.
3.3 Effects of reaction conditions
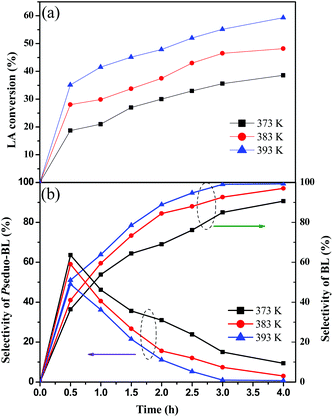
The influence of reaction temperature and time on LA esterification over TNTs–SO3H was further investigated and the results are shown in Fig. 6. At a lower temperature (373 K), the conversion of LA is 38.6% after 4 h of reaction. The conversion increased to 48.2% and 59.3% on carrying out the reaction at 383 and 393 K respectively. The obtained results show that at high reaction temperature, the reaction had a high conversion. The selectivity of BL increases on increasing the reaction time from 0.5 to 4 h, whereas the selectivity of pseudo-BL initially increases and then decreases with reaction time. This reveals that the pseudo-BL is an intermediate product during the reaction process. At 383 and 393 K, the selectivity of BL improves to 97% and 99.3%, respectively. This is probably due to the fact that the efficient collisions between the reactions provide sufficient energy for pseudo-BL conversion into BL at high temperature, and BL selectivity is therefore improved.We also investigated the effect of catalyst amount at 393 K. LA conversion and BL selectivity rise to 86.8% and 99.7% by applying 10 wt% of TNTs–SO3H. The increase in both LA conversion and BL selectivity with an increasing catalyst dosage would be attributed to an increase in the availability and number of catalytically active sites.
3.4 Reusability of catalyst
The catalytic stability of the TNTs–SO3H was evaluated in the reaction by performing consecutive batch reactions at 393 K with alcohol acid molar ratio 5![[thin space (1/6-em)]](https://www.rsc.org/images/entities/char_2009.gif) :
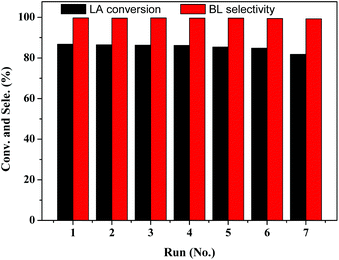
:![[thin space (1/6-em)]](https://www.rsc.org/images/entities/char_2009.gif) 1 and 10 wt% of catalyst loading. After each catalytic cycle, the catalyst was recovered by filtration, washed with acetone and dried overnight at 333 K before reuse. As shown in Fig. 7, it is evident that the catalytic activity of TNTs–SO3H was practically the same even after 7 consecutive cycles with around 80% conversion of LA. In addition, the selectivity of BL on recycled catalyst was almost equal to that over the fresh catalyst. TGA analysis of seven-times used and fresh catalyst are very similar (Fig. 2), evidencing that the –SO3H groups were essentially preserved. In addition, TEM image and FT-IR spectra (Fig. S2 and S3 in the ESI†) of the spent catalyst after repeated experiments show that the TNTs–SO3H structure and surface groups have no noticeable change. Even though a slight activity decay was observed, which might be due to mass loss of the catalyst during several recycling runs, LA conversion decreases only from 86.8% to 81.2% in 7 cycles. It can be concluded that the catalyst can be reused without considerable loss in activity.
1 and 10 wt% of catalyst loading. After each catalytic cycle, the catalyst was recovered by filtration, washed with acetone and dried overnight at 333 K before reuse. As shown in Fig. 7, it is evident that the catalytic activity of TNTs–SO3H was practically the same even after 7 consecutive cycles with around 80% conversion of LA. In addition, the selectivity of BL on recycled catalyst was almost equal to that over the fresh catalyst. TGA analysis of seven-times used and fresh catalyst are very similar (Fig. 2), evidencing that the –SO3H groups were essentially preserved. In addition, TEM image and FT-IR spectra (Fig. S2 and S3 in the ESI†) of the spent catalyst after repeated experiments show that the TNTs–SO3H structure and surface groups have no noticeable change. Even though a slight activity decay was observed, which might be due to mass loss of the catalyst during several recycling runs, LA conversion decreases only from 86.8% to 81.2% in 7 cycles. It can be concluded that the catalyst can be reused without considerable loss in activity.
Furthermore, in order to investigate the heterogeneity of the catalytic reaction, a hot filtration experiment was run. After 2 h, the catalyst was separated by centrifugation and the filtrate was further stirred for another 12 h at 393 K. It was found that no product was detected, indicating that the catalytic reaction is predominantly heterogeneous.
3.5 Proposal for a possible mechanism
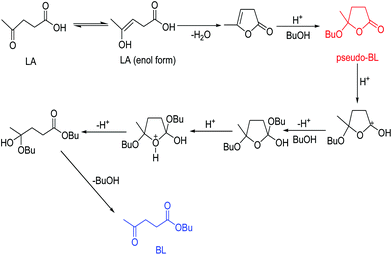
According to above-obtained results, the mechanism proposed for the conversion of LA to BL is shown in Scheme 2. It is similar to that recently reported by Al-shaal et al.26 and Ciptonugroho et al.24 The enol form of LA can undergo intramolecular lactonization to afford α-angelica lactone, followed by the electrophilic addition of n-butanol to obtain the intermediate product pseudo-BL. Subsequently, the protonation of pseudo-BL, in turn, facilitates another nucleophilic addition and ring opening occurs resulting in BL.4. Conclusion
Herein, titanate nanotubes-bonded organosulfonic acid as a novel solid acid catalyst was successfully prepared, and it exhibited good catalytic performance for esterification of biomass-derived LA with n-butanol. A high conversion of LA and desired product (BL) selectivity were achieved under relatively mild conditions. It was noted that the catalyst retains its good catalytic performance even after seven consecutive reaction cycles. These results indicated that TNTs–SO3H nanocatalysts are useful as eco-friendly and ideal materials for esterification and biomass-based production.Conflicts of interest
There are no conflicts to declare.Acknowledgements
This work was supported by the National Natural Science Foundation of China (Grant No. 21606082, 21776068) and Scientific Research Fund of Hunan Provincial Education Department (Grant No. 15C0816, 16C0114).Notes and references
- M. J. Climent, A. Corma and S. Iborra, Green Chem., 2014, 16, 516–547 RSC.
- F. D. Pileidis and M.-M. Titirici, ChemSusChem, 2016, 9, 562–582 CrossRef CAS PubMed.
- K. Yan, C. Jarvis, J. Gu and Y. Yan, Renewable Sustainable Energy Rev., 2015, 51, 986–997 CrossRef CAS.
- A. Démolis, N. Essayem and F. Rataboul, ACS Sustainable Chem. Eng., 2014, 2, 1338–1352 CrossRef.
- Y.-H. Chung, T.-H. Peng, H.-Y. Lee, C.-L. Chen and I. L. Chien, Ind. Eng. Chem. Res., 2015, 54, 3341–3354 CrossRef CAS.
- P. Demma Carà, R. Ciriminna, N. R. Shiju, G. Rothenberg and M. Pagliaro, ChemSusChem, 2014, 7, 835–840 CrossRef PubMed.
- H. J. Bart, J. Reidetschlager, K. Schatka and A. Lehmann, Ind. Eng. Chem. Res., 1994, 33, 21–25 CrossRef CAS.
- J. Li, X. Wang, G. Chen, D. Li, Y. Zhou, X. Yang and J. Wang, Appl. Catal., B, 2015, 176–177, 718–730 CrossRef CAS.
- S. Dharne and V. V. Bokade, J. Nat. Gas Chem., 2011, 20, 18–24 CrossRef CAS.
- X. Zhou, Z. X. Li, C. Zhang, X. P. Gao, Y. Z. Dai and G. Y. Wang, J. Mol. Catal. A: Chem., 2016, 417, 71–75 CrossRef CAS.
- K. Y. Nandiwale and V. V. Bokade, Chem. Eng. Technol., 2015, 38, 246–252 CrossRef CAS.
- J. Li, D. Li, J. Xie, Y. Liu, Z. Guo, Q. Wang, Y. Lyu, Y. Zhou and J. Wang, J. Catal., 2016, 339, 123–134 CrossRef CAS.
- E. L. S. Ngee, Y. Gao, X. Chen, T. M. Lee, Z. Hu, D. Zhao and N. Yan, Ind. Eng. Chem. Res., 2014, 53, 14225–14233 CrossRef.
- Z. Hu, Y. Peng, Y. Gao, Y. Qian, S. Ying, D. Yuan, S. Horike, N. Ogiwara, R. Babarao, Y. Wang, N. Yan and D. Zhao, Chem. Mater., 2016, 28, 2659–2667 CrossRef CAS.
- D. V. Bavykin, J. M. Friedrich and F. C. Walsh, Adv. Mater., 2006, 18, 2807–2824 CrossRef CAS.
- P. Roy, S. Berger and P. Schmuki, Angew. Chem., Int. Ed., 2011, 50, 2904–2939 CrossRef CAS PubMed.
- J. Tripathy, K. Lee and P. Schmuki, Angew. Chem., Int. Ed., 2014, 126, 12813–12816 CrossRef.
- T. Kasuga, M. Hiramatsu, A. Hoson, T. Sekino and K. Niihara, Adv. Mater., 1999, 11, 1307–1311 CrossRef CAS.
- M. Kitano, K. Nakajima, J. N. Kondo, S. Hayashi and M. Hara, J. Am. Chem. Soc., 2010, 132, 6622–6623 CrossRef CAS PubMed.
- C.-H. Lin, S.-H. Chien, J.-H. Chao, C.-Y. Sheu, Y.-C. Cheng, Y.-J. Huang and C.-H. Tsai, Catal. Lett., 2002, 80, 153–159 CrossRef CAS.
- T. Kubo and A. Nakahira, J. Phys. Chem. C, 2008, 112, 1658–1662 CAS.
- S. V. Atghia and S. Sarvi Beigbaghlou, J. Organomet. Chem., 2013, 745, 42–49 CrossRef.
- Y. Suzuki and S. Yoshikawa, J. Mater. Res., 2004, 19, 982–985 CrossRef CAS.
- W. Ciptonugroho, M. G. Al-Shaal, J. B. Mensah and R. Palkovits, J. Catal., 2016, 340, 17–29 CrossRef CAS.
- K. Nakajima, R. Noma, M. Kitano and M. Hara, J. Phys. Chem. C, 2013, 117, 16028–16033 CAS.
- M. G. Al-Shaal, W. Ciptonugroho, F. J. Holzhauser, J. B. Mensah, P. J. C. Hausoul and R. Palkovits, Catal. Sci. Technol., 2015, 5, 5168–5173 CAS.
Footnote |
| † Electronic supplementary information (ESI) available: The GC-MS spectra of the reaction products, TEM image and FT-IR spectra of the spent catalyst. See DOI: 10.1039/c7ra12994g |
| This journal is © The Royal Society of Chemistry 2018 |


