
 Open Access Article
 This Open Access Article is licensed under a Creative Commons Attribution-Non Commercial 3.0 Unported Licence
A study on the preparation of pitch-based high-strength columnar activated carbon and mechanism of phenol adsorption from aqueous solution†
Peng Yao ,
Jianmeng Cen,
Mengxiang Fang*,
Tao Wang and
Qinhui Wang
,
Jianmeng Cen,
Mengxiang Fang*,
Tao Wang and
Qinhui Wang
State Key Laboratory of Clean Energy Utilization, Zhejiang University, Hangzhou 310027, P. R. China. E-mail: mxfang@zju.edu.cn
First published on 15th May 2018
Abstract
Coal tar pitch was ground into powder and hydroformed with high pressure. After pre-oxidation, the pitch was activated by CO2 at high temperature. The effects of different preparation conditions on the yield, pore structure and phenol adsorption capacity of activated carbon were investigated, and activated carbon prepared under suitable conditions had good adsorption performance. A pore volume of 1–10 nm is the main absorption structure according to the analysis of pore size distribution and phenol adsorption capacity. The activated carbon showed high mechanical strength through compressive strength tests. Graphite nanocrystals around 5 nm were observed in the TEM images, and it illustrates that grain refinement results in the high strength. These nanocrystal stacked structures are easier to make and enlarge pores by activation than graphite layer stacked structures. Surface functional groups are considered not to be the active sites of phenol adsorption as suggested by the results of FTIR and Boehm's titration, and acidic oxygen-containing functional groups are harmful to phenol adsorption, which happen to be removed in the reductive preparation atmosphere. The donor–acceptor complex mechanism can be ruled out, and the π–π interactions are considered the most likely mechanism. The Langmuir and Redlich–Peterson models are better fitted to the adsorption isotherms. Adsorption kinetics fit the intraparticle diffusion model best. Comparison of different activated carbons shows that suitable pore size is important for phenol adsorption. Thermodynamic parameters demonstrate that the adsorption process is spontaneous and exothermic, and the entropy increases. Pitch-based high-strength columnar activated carbon is an effective and low cost adsorbent for phenol wastewater treatment. This carbon nanocrystal material also provides a new direction for catalyst carriers.
1. Introduction
Wastewater with a high content of phenols produced by the coal pyrolysis process has become an important problem for the coal chemical industry. Petrochemical, pharmaceutical, dyeing and other industrial wastewaters also contain phenolic compounds. With high toxicity and poor biodegradability, phenol and its derivatives should be removed before discharge.1 There are various methods of phenol wastewater treatment,2 such as extraction, chemical oxidation, physical adsorption, electrolysis, biological processes and so on. Among these methods, physical adsorption receives more attention, and the key issue is developing high capacity and stable adsorbents. There are some commonly used adsorbents: activated carbon, polymer materials (resin), clay, zeolite, mineralized waste, biological materials (agricultural solid waste) and so on.3–8 Activated carbon has a strong adsorption capacity and stable chemical properties, and it's already widely studied and used for wastewater treatment.9With the development of coal pyrolysis technology, coal tar pitch utilization has been attracting more interest from researchers.10–12 Coal tar pitch can also be converted into activated carbon and used for adsorption treatment of phenol wastewater. Activated carbons from different raw materials have great differences in performance.13–15 Usually, the raw materials with higher carbon content show better capacity, so it's important to minimize the ash and other impurities of coal tar pitch. Apart from raw materials, another factor that affects the performance of activated carbons is the activation process. Compared with KOH, H3PO4, CaCl2 and other activators, gas activators can produce higher phenol adsorption properties,16 such as CO2. Because activated carbon activated by CO2 has adequate mesoporous structures.17 The two main factors that affect the phenol adsorption of activated carbon are specific surface area and surface functional groups. Modification can enhance the phenol adsorption capacity of activated carbon, such as reducing acid functional groups, increasing basic functional groups, increasing specific surface area, and increasing surface non-polarity and hydrophobic.18,19 Activated carbon in small size has better adsorption efficiency and capacity. Taking the cost into account, regeneration of activated carbon is important for the treatment of phenol wastewater. However, the powdered activated carbon is inconvenient for recycling and regeneration, so formed activated carbon is needed. Exactly, coal tar pitch has good plasticity and can be formed into various shapes. Some studies suggest that the coal tar pitch is thermosetting after pre-oxidation. In addition, coal tar pitch is prone to be pyrolyzed to produce volatiles and make pores at high temperature. It's suitable to prepare formed activated carbon.
In this study, coal tar pitch was pre-treated of hydro-forming with high pressure and pre-oxidation. Then activated carbon was prepared by CO2 activation at high temperature. This preparation process is only suitable for coal tar pitch, while biomass and other raw materials can only be formed after activation which may cause damage and blockage to the pore structure. No adhesive was used, and the strength of activated carbon was found to be very high. In addition, the adsorption properties of phenol were studied, the microstructures and surface properties of activated carbon was analyzed, and adsorption mechanism was deduced.
2. Materials and methods
2.1 Raw materials
Coal tar pitch used in this study was got from the 1 MWt coal pyrolysis and combustion poly-generation system20 which developed by Zhejiang University. Shanxi Yulin coal was pyrolyzed at 580 °C in fluidized bed pyrolysis reactor using the produced pyrolysis gas as the fluidizing air. The coal tar produced by coal pyrolysis was subjected to vacuum distillation, and light fractions below 400 °C (atmospheric equivalent) were separated. The remaining pitch was used as the raw material for the preparation of activated carbon.The proximate and ultimate analysis of coal tar pitch is shown in Table 1. It indicates that carbon content of this pitch is high enough as raw material for activated carbon. The pitch contains 32.92% volatiles. And the volatiles will overflow to make a large number of pores in the carbonization and activation process. It's conducive to the formation of pore structure.
2.2 Preparation of activated carbon
Activated carbon preparation process consisted of four steps: forming, pre-oxidation, carbonation and activation. The pitch was ground smaller than 0.15 mm, and then formed into a columnar shape (5 mm in diameter, 9 mm in length) using a hydraulic forming machine with the pressure of 40 MPa. The preformed pitch particles were pre-oxidized in a tube furnace: passed into standard air, slowly raised the temperature to 250 °C (2 °C min−1) and held for 4 hours. The purpose of the pre-oxidation is making the pitch thermosetting and maintaining the columnar morphology at high temperature.21 Carbonization and activation processes remove of the H, O, N and other elements of the raw material, and activators are used to make and enlarge pores. In these two processes, activation temperature, activation time and activator are decisive influencing factors. In the carbonization process, tube furnace heating rate was 5 °C min−1 (lower heating rate to prevent deformation and breakage), and N2 was passed as a protective gas. It consumed 5.0 g raw materials each time. Activation temperature ranged from 800 °C to 950 °C. Activation time ranged from 0.5 h to 2 h. And the flux of activator CO2 ranged from 0 to 200 mL min−1. The code F800-0.5-50 was used to represent the activated carbon activated at 800 °C, 0.5 h, CO2 flux of 50 mL min−1, with forming and pre-oxidation in advance. The exhaust gas was collected in activation process, and analyzed by GC. The results show that a large amount of CO is produced which provides a reductive atmosphere.By comparing the adsorption capacity, mechanical strength and yield, activated carbon F900-1-100 was selected as a representative sample. The powdered activated carbon P900-1-100 was prepared under the same conditions as reference. Another powdered activated carbon K850-1.5-3 was prepared using KOH. Coal tar pitch was mixed with KOH powder at the ratio of 1![[thin space (1/6-em)]](https://www.rsc.org/images/entities/char_2009.gif) :3, and activated at 850 °C for 1.5 h. Two kinds of columnar activated carbons are shown in Fig. 1.
:3, and activated at 850 °C for 1.5 h. Two kinds of columnar activated carbons are shown in Fig. 1.
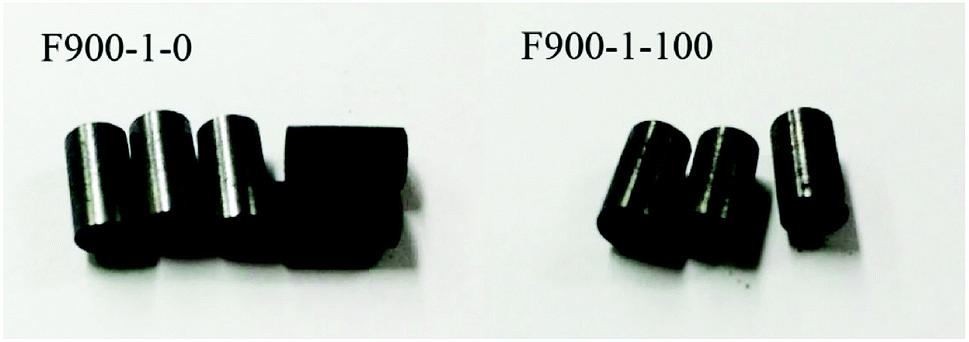 | ||
| Fig. 1 Activated carbons F900-1-0 and F900-1-100. | ||
2.3 Characterizations of activated carbon
The surface physical properties of the activated carbon were characterized using N2 as the adsorbate at 77 K, with Micromeritics ASAP 2460. The BET surface area was evaluated with BET equation. Pore volume and pore size distribution22 were calculated by the volume of adsorbate at P/P0 = 0.99.The compressive strength of the activated carbon was tested by the universal material testing machine Zwick/Roell Z020.
The microstructures of activated carbon F900-1-100 were observed under transmission electron microscope (TEM). Another sample of this activated carbon adsorbed 4-chlorophenol and then desorbed. For phenol is composed of C, H, O elements which can't be distinguished from activated carbon in EDX analysis. The chlorine of 4-chlorophenol is in the para-position and has less effect on the phenolic hydroxyl than other chlorophenols. Desorption treatment was sustained for 10 min using alcohol and ultrasonic. The 4-chlorophenol adsorbed weakly was removed to prevent volatilization. Afterwards, EDX analysis was carried out to observe the distribution of chlorine on activated carbon.23
The surface functional groups of raw materials and activated carbons were analyzed by FTIR and XPS. The acidic and basic functional groups of pitch and activated carbons were titrated according to Boehm method.24 Pitch and activated carbons were put into NaHCO3, Na2CO3, NaOH, C2H5ONa and HCl solutions for 24 h. Experimental reagents were all analytical grade, obtained from Sinopharm Co., China. Each sample was sealed, stirred for 24 h and then filtered. The filtrate was titrated with NaOH or HCl to determine the acid or base excess. Different functional groups were calculated based on the consumption of acid or base.25 The surface charge on activated carbon F900-1-100 in solution with different pH was determined by Zetasizer Nano-ZS (Nano particle size & Zeta potential analyser).
2.4 Adsorption studies
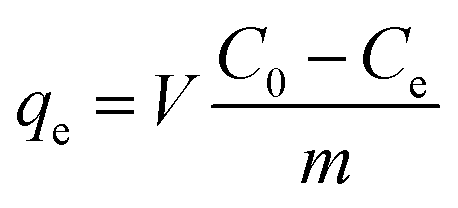
Phenol solution was diluted by deionized water into concentrations ranging from 100 to 1000 mg L−1. Phenol wastewater from coal pyrolysis contains phenols thousands of milligrams per liter, so high concentration phenol solution can be used as the model of phenol wastewater. The concentrations of phenol solution were determined by high performance liquid chromatography (HPLC) at 270 nm for phenol. Each determination was performed three times.The phenol adsorption capacity qe (mg g−1) of activated carbon was measured, and it was evaluated by the equation:
 | (1) |
Adsorption isotherms of activated carbon F900-1-100 were carried out with the initial concentrations of phenol solution range from 100 to 1000 mg L−1. The weight of activated carbon was 0.2 g, and the volume of phenol solution was 50 mL for each sample. All samples stirred for 2 h and stood for 22 h at 25 °C. The experimental results were fitted with Langmuir, Freundlich and Redlich–Peterson models respectively.26,27 The fitting models are shown in Table 2, and the parameters are constants related to adsorption capacity and intensity.
| Model | Formula | Parameters |
|---|---|---|
| Langmuir | 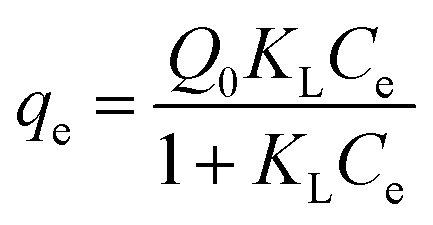 |
KL, Q0 |
| Freundlich | qe = KFCe1/n | KF, n |
| Redlich–Peterson | 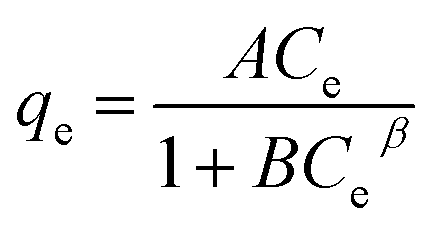 |
A, B, β |
Kinetic experiments on phenol adsorption were performed of activated carbon F900-1-100, P900-1-100, K850-1.5-3 and commercial activated carbon S (powder, steam activation, Sinopharm Co., Ltd. China.), Y (columnar, Yiqing Co. Ltd.) and R (columnar, Ruifeng Co., Ltd.). The initial concentration of phenol solution was 1000 mg L−1. The weight of activated carbon was 1.0 g, and the volume of phenol solution was 250 mL for each sample. All the experiments were kept stirring at 25 °C. Due to the different adsorption rates of formed and powdered activated carbons, different sampling time points were selected according to the pre-experimental results. And the equilibrium time was set as 48 h. The experimental results were fitted with the pseudo-first-order, pseudo-second-order and the Weber–Morris kinetic model.28,29 The fitting models are shown in Table 3, and the parameters are constants related to adsorption capacity and intensity.
| Model | Formula | Parameters |
|---|---|---|
| Pseudo-first-order | 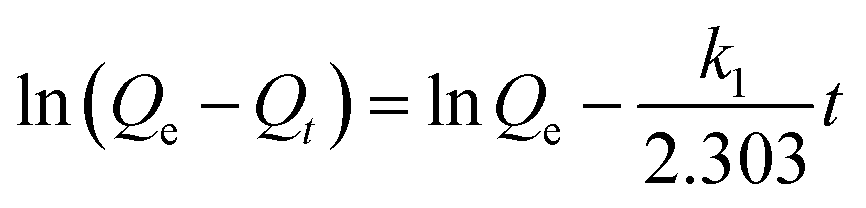 |
k1, Qt |
| Pseudo-second-order | 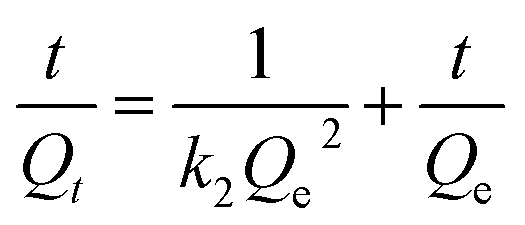 |
k2, Qt |
| Weber–Morris | 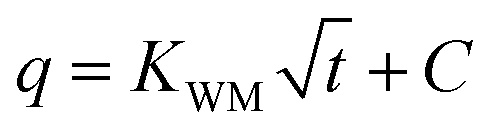 |
KWM, C |
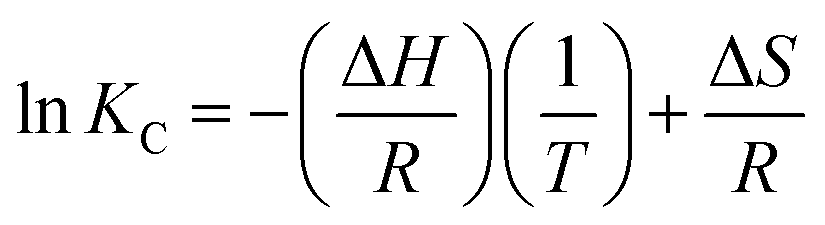
The adsorption isotherms of activated carbon F900-1-100 were measured following the similar procedure at 25 °C, 35 °C and 45 °C respectively. Then the adsorption thermodynamic parameters of the activated carbon were calculated according to the control equation.30,31
|
ΔG = −RTlnKC
| (2) |
| ΔG = ΔH − TΔS | (3) |
 | (4) |
The parameter KL from the Langmuir formula can be used as KC which needs unit conversion and dimensionless first.32,33 According to three sets of T and KC, the thermodynamic parameters (Gibbs free energy change ΔG, enthalpy change ΔH and entropy change ΔS) can be obtained by fitting.
3. Result and discussion
3.1 Pore structure and phenol adsorption properties
Fig. 2 shows the influence of preparation conditions on pore structure of activated carbon (obtained from BET analysis). Among them, the average pore size is calculated by 4V/A. Two of the three variables were controlled respectively (900 °C, 1 h and 100 mL min−1). The influence of preparation conditions on the phenol adsorption capacity of activated carbon is shown in Fig. 3. Pore volume of different sized pores (analyzed by DFT) is shown in Fig. 4. In addition, the BET surface area of activated carbon K850-1.5-3 in Fig. 4 reaches 2751.49 m2 g−1.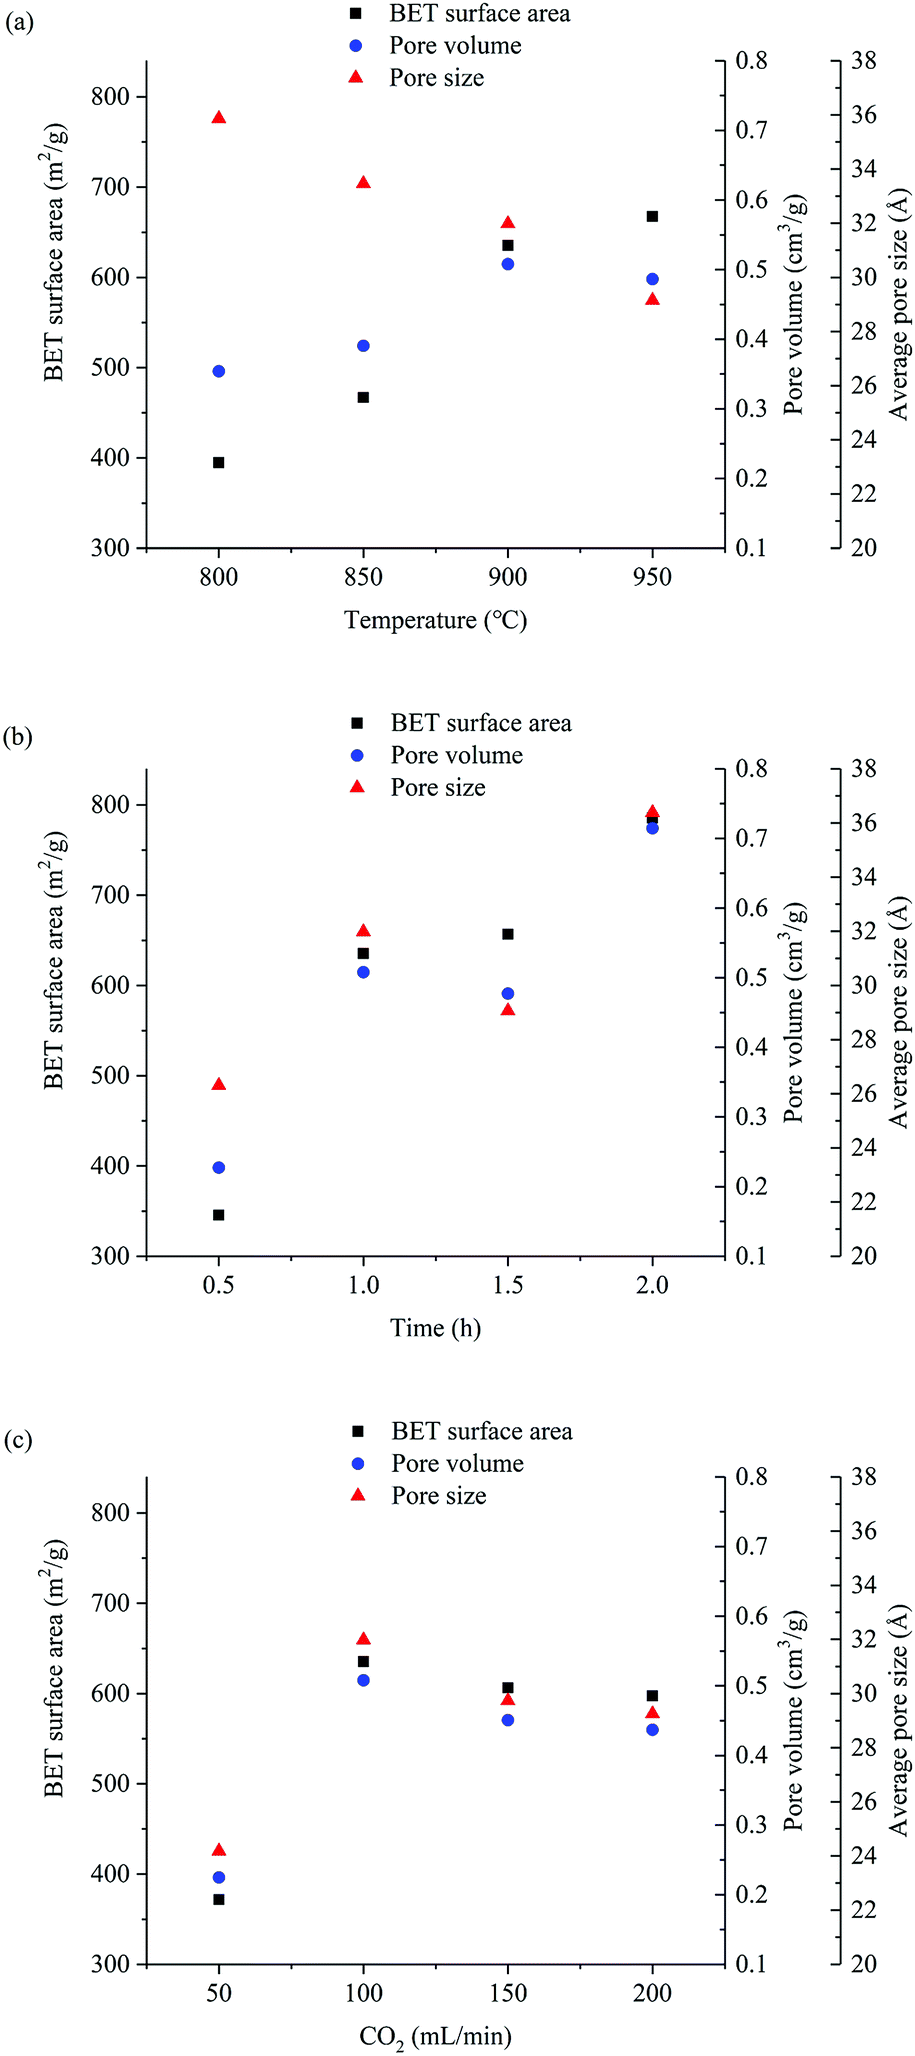 | ||
| Fig. 2 The influence of the preparation conditions on pore size, pore volume and BET specific surface area. (a) The influence of temperature obtained in 1 h, 100 mL min−1 CO2 flux. (b) The influence of time obtained in 900 °C, 100 mL min−1 CO2 flux. (c) The influence of CO2 flux obtained in 1 h, 900 °C. | ||
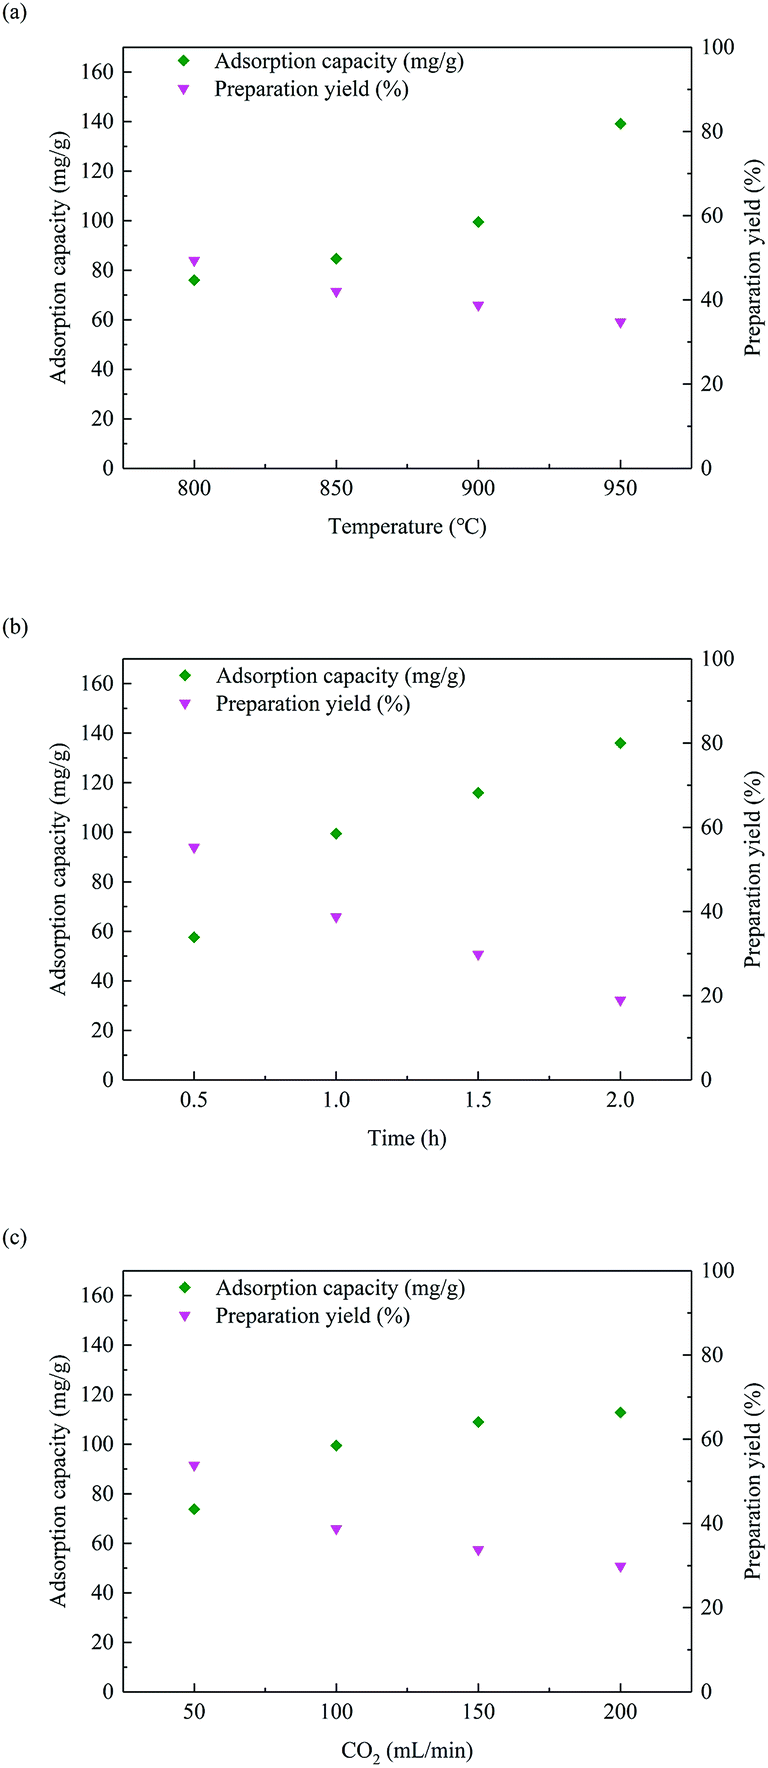 | ||
| Fig. 3 The influence of preparation conditions on phenol adsorption capacity and activated carbon preparation yield. (a) The influence of temperature obtained in 1 h, 100 mL min−1 CO2 flux. (b) The influence of time obtained in 900 °C, 100 mL min−1 CO2 flux. (c) The influence of CO2 flux obtained in 1 h, 900 °C. | ||
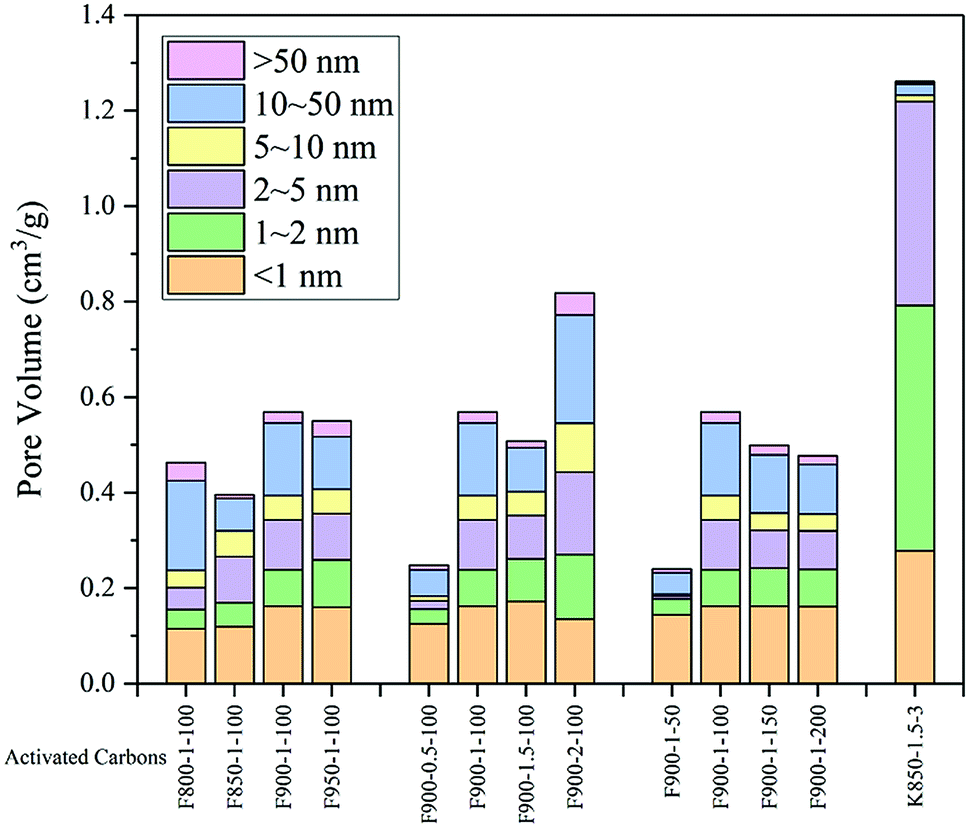 | ||
| Fig. 4 Pore volume of different sized pores of activated carbons (analyzed by DFT). | ||
The BET specific surface area of activated carbon increases with the raise of activation temperature and time, while it first increases then decreases with the raise of CO2 flux. The tendency is different with the phenol adsorption capacity of activated carbons in Fig. 3. It indicates that the phenol adsorption of activated carbon is affected by the specific surface area, but not a positive correlation. For example, the BET specific surface area of F950-1-100 is smaller than F900-2-100, but the phenol adsorption capacity is higher. The phenol adsorption capacity of activated carbons is also related to the surface functional groups.
Average pore size of activated carbon decreases with the increase of activation temperature. It suggests that the increase of activation temperature obtains smaller pore structure. With the increase of the activation temperature, the pore volume of the activated carbon reaches the maximum at 900 °C. Since the smaller average pore size means the smaller pore volume, the pore volume decreases after the highest point.
With the raise of activation time, the average pore size and pore volume of activated carbon shows a tendency of rise-drop-rise. The increase of specific surface area from 0.5 h to 1 h is caused by increase of large pores. When the activation time is extended to 1.5 h, some pores are over activated and destroyed, and some small pores are formed. The pore volume decreases a little, while the specific surface area increases. As the activation time is prolonged to 2 h, micropores are enlarged into mesopores, and new pores are formed continuously.
BET specific surface area, average pore size and pore volume reach the maximum value at 100 mL min−1 of CO2 flux. Because small CO2 flux is not sufficient for complete activation, and excess CO2 flux leads to over activation. Fig. 3 also shows that the high CO2 flux greatly reduces the yield of activated carbon.
As is seen in Fig. 3, the adsorption capacity of activated carbon increases with the activation time, activation temperature and CO2 flux, but activated carbon preparation yield and mechanical strength decreases. The activation temperature influences the preparation yield relatively minimal of three variables, and the activation time has the greatest impact on the yield. The increase of activation temperature improves phenol adsorption capacity much more than activation time and CO2 flux. A smaller amount of yield loss is taken in exchange for a larger adsorption performance increase. Increasing activation temperature gains the biggest benefit. It's considered to benefit from the reduction of oxygen-containing functional groups in high temperature and reductive atmosphere, and details are in the functional group analysis.
Improving the phenol adsorption capacity of activated carbon is accompanied with decrease of preparation yield. The reaction consumes raw material which causes this phenomenon. The mechanical strength of the activated carbon decreases with the preparation yield. In particular, the activated carbon becomes fragile when the yield is less than 30%. The best activation conditions are not only reference to the phenol adsorption capacity, but also to the preparation yield and mechanical strength.
Pore size distributions of different activated carbons can be compared in Fig. 4 (analyzed by DFT). With different activation temperature, activation time and CO2 flux, the pore volume below 1 nm is not significantly correlated with the trend of phenol adsorption capacity, it's considered not the adsorption structure. The pore volume of 1–10 nm is positively correlated with the trend of phenol adsorption capacity according to the change of activation temperature and time, especially the pore volume of 1–2 nm and 2–5 nm. It's the main adsorption structure. The pore volume of 5–10 nm is the functional transition of adsorption and channels. There is no correlation between the pore volume above 10 nm and the phenol adsorption capacity, and it only functions as the channels.
The effect of activation temperature on the phenol adsorption capacity is far greater than the effect on pore volume of 1–10 nm, indicating the joint action of surface functional groups. The activation time has a greater influence on the pore volume of 1–10 nm, and the increase in phenol adsorption capacity is mainly caused by this change. The effect of CO2 flux on the pore volume of 1–10 nm is consistent with BET specific surface area, which is different from the phenol adsorption capacity trend. The increase in phenol adsorption capacity is more determined by the surface functional groups and the increase and expansion of the channels.
Compared to activated carbons activated by CO2, the pore volume of KOH-activated activated carbon K850-1.5-3 is concentrated below 5 nm, and micropores and small mesopores are very abundant. However, pore volume of 5–10 nm and above 10 nm are very small. Although the pore volume of K850-1.5-3 is suitable for phenol adsorption, and it is several times larger than that of activated carbons activated by CO2, but its phenol adsorption capacity is not greatly improved (Fig. 12). The main reason is the severe lack of pores above 5 nm, which acts as channels. A lot of pores are invalid due to the narrow channels and intermolecular force. According to the analysis of adsorption kinetics, K850-1.5-3 can quickly reach the adsorption equilibrium, indicating that unreachable pores rather than lack of diffusion time causes this phenomenon.
3.2 Compressive strength
As is shown in Table 4, the compressive strength of activated carbon is very high. It even reaches some cement standards. So the activated carbon can't be broken easily during the phenol adsorption and regeneration. Compare to F900-1-0, the compressive strength of F900-1-100 is lower. The activation reduced the strength of activated carbon, because more pore structures were generated.| Sample | Compressive strength (MPa) | Elastic modulus (MPa) |
|---|---|---|
| F900-1-0 | 35.06 | 1944.44 |
| F900-1-100 | 21.14 | 1092.01 |
| Portland cement (level of 32.5, reference) | 32.5 |
The activated carbon, with high-strength and rich pores, also meets the requirements of catalyst carrier. Active ingredients can be mixed into coal tar pitch and pressed into the desired shape. The catalysts can be stably and evenly distributed in the pores of activated carbon after carbonization, compared with impregnation method. A huge specific surface area and strong mechanical strength provide a big reaction contact area and stable support. It can also endure high temperature. The activation procedure provides a reductive atmosphere in which carbon and catalyst can be activated at the same time. Reactivation can also regenerate pores structure and catalyst at the same time. The catalysts are easier to recycle and reuse in this carbon-based carrier, especially for precious metals.
3.3 TEM and EDX analysis
The TEM images of activated carbon F900-1-100 is shown in Fig. 5. There are many graphite nanocrystals which stack to the microstructure. The size of nanocrystals is around 5 nm, and they all have similar shapes. Different from other graphite layers stack structures, high strength of this material is caused by the stack of nanocrystals. Grain refinement is considered to strengthen hardness and strength of metals which can be calculated by Hall-Petch formula.34 Similarly, this principle also leads to the high strength of this carbon material that consists of nanocrystals. Thermal processing at high temperature and deformation from hydro-forming causes the grain refinement.35 Dislocation enhancement mechanism also plays a role. Rather than neatly arranged, graphite nanocrystals are stacked in disorder with a large number of dislocations. There are some pores of nanoscale in the TEM images. The gaps between nanocrystals can be enlarged to pores and channels in the activation process. This nanocrystals stack structure is easier to make and enlarge pores by activation than graphite layers stack structure. In addition, an obvious phenomenon of catalytic degradation was found in the related desorption experiments, and the mechanism was potentially related to the nanocrystals. Catalytic sites may come from crystal defects,36 and catalytic metals from the coal tar pitch might form some special structures with the graphite nanocrystals. It needs further study.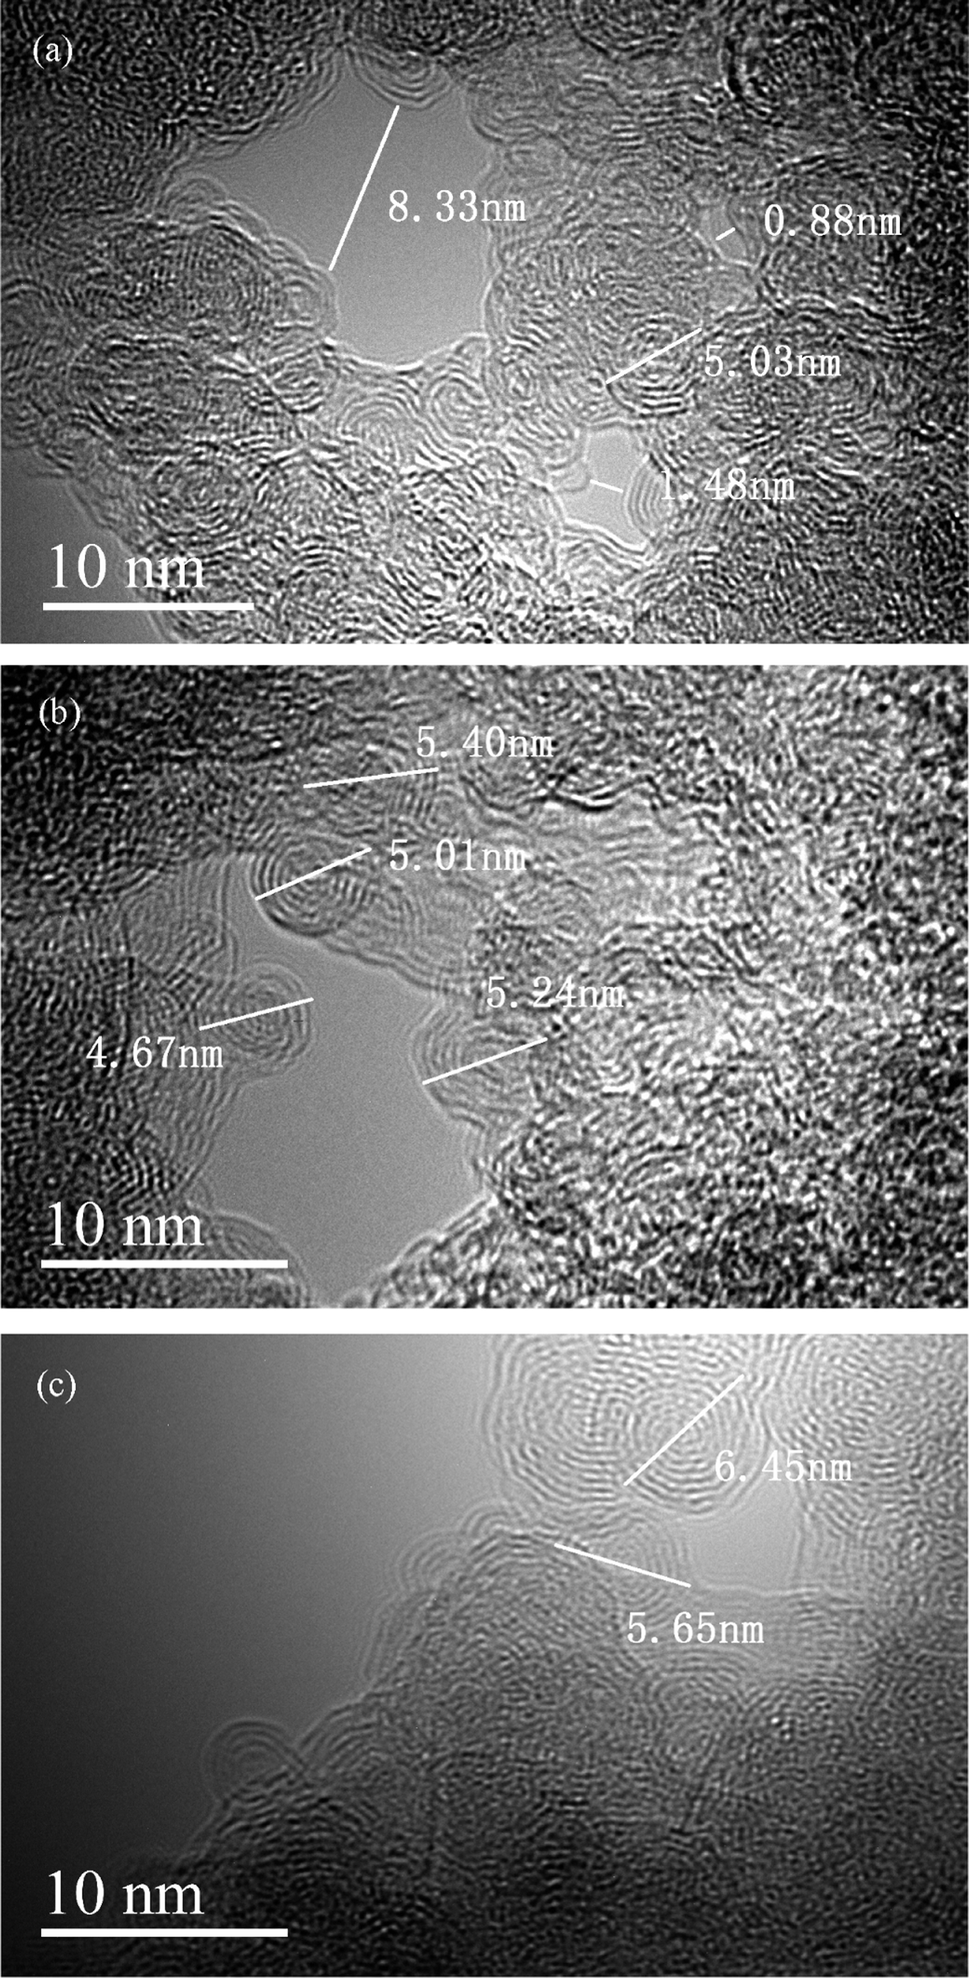 | ||
| Fig. 5 TEM images of the activated carbon F900-1-100. | ||
EDX analysis was carried out to observe the distribution of chlorine elements on activated carbon. Red points are represented of chlorine elements in Fig. 6. It is inferred by the distribution of chlorine that many 4-chlorophenol molecules are adsorbed on the activated carbon. According to the scale in the figure, 4-chlorophenol is adsorbed in the micropores and mesopores of activated carbon which play a major role in phenols adsorption.
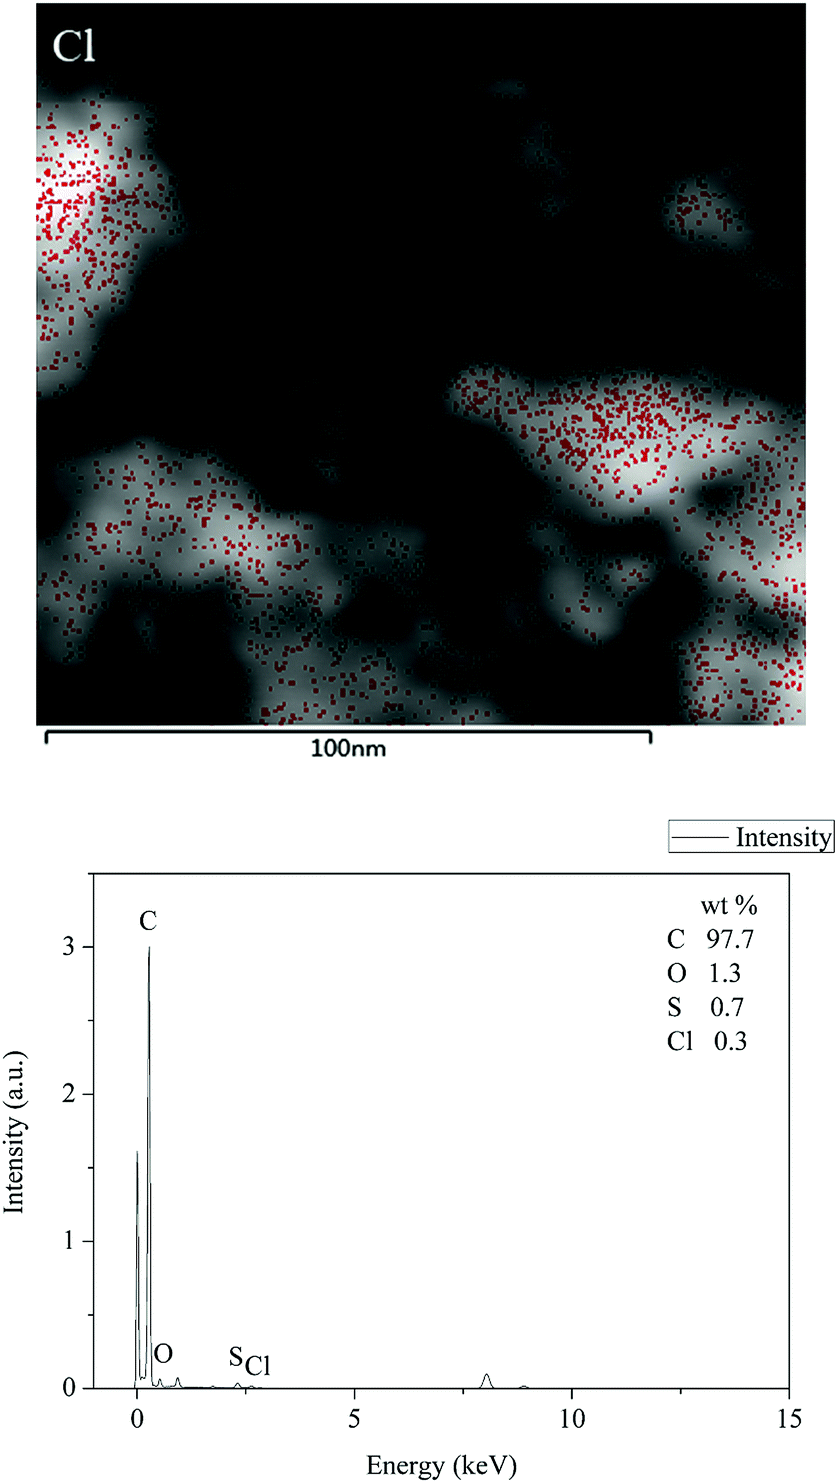 | ||
| Fig. 6 EDX analysis of the activated carbon F900-1-100. | ||
3.4 FTIR analysis and XPS analysis
The results of FTIR analysis are shown in Fig. 7. The surface functional groups of activated carbon are basically determined by the raw material, and the activation process by CO2 does not produce new functional groups. Most surface functional groups are reduced after activation.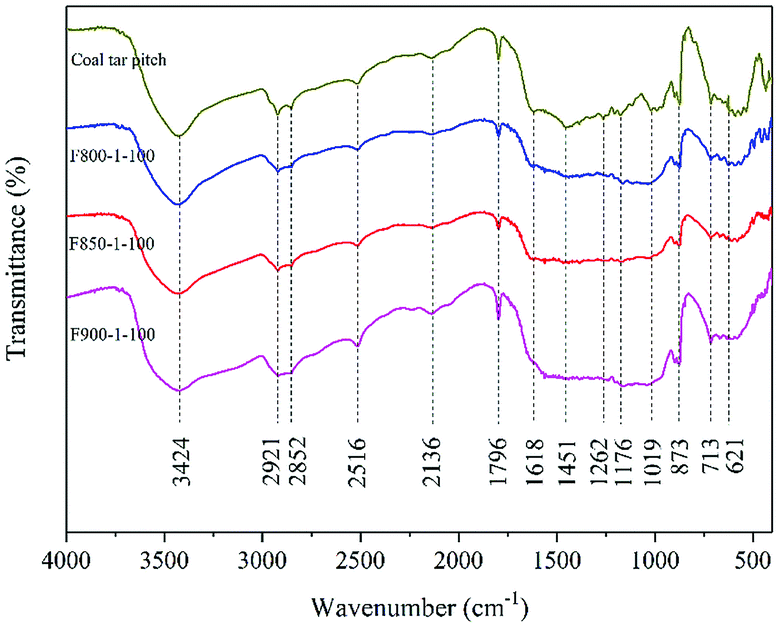 | ||
| Fig. 7 FTIR analysis of pitch and activated carbons. | ||
Both pitch and activated carbons have the band near 3424 cm−1 which indicates the O–H stretching vibration of alcohol or phenol.37,38 It may also come from adsorbed water.39 The peaks at 2921 and 2852 cm−1 are the C–H vibration.40,41 The peak at 2516 cm−1 is O–H stretching from carboxylic acids. The peak at 2136 cm−1 represents C![[triple bond, length as m-dash]](https://www.rsc.org/images/entities/char_e002.gif) C.1 The peak at 1796 cm−1 attributes to the C
C.1 The peak at 1796 cm−1 attributes to the C![[double bond, length as m-dash]](https://www.rsc.org/images/entities/char_e001.gif) O stretching vibration.42 It may come from ketones, aldehydes, lactones, carboxyl groups. The peak at 1618 cm−1 is CC stretching vibration (sp2) and representative of graphite. The peaks at 1451 and 1384 cm−1 are also CC stretching vibration.43,44 The peaks between 900–700 cm−1 may be various C–H bonds or S–O (sulfur was detected by XPS). The peak of 621 cm−1 at lower wave number is attributed to C–S bonds.45
O stretching vibration.42 It may come from ketones, aldehydes, lactones, carboxyl groups. The peak at 1618 cm−1 is CC stretching vibration (sp2) and representative of graphite. The peaks at 1451 and 1384 cm−1 are also CC stretching vibration.43,44 The peaks between 900–700 cm−1 may be various C–H bonds or S–O (sulfur was detected by XPS). The peak of 621 cm−1 at lower wave number is attributed to C–S bonds.45
Pitch has the peaks at 1262, 1204 and 1176 cm−1, but these peaks of activated carbons are weaker or disappeared. These peaks are C–O stretching vibration, which come from phenols, carboxyl, epoxy structures, aromatic ethers and lactone groups.44,46 These kinds of oxygen-containing functional groups are reduced during activation process, and the reductive atmosphere plays an important role. Pitch has the peaks at 1116 and 1019 cm−1 attributed to C–O vibration in alcohol group.42 These peaks of activated carbons are weaker, and they become less and less obvious with the increase of activation temperature. It's conducive to enhance the hydrophobic property of activated carbons.
As the decrease of surface functional groups, especially oxygen-containing functional groups, the phenol adsorption capacity of activated carbon is enhanced. Higher temperature diminishes more surface functional groups which causes more promotion of phenol adsorption capacity. Some studies also come to conclusion that oxygen-containing functional groups are harmful to the phenol adsorption on activated carbon.43
Fig. 8 shows the XPS spectrum analysis of the activated carbon F900-1-100. The full scan XPS spectrum indicates that the sample consists of C, O and S elements. Similar with the result of EDX, it also shows that the ash content is not so high.
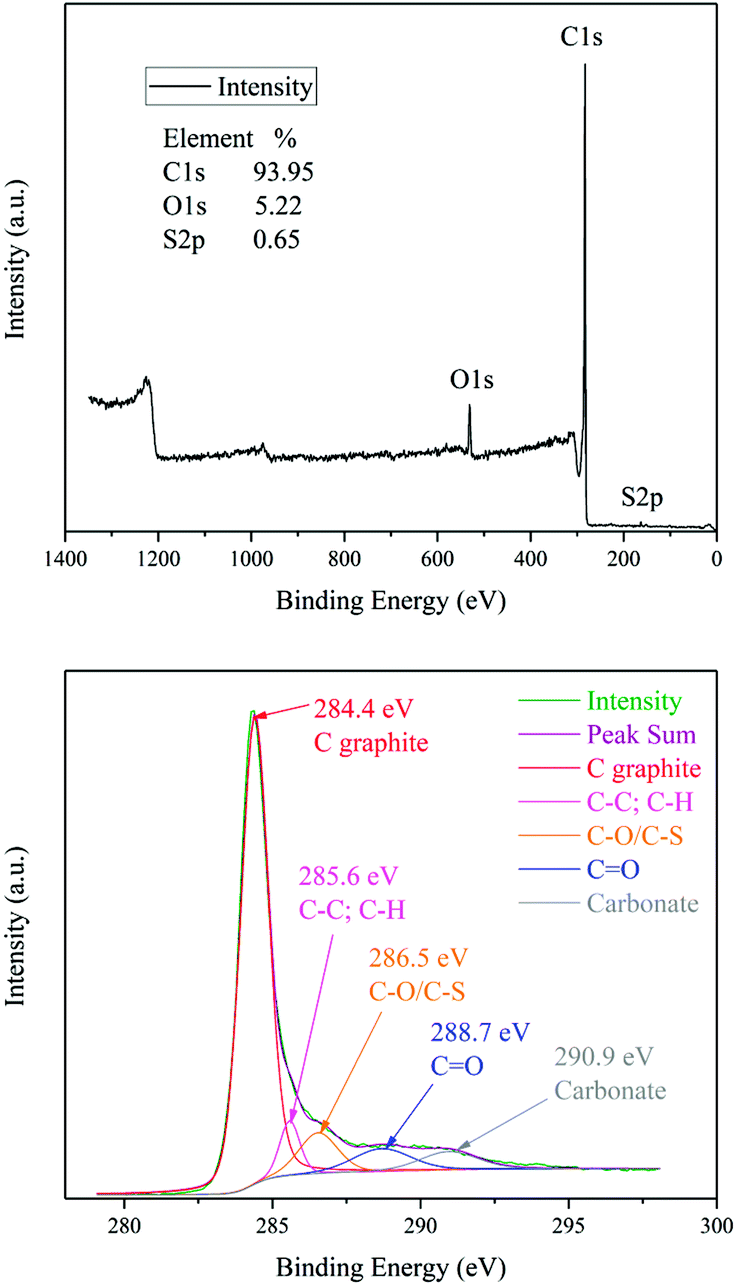 | ||
| Fig. 8 XPS analysis of activated carbon F900-1-100. | ||
The high-resolution spectrum of C 1s can be fitted into five main wide peaks centered at 284.4, 285.6, 286.5, 288.7 and 290.9 eV, which are respectively attributed to C graphite, C–C/C–H, C–O/C–S, CO and carbonate bonds.45 These is consistent with the results of FTIR. The maximum peak is CC/C–C at 284.4 eV, and it indicates that graphite is the main structure of the sample. Graphite are hexagonal layered crystals, and each carbon atom is attached to three adjacent carbon atoms with covalent bonds formed by sp2 hybridized electrons. Unhybridized electrons in parallel p orbitals form π bonds. Thus, there are a lot of π electrons in this sample. The peak area of carbonyl group (CO) is relatively small when compared with CC/C–C bonds, and the specific content of carbonyl groups need to be determined by titration.
3.5 Boehm's titration and zeta potential
The results of Boehm's titration of pitch, activated carbon F900-1-100 and P900-1-100 are shown in Table 5.| Sample | Acidic functional groups (mmol g−1) | Basic group (mmol g−1) | |||
|---|---|---|---|---|---|
| Carboxylic | Lactonic | Phenolic | All | ||
| Pitch | 0.0643 | 0.0393 | 0.0773 | 0.2175 | 0.0732 |
| P900-1-100 | 0.0935 | 0.0673 | 0.1594 | 0.3404 | 0.8515 |
| F900-1-100 | 0.0816 | 0.0690 | 0.1735 | 0.4036 | 0.9008 |
The acid functional groups on the surface of activated carbons increase a little compared with the raw material, while the basic functional groups increase significantly. On the one hand, the specific surface area of the material increases sharply in the carbonation and activation process, and the surface functional groups increase during the formation of pores. On the other hand, the reductive atmosphere of the activation process reduces some oxygen-containing functional groups that are usually acidic functional groups. Compared with powdered activated carbon, formed activated carbon has more surface functional groups and less specific surface area, although the differences are not much. It mainly affects by the diffusion of the reductive gas, and the contact with the reductive atmosphere causes the difference.
Comparing with the amount of surface functional groups, the amount of phenol adsorbed by activated carbon is much more. The electron donor–acceptor complex mechanism can be ruled out which assumes the carbonyl groups on the surface of activated carbon serving as donors and the aromatic rings of phenols acting as electron acceptors.47 The results of FTIR also show tendency that the increase in activation degree leads to a reduction in surface functional groups, while the phenol adsorption capacity increase at the same time. Therefore, surface functional groups are considered not to be active sites of phenol adsorption.
The solvent effect is also related to the functional groups. Water molecules can be adsorbed on the oxygen-containing functional groups by hydrogen bonding, which is unfavorable for the phenol adsorption as some spaces are occupied. It will also block the diffusion of phenol molecules.
Fig. 9 shows the zeta potential of activated carbon F900-1-100 in different pH solutions, and it indicates that the pHPZC of this activated carbon is about 6.9. During adsorption experiments, the solutions was slightly acidic (pH between 6–7, pH of 1000 mg L−1 phenol solution is around 6). Therefore, the surface of activated carbon is positively charged. At the same time, phenol has a pKa equal to 9.89 and was mostly not ionized in the solutions.48 A small amount of ionized phenol is attracted by the positive charge on the surface of activated carbon, but it plays a negligible role in the adsorption mechanism.
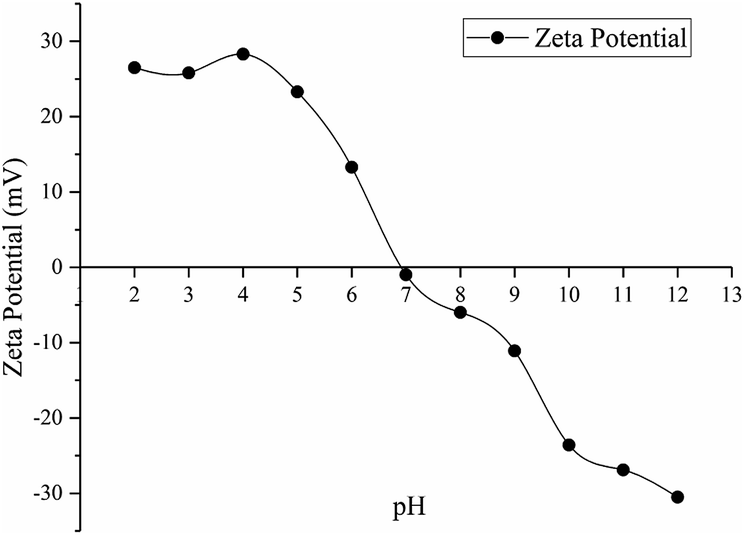 | ||
| Fig. 9 Zeta potential of activated carbon F900-1-100. | ||
Excluding the above possibilities of adsorption mechanism, the π–π interactions are the most likely mechanism which derives from the interactions between the π electrons in the aromatic rings of the phenols and π electrons in the graphite layers.47 As far as the number of π electrons, the amount of phenols adsorbed on the activated carbon is satisfied (refer to XPS results). Electron-rich regions located in non-oxidized carbon play an essential role in phenol adsorption.
3.6 Adsorption isotherms
The fitting curves of activated carbon F900-1-100 adsorption isotherm using Langmuir, Freundlich and Redlich–Peterson adsorption isotherm models are shown in Fig. 10, and the parameters are listed in Table S2 (ESI).†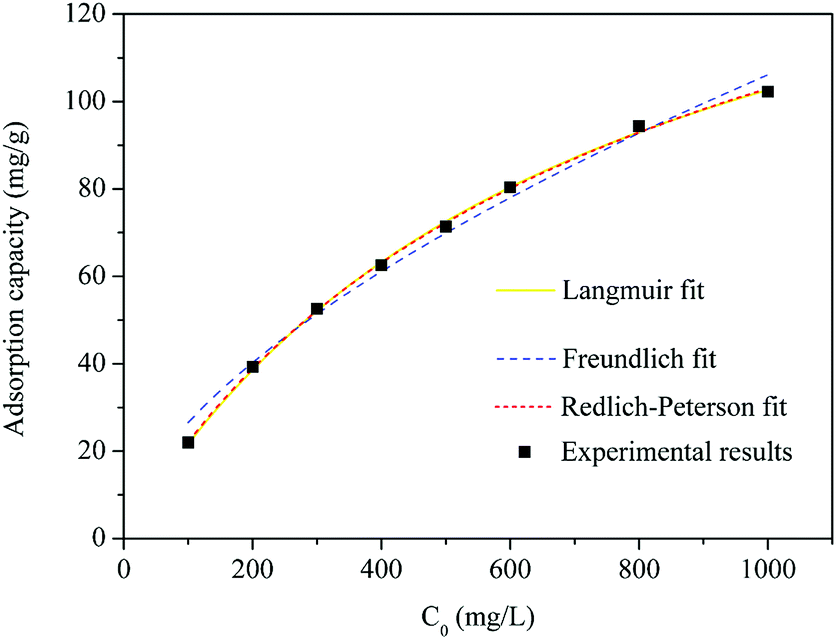 | ||
| Fig. 10 Fitting curves of adsorption isotherm. | ||
The Langmuir model assumes a homogeneous adsorbent surface with identical adsorption sites. The Freundlich model is an empirical formula assuming heterogeneous adsorptive energy on the adsorbent surface. The Redlich–Peterson model is a compromise between Langmuir and Freundlich models. In this study, Langmuir model gives the best fitting for the adsorption isotherms, while another two are reasonably applicable. It is considered that the phenol adsorption of activated carbon is close to the monolayer adsorption. The surface of the activated carbon is a uniform adsorbed surface composed of the same adsorption sites.25 Freundlich model does not have a good fit for isothermal adsorption. It indicates that the adsorption sites of this activated carbon are similar rather than non-uniform. The Redlich–Peterson model combines the characteristics of the Langmuir and Freundlich models, and usually has a better fitting effect. However, the fitting effect of Redlich–Peterson model is not as good as Langmuir model. It is better description of its monolayer adsorption and characteristics of similar adsorption sites.
3.7 Adsorption kinetics
Fig. 11 shows adsorption kinetics of activated carbon F900-1-100, and the fitting parameters are listed in Table S3 (ESI).†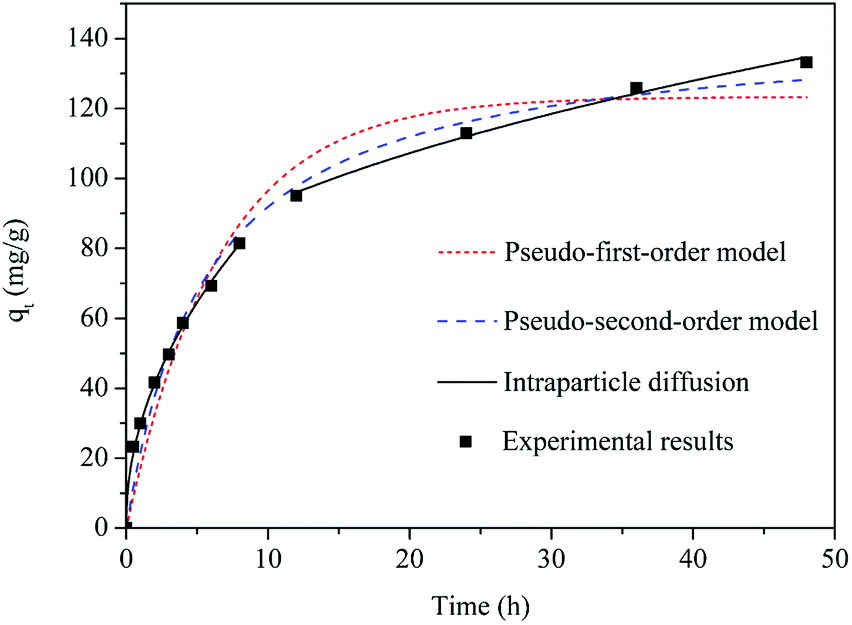 | ||
| Fig. 11 Fitting curves of adsorption kinetics models. | ||
Pseudo-second-order kinetics model is usually used for the fit of small molecules adsorption by adsorbent, and it's in line with the characteristics of phenol adsorption of activated carbon.49 As is shown in Fig. 11, the pseudo-second-order model gives more satisfactory fitting than pseudo-first-order model. Intraparticle diffusion model describes the adsorption process best. The initial sharp increase stage represents the external diffusion of phenol. Then the plateau stage represents the internal diffusion process.50 The phenol molecules are retarded mainly by the diffusion through pore channels, and the formerly adsorbed molecules also have an impact. It can explain the existence of external diffusion process that the fitting curve does not go through the origin.25 Phenol adsorption of activated carbon can be described as: external diffusion through boundary, internal diffusion through pores and channels, adsorbed by the adsorption sites.
Fig. 12 shows the adsorption kinetics of activated carbons prepared from coal tar pitch (F900-1-100, P900-1-100 and K850-1.5-3) and commercial activated carbons (S, Y and R). Activated carbons K850-1.5-3, P900-1-100 and S are powder, and activated carbons P900-1-100, Y and R are columnar. The BET specific surface areas of activated carbons K850-1.5-3, S and F900-1-100 are 2751.49 m2 g−1, 1570.57 m2 g−1 and 635.45 m2 g−1 respectively. With more than four times specific surface area, the phenol adsorption capacity of K850-1.5-3 is only less than two times bigger than F900-1-100, which means the many micropores are invalid. K850-1.5-3 was activated by KOH, and the number of acidic oxygen-containing functional groups was also reduced to a low level. Therefore, the pore size distribution can be recognized as the only explanation of this phenomenon. And the main reason is the severe lack of mesopores above 5 nm of activated carbon K850-1.5-3, which acts as channels.
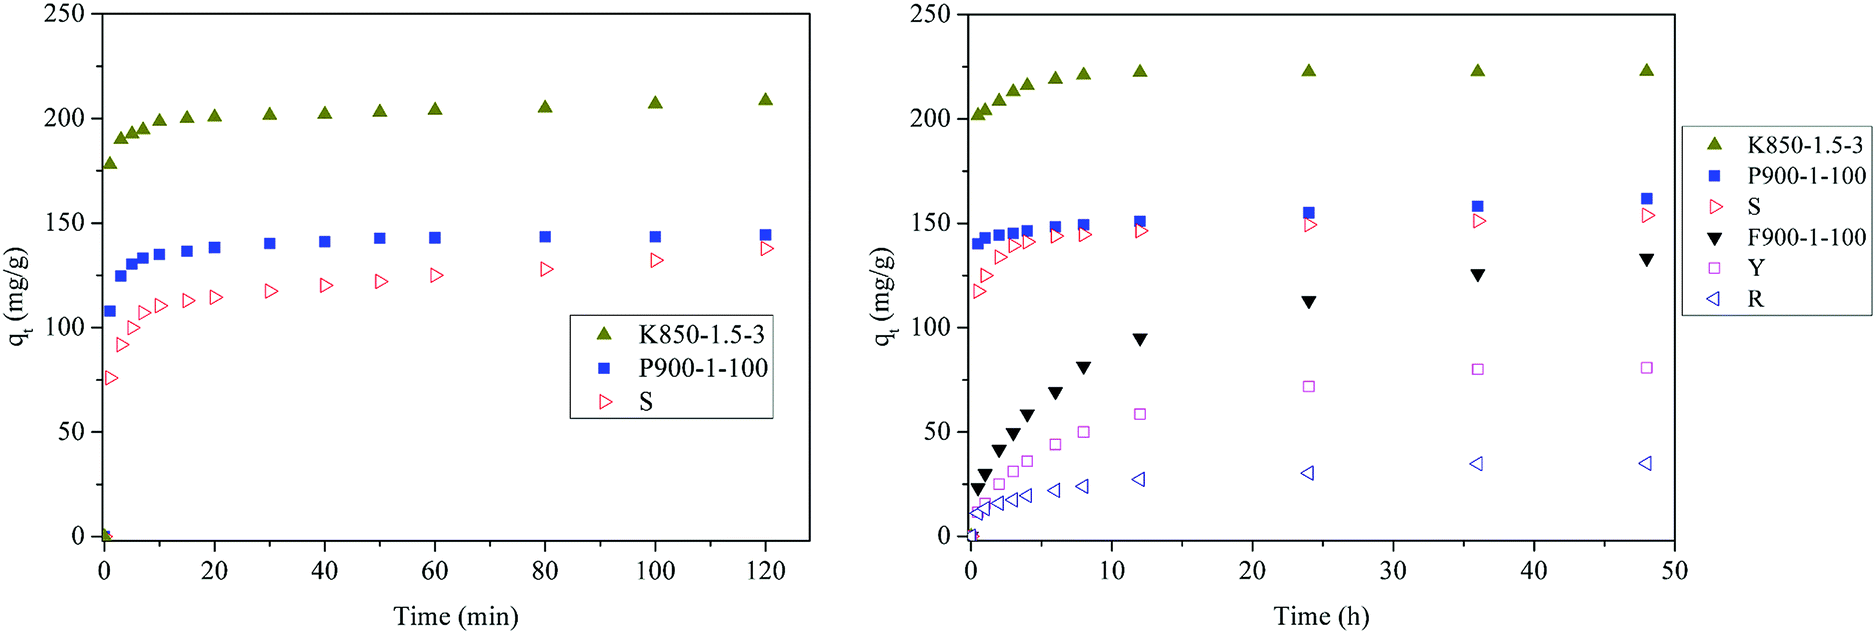 | ||
| Fig. 12 Adsorption kinetics of activated carbon F900-1-100, P900-1-100, K850-1.5-3, S, Y and R. | ||
The phenol adsorption of powdered activated carbons P900-1-100, K850-1.5-3 and S reach equilibrium within a short time, while the adsorption rates of columnar activated carbon F900-1-100, Y and R are relatively slow. It is mainly affected by the spatial effect and diffusion resistance.51 The powdered activated carbons have a relatively large contact area, which greatly reduces the diffusion resistance. F900-1-100 has a better adsorption rate than other commercial activated carbon because of its unique graphite microcrystalline structure. At the expense of slowing the adsorption rate, formed activated carbon is more conducive to separation and regeneration. The problem about increasing adsorption rate needs further study.
K850-1.5-3 and P900-1-100 have a higher adsorption rate compared with formed activated carbon. It is related to the diffusion of phenol in the pore structure of the activated carbon. However, the final phenol adsorption capacities of F900-1-100 and P900-1-100 are close. It suggests that the unique microstructure of F900-1-100 works. Compared with S, P900-1-100 has a higher adsorption rate, as well as a higher final phenol adsorption capacity. It illustrates that this raw material (coal tar pitch) and preparation method are suitable for phenol adsorption.
3.8 Adsorption thermodynamics
The thermodynamic parameters derived from adsorption isotherms at different temperatures are listed in Table 6. According to the value of thermodynamic parameters, the phenol adsorption process of pitch-based activated carbon is spontaneous, entropy increase and exothermic. The positive entropy change indicates the organization of solid/solution interface becomes more random. The magnitude of the ΔH value lies in the range of 2.1–20.9 and 80–200 kJ mol−1 for physical and chemical adsorptions.6 In this study, the absolute value of ΔH can be determined that the adsorption process is closer to the physical adsorption. And it indicates that the π–π interactions (8–12 kJ mol−1) are reasonable. The adsorption takes place between aromatic ring of phenols and graphite layers of activated carbon. It is conducive to regenerate with a little energy consumption. Adsorption and regeneration can be repeated for several times theoretically, but long processing time is needed for phenol diffusion in the desorption process.| Parameters | ΔG (kJ mol−1) | ΔS (J mol−1 K−1) | ΔH (kJ mol−1) |
|---|---|---|---|
| 25 °C | −12.080 | 5.568 | −10.421 |
| 35 °C | −12.136 | ||
| 45 °C | −12.192 |
4. Conclusion
Pitch-based high-strength columnar activated carbon was prepared, and phenol adsorption experiments showed good adsorption performance. A large number of graphite nanocrystals, sized around 5 nm, stack to the microstructure of this activated carbon. Thermal processing and deformation from hydro-forming cause grain refinement which leads to the high strength. Dislocation enhancement mechanism also plays a role. This nanocrystals stack structure is easier to make and enlarge pores by activation than graphite layers stack structure.Phenol adsorption capacity is influenced by the specific surface area, but not a positive correlation. Surface functional groups and pore size also play an important role. Pore volume of 1–10 nm is the main absorption structure according to the analysis of pore size distribution and phenol adsorption capacity. Acidic oxygen-containing functional groups have a harmful influence on phenol adsorption, and they happen to be removed in the reductive atmosphere of preparation process. The electron donor–acceptor complex mechanism is ruled out by surface functional groups analyses. And the π–π interactions are considered the mechanism of phenol adsorption. Langmuir model gives the best fitting for the adsorption isotherms which indicates monomolecular layer adsorption with similar adsorption sites. The intraparticle diffusion model describes the adsorption kinetics best. Plenty of mesopores and unique graphite microcrystalline structure result in the adsorption performance. Thermodynamics studies show a spontaneous, entropy increase and exothermic process of phenol adsorption. It's close to the physical adsorption and conducive to regeneration.
The pitch-based activated carbon is an effective cheap adsorbent for phenolic wastewater treatment. This carbon nanocrystal material also provides a new direction for catalyst carrier.
Conflicts of interest
There are no conflicts to declare.Acknowledgements
This work was financially supported by the National Key R&D Program of China (No. 2016YFE0102500 and No. 2017YFB0603300).Notes and references
- N. G. Rincón-Silva, J. C. Moreno-Piraján and L. Giraldo, Adsorption, 2016, 22, 33–48 CrossRef.
- G. Busca, S. Berardinelli, C. Resini and L. Arrighi, J. Hazard. Mater., 2008, 160, 265–288 CrossRef PubMed.
- M. Ahmaruzzaman, Adv. Colloid Interface Sci., 2008, 143, 48–67 CrossRef PubMed.
- D. Frascari, A. E. M. Bacca, F. Zama, L. Bertin, F. Fava and D. Pinelli, Chem. Eng. J., 2016, 283, 293–303 CrossRef.
- M. Nafees and A. Waseem, Clean: Soil, Air, Water, 2014, 42, 1500–1508 CrossRef.
- R. I. Yousef, B. El-Eswed and A. H. Al-Muhtaseb, Chem. Eng. J., 2011, 171, 1143–1149 CrossRef.
- X. Chai and Y. Zhao, J. Hazard. Mater., 2006, 137, 410–417 CrossRef PubMed.
- K. Singh, B. Chandra and M. Gautam, J. Sci. Ind. Res., 2016, 75, 441–451 Search PubMed.
- A. Dąbrowski, P. Podkościelny, Z. Hubicki and M. Barczak, Chemosphere, 2005, 58, 1049–1070 CrossRef PubMed.
- H. M. Lee, L. K. Kwac, K. H. An, S. J. Park and B. J. Kim, Energy Convers. Manage., 2016, 125, 347–352 CrossRef.
- S. Gao, L. Ge, T. E. Rufford and Z. Zhu, Microporous Mesoporous Mater., 2016, 238, 19–26 CrossRef.
- E. Lorenc-Grabowska, G. Gryglewicz and J. Machnikowski, Energy Fuels, 2009, 23, 2675–2683 CrossRef.
- Q. Miao, Y. Tang, J. Xu, X. Liu, L. Xiao and Q. Chen, J. Taiwan Inst. Chem. Eng., 2013, 44, 458–465 CrossRef.
- N. Douara, B. Bestani, N. Benderdouche and L. Duclaux, Desalin. Water Treat., 2016, 57, 5529–5545 CrossRef.
- K. Pirzadeh and A. A. Ghoreyshi, Desalin. Water Treat., 2014, 52, 6505–6518 CrossRef.
- L. Temdrara, A. Addoun and A. Khelifi, Desalin. Water Treat., 2015, 53, 452–461 CrossRef.
- E. Lorenc-Grabowska, M. A. Diez and G. Gryglewicz, J. Colloid Interface Sci., 2016, 469, 205–212 CrossRef PubMed.
- C. Y. Yin, M. K. Aroua and W. M. A. W. Daud, Sep. Purif. Technol., 2007, 52, 403–415 CrossRef.
- G. Yang, H. Chen, H. Qin and Y. Feng, Appl. Surf. Sci., 2014, 293, 299–305 CrossRef.
- J. Cen, M. Fang, Q. Wang, Z. Luo and K. Cen, Chem. Ind. Eng. Prog., 2011, 30, 88–94 Search PubMed.
- J. Alcañizmonge, M. Pérezcadenas and D. Lozanocastelló, Energy Fuels, 2010, 24, 3385–3393 CrossRef.
- L. A. Rodrigues, L. A. de Sousa Ribeiro, G. P. Thim, R. R. Ferreira, M. O. Alvarez-Mendez and A. D. R. Coutinho, J. Porous Mater., 2013, 20, 619–627 CrossRef.
- Y. Chen, M. Huang, B. Huang and X. Chen, J. Anal. Appl. Pyrolysis, 2012, 98, 159–165 CrossRef.
- H. P. Boehm, Carbon, 1994, 32, 759–769 CrossRef.
- B. Petrova, B. Tsyntsarski, T. Budinova, N. Petrov, L. F. Velasco and C. O. Ania, Chem. Eng. J., 2011, 172, 102–108 CrossRef.
- S. H. Lin and R. S. Juang, J. Environ. Manage., 2009, 90, 1336–1349 CrossRef PubMed.
- L. Giraldo and J. C. Moreno-Piraján, J. Anal. Appl. Pyrolysis, 2014, 106, 41–47 CrossRef.
- L. A. Rodrigues, M. L. C. P. da Silva, M. O. Alvarez-Mendes, A. D. R. Coutinho and G. P. Thim, Chem. Eng. J., 2011, 174, 49–57 CrossRef.
- E. Lorenc-Grabowska, G. Gryglewicz and M. A. Diez, Fuel, 2013, 114, 235–243 CrossRef.
- Y. Yu, Y. Zhuang, Z. Wang and M. Qiu, Chemosphere, 2004, 54, 425–430 CrossRef PubMed.
- Y. Liu, J. Chem. Eng. Data, 2009, 54, 1981–1985 CrossRef.
- Q. Liu, T. Zheng, P. Wang, J. Jiang and N. Li, Chem. Eng. J., 2010, 157, 348–356 CrossRef.
- K. Singh and M. Gautam, J. Environ. Chem. Eng., 2017, 5, 4728–4741 CrossRef.
- C. S. Pande and K. P. Cooper, Prog. Mater. Sci., 2009, 54, 689–706 CrossRef.
- Y. Estrin and A. Vinogradov, Acta Mater., 2013, 61, 782–817 CrossRef.
- M. D'Arienzo, J. Carbajo, A. Bahamonde, M. Crippa, S. Polizzi, R. Scotti, L. Wahba and F. Morazzoni, J. Am. Chem. Soc., 2011, 133, 17652–17661 CrossRef PubMed.
- B. Meryemoglu, S. Irmak and A. Hasanoglu, Fuel Process. Technol., 2016, 151, 59–63 CrossRef.
- A. T. Mohd Din, B. H. Hameed and A. L. Ahmad, J. Hazard. Mater., 2009, 161, 1522–1529 CrossRef PubMed.
- A. Rathinam, J. R. Rao and B. U. Nair, J. Taiwan Inst. Chem. Eng., 2011, 42, 952–956 CrossRef.
- X. Ren, R. Zhang, W. Lu, T. Zhou, R. Han and S. Zhang, Desalin. Water Treat., 2016, 57, 6333–6346 CrossRef.
- Lalhmunsiama, S. Lee, S. S. Choi and D. Tiwari, Metals, 2017, 7(7), 248 CrossRef.
- K. Nath, S. Panchani, M. S. Bhakhar and S. Chatrola, Environ. Sci. Pollut. Res., 2013, 20, 4030–4045 CrossRef PubMed.
- Y. Gokce and Z. Aktas, Appl. Surf. Sci., 2014, 313, 352–359 CrossRef.
- S. Tang, N. Lu, J. Li, K. Shang and Y. Wu, Carbon, 2013, 53, 380–390 CrossRef.
- Y. Zeng, D. Ma, W. Wang, J. Chen, L. Zhou, Y. Zheng, K. Yu and S. Huang, Appl. Surf. Sci., 2015, 342, 136–143 CrossRef.
- L. W. Yam, L. Lim, S. Hosseini and T. S. Y. Choong, Desalin. Water Treat., 2016, 57, 4183–4193 CrossRef.
- S. Haydar, M. A. Ferro-GarcíA, J. Rivera-Utrilla and J. P. Joly, Carbon, 2003, 41, 387–395 CrossRef.
- K. Singh and B. Chandra, Indian J. Chem. Technol., 2015, 22, 11–19 Search PubMed.
- M. Kilic, E. Apaydin-Varol and A. E. Pütün, J. Hazard. Mater., 2011, 189, 397–403 CrossRef PubMed.
- W. P. Cheng, W. Gao, X. Cui, J. H. Ma and R. F. Li, J. Taiwan Inst. Chem. Eng., 2016, 62, 192–198 CrossRef.
- Y. A. Alhamed, J. Hazard. Mater., 2009, 170, 763–770 CrossRef PubMed.
Footnote |
| † Electronic supplementary information (ESI) available. See DOI: 10.1039/c7ra13344h |
| This journal is © The Royal Society of Chemistry 2018 |