 Open Access Article
Fabrication of a superhydrophobic surface with underwater air-retaining properties by electrostatic flocking
Yawen Zheng a,
Xiang Zhou
 *ab,
Zhiqi Xinga and
Tianmin Tuab
aCollege of Chemistry, Chemical Engineering and Biotechnology, Donghua University, Shanghai 201620, China. E-mail: xzhou@dhu.edu.cn
bKey Laboratory of Science & Technology of Eco-Textile (Ministry of Education), Donghua University, Shanghai 201620, China
First published on 19th March 2018
Abstract
The aquatic fern salvinia can retain an air layer on its hairy leaf surface when submerged under water, which is an inspiration for biomimetic applications like drag reduction. In this research, an electrostatic flocking technique is used to produce a hairy surface to mimic the air-trapping performance of the salvinia leaf. Viscose and nylon flocks with different sizes were selected. A volumetric method was established to analyze the air-retaining performance of the flocking samples, Salvinia molesta and lotus leaves as well. Through air volume change analyses, it is found that another factor that can affect the Salvinia molesta air-retaining ability is the curving of the leaf under water. A flocking sample fabricated by a kind of nylon flock is demonstrated to have a comparable air-retaining ability under static conditions as a Salvinia molesta leaf in its flat form.
1. Introduction
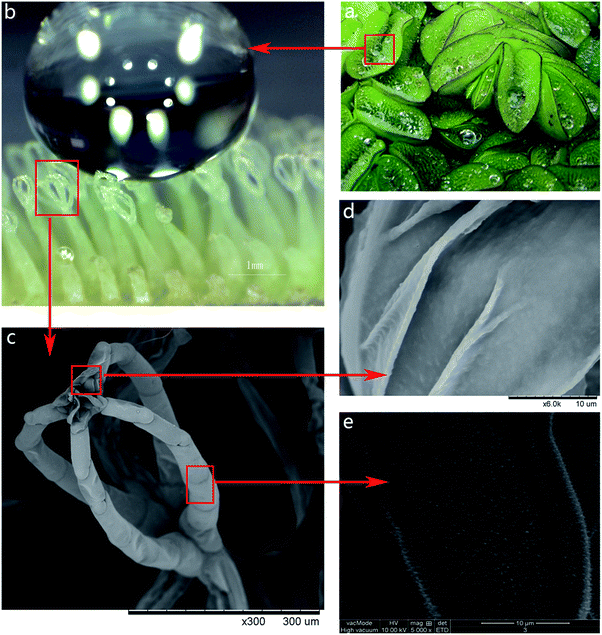
Throughout millions of years, nature has developed and perfected itself in a magical way and it inspires us to create various materials, products and devices with special abilities.1–8 The emerging field of biomimetics is of high scientific and economic interest. One of the classic examples of a biomimetic application is known as the ‘lotus effect’ due to the superhydrophobic and self-cleaning properties of surfaces represented by the lotus leaf.9,10 The rolling water droplet on the leaf surface is in the so-called Cassie–Baxter state with air pockets between water and the micro- and nanostructures of the surface.11When lotus leaves are immersed in water, they display a silvery shine because of the air trapped between the hierarchical surface structures. This is another property associated with the formation of the Cassie–Baxter state on superhydrophobic surfaces – the ability to retain an air layer while submerged under water.12–29 The underwater air layer has gained significant interest with regard to drag reduction, opening possibilities for biomimetic applications such as low-friction fluid transport and drag-reducing ship coatings.14 For such applications the durability of the air layer is of the greatest importance. However, the prototype based on the lotus leaf surface is limited by the short time the air layer persisted. In contrast to species like the lotus leaf, other species such as aquatic ferns of the genus Salvinia were found to have high air layer persistence. The air-retaining properties of salvinia have been analyzed by Barthlott et al.15–19 Other than the similar surface nanostructure of wax crystalloids like the lotus leaf, the salvinia leaf surface has a different microstructure: the leaf surface is covered with tiny hairs instead of papillose epidermal cells (as with the lotus leaf). Specifically, one of the Salvinia species, namely Salvinia molesta, shows that each leaf forms a concave shape underwater and the hierarchical architecture of the leaf surface is dominated by tiny hydrophobic eggbeater-shaped hairs coated with a nanostructure of wax crystalloids except for the terminal cells of each hair which form hydrophilic patches (as shown in Fig. 1). The three main features of the Salvinia molesta leaf, the elastic eggbeater-shaped hairs, the superhydrophobic leaf surface and the hydrophilic patches on top of the eggbeater-shaped hairs combine together to retain a layer of air when the leaf is submerged under water.
Preliminary advances have been achieved in creating structures to mimic the behavior of salvinia in the past few years. Bhushan and Sung et al.20,21 studied salvinia and lotus effects by fabricating micropillar structures on a silicon base through photolithography. Bhushan proved that a structure can be created in the lab to mimic the behavior of salvinia; Sung’s research indicated that the air-retaining properties can be greatly enhanced using the salvinia structure compared to the lotus one. Tricinci et al.22 used a 3D laser lithography technique to fabricate a 3D patterned surface bio-inspired by salvinia and the sample showed interesting properties of hydrophobicity and air retention when submerged under water. Holscher et al.23,24 fabricated a nanofur by a hot pulling method to mimic the salvinia effect cost-effectively. Methods were developed to measure the underwater performance of the bionic samples. Mayser et al.17 and Gad-el-Hak et al.25 detected and calculated the trapped air on superhydrophobic surfaces through the change of the buoyancy force. Drag reduction was characterized by Holscher et al.24 measuring the pressure drop across the channel walls which were covered by the nanofur.
Concerning the hairy structure on the salvinia surface and the elasticity of the salvinia hairs, utilizing textile fibers with flexibility in nature to form a hairy structure through an electrostatic flocking process might be an effective biomimetic method. The electrostatic flocking technique uses a high voltage electrical field to plant ‘flocks’ (short fibers which have been given a pre-electrostatic flocking treatment to improve separation and flying properties) into a thin layer of adhesive on the substrate. This technique has been studied as an anti-biofouling approach in aquaculture and navigation to decrease material wastage and friction on the hull.30–33 In this research, a hairy surface was tailored by the flocking technique and then the flocking sample was treated with chemicals to obtain superhydrophobicity. In the meantime a method was established to evaluate the air-retaining ability by measuring the air bubble loss from the samples’ surfaces under water.
2. Experimental
2.1 Materials and chemicals
Salvinia leaves were provided by Ant Garden, China. Lotus leaves were picked from Jingyue Lake, Donghua University, China. Flocks of viscose (SWO series) and nylon (SWN series) of different sizes were provided by Erfa Flocking. The fiber size (length/fineness) varied from 0.4 mm/1 denier to 3 mm/30 denier (Table 1). 3M transparency film was used as the flocking substrate as it is soft and impermeable to water. Flocking paste provided by Jiahua Company (Guangdong, China) was used as the adhesive. A water repellent agent (TG-5601) for textiles (effective ingredient: fluoroalkyl acrylate copolymer (30%)) was provided by Dakin, China.| Viscose | Nylon | |||||
|---|---|---|---|---|---|---|
| V1 | V2 | N1 | N2 | N3 | N4 | |
| Length (mm) | 0.4 | 0.6 | 0.6 | 0.8 | 1 | 3 |
| Fineness (denier) | 1 | 1.5 | 1.5 | 3 | 3 | 30 |
2.2 Fabrication of flocking samples
A lab-scale electrostatic flocking machine which can generate a high static voltage up to 160 kV was assembled specially by Gulou Machinery (Fujian, China). A higher voltage generated than in ordinary lab-scale electrostatic flocking machines is beneficial to planting flock fibers more vertically, especially when the lengths and diameters of fibers increase. A flocking stand box was also used instead of a hand-held device in order to perform up-going flocking (flock fibers fly upwards in the static field onto the substrate) to help flock fibers stand vertically. Before flocking, one side of the 3M transparency film was primed with a layer of flock adhesive (0.05 g cm−2) using a scraper blade, and then the film was fixed to the electrode on top of the flock stand box for flocking. The electrostatic flocking process was controlled by adjusting the voltage of the electrical field and the duration. The larger the fiber, the higher the voltage needed to reach an appropriate lifting speed and to obtain good flock fastness. Flock density was adjusted by varying the flocking time. The flocked sample was dried at 120 °C and then washed in a soap solution to remove unnecessary materials attached, and dried. For the hydrophobic treatment, the flocking sample was dipped in a 5% solution of TG-5601 for 30 s, then extra liquid was squeezed out, and the sample was dried at 160 °C.2.3 Characterization and measurements
The surface structure of the flocking sample was observed using scanning electron microscopy (SEM) (TM-1000, HITACHI). The height, diameter and density of the fiber on the flocking sample were measured using SEM images. The Salvinia molesta leaf was also observed by SEM.To analyze the wetting behavior of the surfaces, a contact angle (CA) measurement was performed by applying a droplet of 3 μL pure water on the surface and 5 s thereafter the CA was analyzed by a contact angle goniometer (DSA30, Kruss, Germany). Roll off angle (RA) measurements were performed by attaching the samples to a tilting plate. After applying a droplet of 5 μL pure water on the surface, the plate was tilted until the droplet started to roll off and the tilted angle was recorded as the ‘roll off angle’. For each sample in the CA and RA tests, a minimum of four different readings were recorded. Lotus leaves and Salvinia molesta leaves were included in the tests for comparison. In addition, evaporation tests were performed by recording the form of the droplet (5 μL pure water) from when it was first applied on the surface for 60 min.
The measurement of the air retention under hydrostatic conditions was carried out as follows. For primary screening, the flocking sample was stuck to a glass slide before it was submerged in an aquarium filled with distilled water to a depth of 15 cm at room temperature 25 ± 2 °C controlled by an air conditioner. The air-retaining time was estimated by observing the length of time the silvery reflection lasted at the air–water interface. Before testing, the aquarium with water was stabilized for 24 h for temperature and air concentration equilibration.
To further test the air-retaining ability, the air volume change was measured with a setup made of a funnel and a burette as follows. The flocking sample (5 cm × 5 cm) was placed in the aquarium under the same conditions as in the primary screening test. Each sample was covered with a funnel and the end of the funnel was inserted into an upside-down burette (10 mL) which was filled with 8 mL distilled water and sealed at the mouth with a silicone adhesive (Fig. 2). When air bubbles escaped from the flocking surface, they would float into the burette through the funnel and push out the same volume of water inside the burette. The volume would be shown by the scale reading on the burette. As the air volume changes along with temperature, a set without a flocking sample (blank) was placed in each test batch to record the burette data for correction purposes, to thus eliminate deviation caused by temperature fluctuations. Nine samples and the blank were tested as a batch, and in each batch the sample place order was random. Every sample was tested at least two times. Then the better-performing flocking samples (longer air-retaining time or less air bubble loss) in each batch were selected for more tests. Therefore the best air-retaining flocking sample was tested five times in total, together with the salvinia leaves.
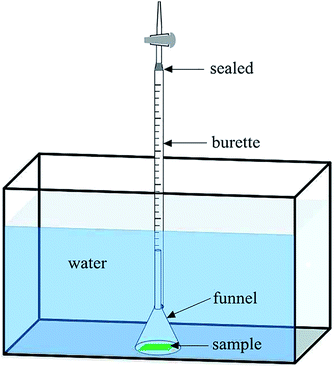 | ||
| Fig. 2 Schematic diagram of the setup for measuring air bubble loss from the flocking sample over time. | ||
Three values: the volume of the total air layer (Vtotal) or total air volume, the volume of air loss as bubbles (Vbubble) or air bubble loss, and the air volume left on the sample after the test (Vleft) or air retention were calculated from the burette scale readings recorded during the test. For Vtotal, the initial burette scale reading (V0) was recorded when the sample was placed under the funnel, then the air on the sample was manually squeezed out and floated into the burette for the scale reading V′. The Vtotal was calculated as,
| Vtotal = V0 − V′ | (1) |
For Vbubble and Vleft, a replicate sample was tested. In addition to the initial burette scale reading V0, Vt was the scale reading recorded at time t. The air bubble loss after t hours (Vbubble) was calculated as,
| Vbubble = V0 − Vt | (2) |
When the test ended at t = x hours with a burette scale reading of Vx, the air left on the sample would be manually squeezed into the burette to give the scale reading Ve. The air left on the sample (Vleft) when the test ended at x hours was calculated as,
| Vleft = Vx − Ve | (3) |
With these three values, Vtotal, Vbubble and Vleft, calculated, the volume of air that dissolved into water throughout the test (Vdissolved) would be,
| Vdissolved = Vtotal − Vbubble − Vleft | (4) |
The lotus leaf and the Salvinia molesta leaf were also included in the air volume change test. A lotus leaf was cut into a 5 cm × 5 cm area for the test. For the salvinia leaves, eight leaves (the surface area of salvinia leaf used was 200–400 mm2) were used for each test and the result was calibrated to a 25 cm2 area by measuring the actual surface area of the eight leaves through their imprints on graph paper.
3. Results and discussion
Abundant flocking samples with different flock fibers and flock densities were obtained by varying the output voltage of the flocking machine and the flocking time. It was found that the underwater air layer persistence increased along with the flock density. During flocking, the flock density increased rapidly when the flocking time was below 10 s and increased slightly between 10–30 s. It was considered that at the flocking time of 30 s, the samples reached their maximum density. It had been found that when the flocking time exceeded 10 s, the flocking samples would show significant air layer persistence. The results of the CA and RA measurements together with the primary underwater tests for flocking samples with flocking times of 10, 20, and 30 s are listed in Table 2. Those of Salvinia molesta and the lotus leaves are in Table 3. As the length of the flock fiber increases, more fibers would lean or even lie on the surface during flocking, which was especially noticeable in sample 6. In order to enable longer fibers to stand more vertically, the idea of making a sample with hybrid flocking fibers emerged. Sample 7 was made by a two-step electrostatic flocking process using two kinds of flock fibers (first step using N1, second N4). In this situation the shorter fibers would support the longer ones. Another advantage for the hybrid sample was that the double structure may be helpful for air retention.14,26,28 According to the CA result, it can be seen that the hydrophobic treatment was suitable as most of the flocking samples except samples 2B and 6 reached a CA of 140° to 150° which was similar to Salvinia molesta and lotus leaves. Sample 6 showed a similar shape of the water droplet in the CA test to the other samples, however, along with the increased flock fiber size, the average gap between the fibers increased. The gap (0.034 mm) between the flock fibers of sample 6 was much larger than those of other samples (in 5C for example, the gap was 0.017 mm). Moreover, with the leaning of the fiber, the water droplet sank into its surface and the reading of the contact angle decreased (in the sample 6 series, samples prepared with a flocking time below 30 s performed even worse, so were not included).| Sample | Flock fiber | Height (mm) | Diameter (μm) | Flocking voltage (kV) | Flocking time (s) | CA (°) | RA (°) | Air-retaining time (h) |
|---|---|---|---|---|---|---|---|---|
| 1A | V1 | 0.30 ± 0.05 | 10.6 | 50 | 10 | 143.6 | 10 | 180–250 |
| 1B | 20 | 145.7 | 6 | 200–240 | ||||
| 1C | 30 | 147.5 | 6 | 210–260 | ||||
| 2A | V2 | 0.50 ± 0.05 | 14 | 50 | 10 | 145.1 | 23 | 250–310 |
| 2B | 20 | 128.4 | 21 | 250–330 | ||||
| 2C | 30 | 143.9 | 16 | 270–330 | ||||
| 3A | N1 | 0.50 ± 0.05 | 14 | 50 | 10 | 151.2 | 26 | 250–310 |
| 3B | 20 | 147.6 | 23 | 250–300 | ||||
| 3C | 30 | 149.4 | 21 | 290–310 | ||||
| 4A | N2 | 0.70 ± 0.05 | 20 | 65 | 10 | 144.2 | 43 | 300–330 |
| 4B | 20 | 143.8 | 42 | 320–350 | ||||
| 4C | 30 | 146.3 | 39 | 330–390 | ||||
| 5A | N3 | 0.90 ± 0.05 | 22 | 65 | 10 | 149.5 | 45 | 490–550 |
| 5B | 20 | 145.8 | 39 | 520–600 | ||||
| 5C | 30 | 140.3 | 39 | 530–610 | ||||
| 6 | N4 | 2.90 ± 0.05 | 66 | 80 | 30 | 126.9 | >90 | 210–300 |
| 7 | N1 | 0.50 ± 0.05 | 14 | 50 | 30 | 145.4 | >90 | 310–350 |
| N4 | 2.90 ± 0.05 | 66 | 80 |
| Sample | CA (°) | RA (°) | Air-retaining time (h) |
|---|---|---|---|
| Salvinia molesta | 145.3 | >90 | >600 |
| Lotus | 146.3 | 3 | <24 |
It was found that if the droplet volume was increased up to 30 μL, the droplet could still be supported by all of the flocking samples in Table 2 without penetration although the sunken meniscus increased.
An increased contact angle hysteresis was shown to increase along with the flock size, or rather the flock diameter, as demonstrated in Table 2 where the roll off angle increased with the flock diameter. Samples 6 and 7 showed large RAs which were mainly caused by the water partially sinking into the surface made up of large fibers (for sample 7, the baseline of the water droplet was corrected to the N1 layer thus the CA was still above 140°). In addition, samples 1 to 5 were included in the evaporation test where the droplets revealed their receding contact angles. It can be seen from Fig. 3 that although a slight increase in the receding angle along with an increased flock diameter can be observed, all of the samples showed high CAs at the beginning and after 60 min, indicating the Cassie–Baxter state.9
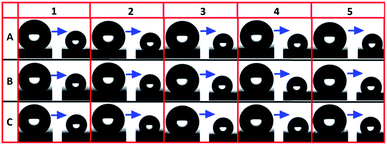 | ||
| Fig. 3 Evaporation test of flocking samples, showing the water droplet change from the beginning to 60 min thereafter. | ||
It was seen from Table 3 that the air on the lotus leaf disappeared within 24 h while Salvinia molesta retained air on the surface for more than 600 h, in accordance with previous studies where although the lotus leaf is known for its great hydrophobicity, it does not have air-retaining abilities. The flocking series in Table 2 shared a similar phenomenon under water: during the sample submersion in water, several air bubbles formed quickly within seconds and escaped from the sample surface. This part of the air was not considered as part of the air layer. After a sample was placed on the bottom of the aquarium, it would retain a steady air layer for a long time, during which the air bubbles formed very slowly. From samples 1 to 5, the air-retaining time increased slightly when the flocking time increased from 10 to 30 s. For sample 6, as the length and diameter of the flock fiber are much larger than those of the others, the air layer on it was unstable. A large portion of air was lost in the first several minutes, and the silvery layer began to break along with it. Sample 7, with a double structure, as expected showed steadier air retention than sample 6. After 600 h of the primary underwater test, most of the flocking samples were considered to have lost most of the air as the silvery reflection was barely visible. However, on sample 5C a portion of air was still left, giving a noticeable scattered silvery reflection.
The structural dimensions of salvinia observed were that the pillar average height was 1.8–2 mm and the density of the “eggbeater” as a whole was 1.5–2 mm−2. The density of the flocking sample reached hundreds or even thousands per square millimeter which was much higher than salvinia. Probably because of the lack of help from the eggbeater structure and the hydrophilic tip, a high density of flock fiber was essential to achieve a satisfactory air retention. As for the flock material, there was no significant difference between the performances of viscose and nylon fibers. Although viscose fibers are relatively more hydrophilic, after the hydrophobic treatment, they showed a similar air layer persistence compared to nylon fibers of similar sizes (compare 2A to 2C with 3A to 3C).
The samples were further subjected to air volume change tests and the results (Vtotal, Vbubble, Vdissolved and Vleft) of 1C, 2C, 3C, 4C, 5C and 6 are demonstrated in Fig. 4 together with the air-retaining time results for comparison. It can be seen that with an increased flock size, or rather flock height (1C to 5C), Vtotal and the air-retaining time increased, as well as Vleft (Fig. 4b), which was another indicator of air retention. However, when the flock size increased to a certain level, for example sample 6, where the effect of the enlarged gap surpassed the effect of the height increasing, water penetrated between fibers much more easily, leading to the air escaping as bubbles easily, and the air retention decreased.
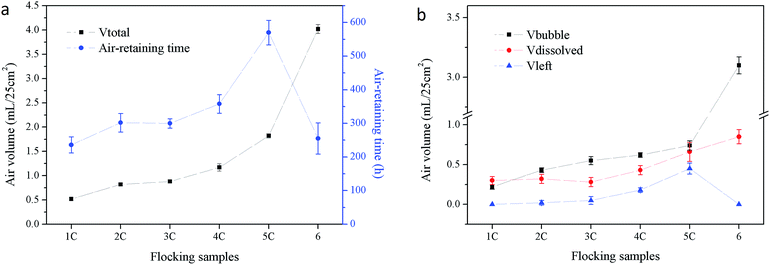 | ||
| Fig. 4 Air volume change (test time 600 h) and air-retaining time of flocking samples, (a) air-retaining time and Vtotal, (b) Vbubble, Vdissolved and Vleft. | ||
The best-performing flocking sample 5C (Fig. 5) was tested for air volume changes together with salvinia and lotus leaves. When a Salvinia molesta sample was submerged under water, the two blades of the leaf tend to curve to form a concave shape and it was noticed that as a result air was trapped inside. Therefore a salvinia-flat sample (prepared by gluing the two blades flat on a glass slide to avoid curving) was involved in the test. The air volume changes of flocking sample 5C and salvinia and lotus leaves are demonstrated in Table 4.
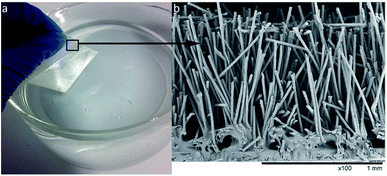 | ||
| Fig. 5 Flocking sample 5C, (a) silvery shine under water as the air layer is retained on its surface; (b) SEM image of the cross-section. | ||
| Sample | Vtotal | Vbubble | Vdissolved | Vleft | ||||
|---|---|---|---|---|---|---|---|---|
| mL/25 cm2 | S% | mL/25 cm2 | S% | mL/25 cm2 | S% | mL/25 cm2 | S% | |
| a Average value and standard deviation (S) of the four air volume parameters, Vtotal, Vbubble, Vdissolved and Vleft were calculated from 5 tests (for the lotus, 3 tests), test time t = 600 h. | ||||||||
| Salvinia | 3.1 | 4 | 0 | 0 | 0.9 | 6 | 2.3 | 3 |
| Salvinia-flat | 2.1 | 8 | 0.5 | 8 | 1.2 | 7 | 0.4 | 4 |
| Flocking sample 5C | 1.8 | 4 | 0.7 | 6 | 0.7 | 12 | 0.5 | 7 |
| Lotus | 0.1 | 0 | 0 | 0 | 0.1 | 0 | 0 | 0 |
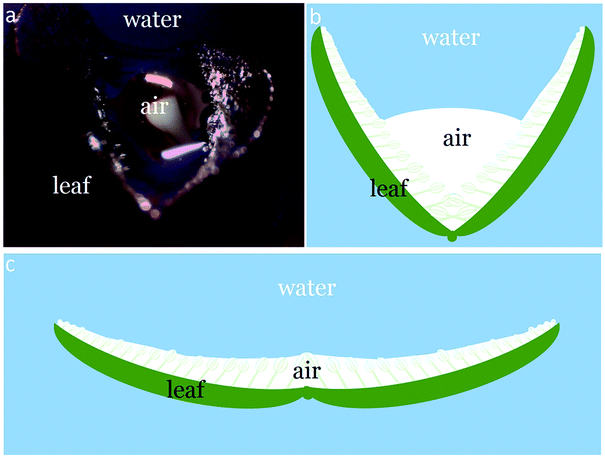
From Table 4 it was seen that salvinia leaves, with a higher hair height and lower hair density, contained a greater total air volume than sample 5C and lotus leaf. It was also seen that Vtotal and Vleft of salvinia were larger than those of salvinia-flat. This indicated that the curving of the salvinia leaf under water improved the retention of air. As illustrated in Fig. 6, the curving of the leaf formed an air pocket under water, and as a result more air was retained on it than on the leaf in its flat form. This phenomenon would help when designing different biomimetic applications.
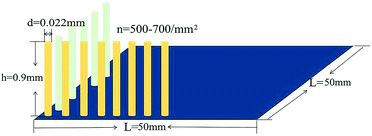
As shown in Table 4, Vtotal of flocking sample 5C was 1.8 mL of air on 25 cm2. As the hairy surface of the flocking sample could be modeled as a surface covered with pillars, the theoretical volume of total air held by the sample could be calculated for comparison. The structure parameters, height, diameter and density of sample 5C observed by SEM are shown in Fig. 7.
The maximum volume of air that can be contained on the flocking sample would be,
 | (5) |
For sample 5C, the calculated air volume according to formula (5) was 1.65–1.83 mL/25 cm2, and the measured air volume Vtotal (Table 4) was 1.8 mL/25 cm2. The measured value agreed with the calculated result.
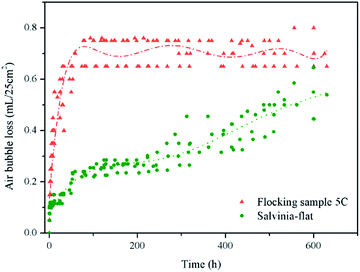
It is clear that during the air volume change test, no air bubbles were observed to be lost from salvinia and lotus samples. These may stem from different reasons. The air contained on the lotus leaf was too little and scattered between micro papillae to form air bubbles. As for the Salvinia molesta sample, the curving of the leaf functioned as a pocket which would enclose the air so as to prevent air bubble loss. Air bubble loss was observed from the salvinia-flat sample and flocking sample 5C. By combining the time t and Vbubble of 5 tests, air bubble loss trends were obtained (Fig. 8).
In Fig. 8, the test result points show a certain level of dispersion. If possible, a precise temperature control for this test would be ideal. Nevertheless, the air loss trends are clear, as sample 5C displayed rapid air bubble loss at the beginning which stabilized from around 60 h to the end of the test. This was different from the salvinia-flat sample which showed slow and steady air loss during the test. As the air lost as bubbles was highly dependent on the stability of the air–water interface, the steadier air layer on the salvinia-flat sample at the beginning might be due to the pinning effect on top of the eggbeater hairs. Another reason for the rapid bubble loss from sample 5C could be defects in electrostatic flocking or the hydrophobic coating leading to some areas being easily wetted by water. This was supported by the phenomenon that along with the air bubbles lost from the salvinia-flat sample, the silvery shine was intact on its surface for a much longer period of time compared to sample 5C, where the silvery layer began to break around 50 h, implying non-uniform fabrication. Aside from rapid air loss at the beginning, another feature of the trend of sample 5C was the later steady plateau, which could be explained by the Young–Laplace equation as the distance between fibers was quite small, there was capillary pressure (Pcapillary) caused by surface tension. Along with the sagging of water into the surface, the angle between the fiber and air–water interface would increase leading to the increase in Pcapillary. Equilibrium was reached when the hydrostatic and ambient pressures were balanced by Pcapillary and the air pressure inside the air layer.12,27
Other than air loss with bubbles, air dissolving into water is another main factor of air loss27,28 and this was also manifested in Table 4. When under water, the air pressure inside the air layer is higher than atmospheric pressure because of the hydraulic pressure, so the air inside the air layer tends to dissolve into water and diffuses towards the atmosphere. Calculated by formula (4), we got Vdissolved, salvinia-flat > Vdissolved, salvinia > Vdissolved, 5C. The result that Vdissolved, salvinia-flat > Vdissolved, salvinia could be explained by air diffusion being proportional to surface area and the contact area of air–water on salvinia is smaller than it is on salvinia-flat. However, to compare sample 5C and the salvinia-flat sample, other than the hair density of sample 5C being much higher than the salvinia hair which leads to a smaller air–water interface area, it should be considered that biotic effects of the plant leaf such as metabolism or withering etc. might affect the real volume of diffused air from salvinia.
When the test was ended at 600 h, the salvinia-flat sample and sample 5C had 18% and 25% air left, respectively, indicating good air-retaining ability. Moreover, with the help of curving, the air on the salvinia sample had even more than 50% left.
Here, flocking sample 5C showed a similar air-retaining ability to the Salvinia molesta leaf in a flat form under static conditions, although biotic factors might affect the results on the leaf and the measured air layer persistence of the salvinia leaf should be considered as its minimum performance. Through the comparison between flocking samples and sample 5C and salvinia, it can be concluded that in order to obtain a proper air-retaining flocking surface, firstly, a relatively small fiber diameter and high density of fibers on a substrate which maximize the capillary pressure against water penetration would be preferred. Secondly, a higher flock height which would increase Vtotal and extend the air diffusion time would benefit the air-retaining time. Flock fibers were commonly designed with synchronous diameters and heights in order to have enough strength to stand up and withstand suitable strain under pressure. This, to some extent, happened to fit with the demand to withstand underwater pressure and a proper balance between height and diameter would be critical. Furthermore, the air retention under dynamic conditions is still challenging, as the Salvinia molesta leaf has a hydrophilic tip to help stabilize the air–water interface. Further research into areas such as multi-layer structures and hydrophilic tip fabrication should be carried on in order to form an even steadier air layer. In addition, gas compensation methods28,29 are potential ways to extend underwater air retention.
4. Conclusions
In this research, a hairy surface was fabricated by electrostatic flocking to mimic the air-trapping ability of the salvinia leaf. In a series of experiments a flocking sample marked as 5C which was fabricated with a kind of nylon fiber was found to retain air for more than 600 hours under water.A volumetric method to measure the air-volume change on the surface under water was established. This method was used to further analyze the air-retaining properties (total air volume, air bubble loss, air dissolved and air retention) of samples. Our result showed that the curving of the Salvinia molesta leaf assisted air retention by preventing air bubble loss, and decreasing the air diffusion area. Flocking sample 5C, whose hair density was much higher than the Salvinia molesta leaf, showed a comparable air-retaining ability to the salvinia-flat sample. The air lost as bubbles from sample 5C was more than from salvinia-flat, but the air diffusion of sample 5C was less, though biotic factors of plant samples should be considered for salvinia.
Conflicts of interest
There are no conflicts of interest to declare.Notes and references
- T. L. Sun, L. Feng, X. F. Gao and L. Jiang, Acc. Chem. Res., 2005, 38, 644–652 CrossRef CAS PubMed.
- K. Koch, B. Bhushan and W. Barthlott, Soft Matter, 2008, 4, 1943–1963 RSC.
- Z. G. Guo, W. M. Liu and B. L. Su, J. Colloid Interface Sci., 2011, 353, 335–355 CrossRef CAS PubMed.
- S. Nishimoto and B. Bhushan, RSC Adv., 2013, 3, 671–690 RSC.
- F. Xia and L. Jiang, Adv. Mater., 2008, 20, 2842–2858 CrossRef CAS.
- L. Eadie and T. K. Ghosh, J. R. Soc., Interface, 2011, 8, 761–775 CrossRef PubMed.
- J. Y. Sun and B. Bhushan, RSC Adv., 2012, 2, 12606–12623 RSC.
- M. Sarkar, J. T. Fan, Y. C. Szeto and X. M. Tao, Text. Res. J., 2009, 79, 657–668 CrossRef CAS.
- W. Barthlott and C. Neinhuis, Planta, 1997, 202, 1–8 CrossRef CAS.
- L. Feng, S. H. Li, Y. S. Li, H. J. Li, L. J. Zhang, J. Zhai, Y. L. Song, B. Q. Liu, L. Jiang and D. B. Zhu, Adv. Mater., 2002, 14, 1857–1860 CrossRef CAS.
- A. B. D. Cassi and S. Baxter, Trans. Faraday Soc., 1944, 40, 546 RSC.
- A. A. Hemeda and H. V. Tafreshi, Langmuir, 2014, 30, 10317–10327 CrossRef CAS PubMed.
- G. McHale, M. I. Newton and N. J. Shirtcliffe, Soft Matter, 2010, 6, 714–719 RSC.
- P. Ditsche-Kuru, E. S. Schneider, J.-E. Melskotte, M. Brede, A. Leder and W. Barthlott, Beilstein J. Nanotechnol., 2011, 2, 137–144 CrossRef CAS PubMed.
- W. Barthlott, T. Schimmel, S. Wiersch, K. Koch, M. Brede, M. Barczewski, S. Walheim, A. Weis, A. Kaltenmaier, A. Leder and H. F. Bohn, Adv. Mater., 2010, 22, 2325–2328 CrossRef CAS PubMed.
- M. J. Mayser and W. Barthlott, Integr. Comp. Biol., 2014, 54, 1001–1007 CrossRef PubMed.
- M. J. Mayser, H. F. Bohn, M. Reker and W. Barthlott, Beilstein J. Nanotechnol., 2014, 5, 812–821 CrossRef CAS PubMed.
- P. Ditsche, E. Gorb, M. Mayser, S. Gorb, T. Schimmel and W. Barthlott, Appl. Phys. A: Mater. Sci. Process., 2015, 121, 505–511 CrossRef CAS.
- D. Gandyra, S. Walheim, S. Gorb, W. Barthlott and T. Schimmel, Beilstein J. Nanotechnol., 2015, 6, 11–18 CrossRef CAS PubMed.
- J. Hunt and B. Bhushan, J. Colloid Interface Sci., 2011, 363, 187–192 CrossRef CAS PubMed.
- C. Y. Yang, C. Y. Yang and C. K. Sung, Jpn. J. Appl. Phys., 2013, 52, 6 Search PubMed.
- O. Tricinci, T. Terencio, B. Mazzolai, N. M. Pugno, F. Greco and V. Mattoli, ACS Appl. Mater. Interfaces, 2015, 7, 25560–25567 CAS.
- M. Rohrig, M. Mail, M. Schneider, H. Louvin, A. Hopf, T. Schimmel, M. Worgull and H. Holscher, Adv. Mater. Interfaces, 2014, 1, 10 Search PubMed.
- M. N. Kavalenka, F. Vulliers, S. Lischker, C. Zeiger, A. Hopf, M. Rohrig, B. E. Rapp, M. Worgull and H. Holscher, ACS Appl. Mater. Interfaces, 2015, 7, 10651–10655 CAS.
- M. A. Samaha, H. V. Tafreshi and M. Gad-el-Hak, J. Colloid Interface Sci., 2013, 395, 315–321 CrossRef CAS PubMed.
- A. Balmert, H. F. Bohn, P. Ditsche-Kuru and W. Barthlott, J. Morphol., 2011, 272, 442–451 CrossRef PubMed.
- A. A. Hemeda, M. Gad-el-Hak and H. V. Tafreshi, Phys. Fluids, 2014, 26, 18 Search PubMed.
- C. Lee and C.-J. Kim, J. Microelectromech. Syst., 2012, 21, 712–720 CrossRef CAS.
- J. Cheek, A. Steele, I. S. Bayer and E. Loth, Colloid Polym. Sci., 2013, 291, 2013–2016 CAS.
- A. L. Phillippi, N. J. O’Conner, A. F. Lewis and Y. K. Kim, Aquaculture, 2001, 195, 225–238 CrossRef.
- H. Iijima, S. Yoshida and K. Watanabe, EP, 0312600, 1989-04-26.
- K. K. Alm, US Pat., 5618588, 1997-04-08.
- H. J. A. Breur, US Pat., 0227111, 2010-09-09.
| This journal is © The Royal Society of Chemistry 2018 |

