 Open Access Article
Suppressing self-discharge of Li–B/CoS2 thermal batteries by using a carbon-coated CoS2 cathode†
Youlong Xie ,
Zhijian Liu
 *,
Huilong Ning
 ,
Haifeng Huang
 and
Libao Chen
State Key Laboratory of Powder Metallurgy, Central South University, Changsha 410083, China. E-mail: csulzj1208@163.com; Tel: +86 13974870130
First published on 14th February 2018
Abstract
Thermal batteries with molten salt electrolytes are used for many military applications, primarily as power sources for guided missiles. The Li–B/CoS2 couple is designed for high-power, high-voltage thermal batteries. However, their capacity and safe properties are influenced by acute self-discharge that results from the dissolved lithium anode in molten salt electrolytes. To solve those problems, in this paper, carbon coated CoS2 was prepared by pyrolysis reaction of sucrose at 400 °C. The carbon coating as a physical barrier can protect CoS2 particles from damage by dissolved lithium and reduce the self-discharge reaction. Therefore, both the discharge efficiency and safety of Li–B/CoS2 thermal batteries are increased remarkably. Discharge results show that the specific capacity of the first discharge plateau of carbon-coated CoS2 is 243 mA h g−1 which is 50 mA h g−1 higher than that of pristine CoS2 at a current density of 100 mA cm−2. The specific capacity of the first discharge plateau at 500 mA cm−2 for carbon-coated CoS2 and pristine CoS2 are 283 mA h g−1 and 258 mA h g−1 respectively. The characterizations by XRD and DSC indicate that the carbonization process has no noticeable influence on the intrinsic crystal structure and thermal stability of pristine CoS2.
Introduction
Thermal batteries are chemical power supplies which use molten salts as electrolytes and operate in the range from 350 °C to 550 °C. They are activated by employing an internal pyrotechnic source to produce the heat and melt salt electrolytes. The excellent ionic conductivity of molten salts means thermal batteries can work at high output power. Thermally batteries are mainly used as power sources for guided weapon systems due to their harsh-environment endurance, fast-activation and long storage times.1,2 Metal sulfides with outstanding conductivity have been widely applied to lithium ion batteries, supercapacitors or lithium–sulfur batteries.3,4 One of them is CoS2 which is becoming an important cathode material for thermal batteries. Compared with other metal sulfides like FeS2 and NiS2, it has the lowest solubility in most molten electrolytes and the highest electronic conductivity. Furthermore, its thermal decomposing temperature is up to 650 °C, which is of great significance for the safety properties of thermal batteries.Lithium alloys have been used as anode materials for thermal batteries, such as Li–Al, Li–Si, and Li–B alloy. To match with the excellent electrochemical properties of CoS2 cathode, Li–B alloy anode which has good power property for its outstanding Li activity, is considered to be the best choice. Different from conventional LiCl–KCl eutectic electrolyte, LiF–LiCl–LiBr molten salt system has an ionic conductivity up to 6.52 S cm−1.5,6 Thus the Li–B/LiF–LiCl–LiBr/CoS2 couple is now the most suitable assembly for the high-power output thermal batteries. However, the free lithium in Li–B alloy is very easy to dissolve into the electrolytes. Then the dissolved lithium diffuses to the cathode and reacts with cathode materials once thermal batteries are activated, which results in serious self-discharge at discharge. Above phenomenon can be related to the rule that alkali-metal had a considerable solubility in molten alkali halide.7 The solubility of lithium at LiF–LiCl–LiBr eutectic is between 1 mol% and 2 mol%, which was measured by Watanabe N.8 The Li activity of the anode has a dramatic influence on increasing the dissolving process and Li–B alloy has much higher Li activity than Li–Si alloy and Li–Al alloy. Therefore the capacity of Li–B/CoS2 cells is more greatly influenced by the severe self-discharge especially in the case of long operating life thermal batteries. Self-discharge rate of Li–B/LiF–LiCl–LiBr/CoS2 cells measured by Gao was up to 20 mA cm−2,9 which is almost times more than Li–Si/CoS2 cells. In addition, a drastic exothermic reaction accompanied with self-discharge reactions, may destroy the battery and cause serious safety issues. So far, performances of Li–B/CoS2 batteries are still limited by self-discharge.
Various strategies have been employed to address the self-discharge caused by dissolved lithium in Li–B/LiF–LiCl–LiBr/CoS2 cells. Zeng reported that applying additive of nanometal powder to LiF–LiCl–LiBr electrolytes could effectively suppress the dissolution of lithium anode.10 Different from Zeng, preventing direct contact between dissolved lithium and active cathode materials through surface modification may be another promising strategy in solving this problem. Similar strategies have been applied to suppress the harmful interaction between electrode materials and electrolytes for lithium ion batteries.11–13 The alumina coating for lithium cobalt fluorophosphate was reported to prevent metal ion dissolution and improve the cycle performance.14 A widely recognized interpret is that the alumina coating can protect cathode materials from hazardous reaction products such as HF obtained during the charge–discharge process.15,16 Petnikota has modified FeO, MnO and Co2Mo3O8 by coating of graphene oxide for anode application in lithium ion batteries. All of those composites exhibit better electrochemical properties than corresponding pristine batteries.17–19 Another example is that amorphous carbon coating is used to prevent PC-based electrolytes insert into graphite accompanied by graphite exfoliation.20,21 For researches of thermal batteries that anode is Li–Si alloy, carbon coating to CoS2 cathode was reported by Xie to promote electrochemical properties by enhancing the electronic conductivity.22
In this paper, considering the higher self-discharge rate at Li–B/CoS2 system, the carbon coating of CoS2 is mainly aimed to block dissolved lithium atom react with CoS2 cathode. Based on above hypothesis, we reported a facile method through pyrolysis reaction of sucrose, to modify CoS2 with amorphous carbon coating (this composite of carbon and CoS2 is referred as CoS2/C hereafter). It has been proved that CoS2/C was suitable for thermal batteries and successful in reducing self-discharge rate at Li–B/CoS2 system. Discharge tests indicated that CoS2/C released higher capacity than pristine CoS2. Fig. 1 illustrates how the carbon coating influences self-discharge as a physical barrier.
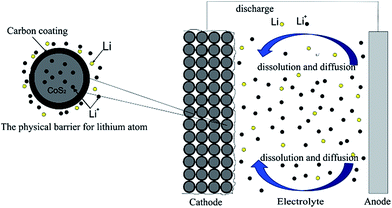 | ||
| Fig. 1 The influence of modifying CoS2 cathode materials by the carbon coating at thermal batteries. | ||
Experimental
Carbon-coated CoS2 preparation
CoS2 was powder from State Key Laboratory of Powder Metallurgy which was synthesized by solid-state reaction of cobalt and sulphur powder.8 To prepare carbon-coated CoS2, 1 g sucrose (C12H22O11) was dispersed in 2 mL pure water. Then, 9 g CoS2 and sucrose solution were ground together for 1 h to make it been mixed evenly. After drying, the mixture was carbonized in the argon atmosphere for 4 h after heating to 400 °C at a rate of 5 °C min−1.23–25Single cell preparation
Anodes were Li–B alloys strip which were provided by State Key Laboratory of Powder Metallurgy, and synthesized by smelting metal lithium and boron.26 Mass fraction of lithium for Li–B alloy is 61 wt%. It was punched to disk with a diameter of 17.5 mm. Electrolyte were composed by 50 wt% LiF–LiCl–LiBr eutectic salts (9.2 wt% LiF, 22 wt% LiCl, 68.4 wt% LiBr) and 50 wt% Nano-MgO binder. Cathodes include 80 wt% CoS2 or CoS2/C and 20 wt% electrolytes.The cathode and separator were shaped to stratiform slice together by spreading the corresponding powders in a die, and then suppressing them under a static compaction pressure of 250 MPa. Two types of single cells were prepared to study the electrochemical properties of anode and cathode respectively. Single cells that the anode was superfluous were composed of 0.20 g anode, 0.36 g separator and 0.18 g cathode. While single cells with superfluous cathode were composed of 0.09 g anode, 0.36 g separator and 0.40 g cathode. Single cells with CoS2/C and pristine CoS2 cathode were abbreviated as CoS2/C cell and CoS2 cell respectively hereafter.
Materials characterization
Microscopic morphology studies were carried by the scanning electron microscope (LEO 1530 Gemini, Zeiss, Germany) at 15 kV. Crystalline structures of samples were characterized by X-ray diffractometer (D/max2550PC, Rigaku, Japan) at a rate of 8° min−1 from 10° (2θ) to 90° (2θ) with Cu Kα radiation. Differential scanning calorimetry (DSC) was conducted by a thermal analyzer system (Hengjiu, Beijing) with a heating rate of 10 °C min−1 and a 50 ml min−1 Ar flow rate. The carbon coating was observed by transmission electron microscopy (Tecnai G2, FEI, USA). Raman spectroscopies were completed by (T64000, Horiba, Japan) and 514 nm light was used for excitation with an intensity of 20 mW. Particle size distribution was measured by laser particle size analysis (Mastersizer3000, Malvern, England).Electrochemical measurements
Anode, separation-cathode disk were fabricated to single cell. The test was conducted at 520 °C with a fluctuation of 5 °C. Single cells were discharged at constant current and pulse current respectively. In pulse discharge, the current densities were ranged from 100 mA cm−2 to 600 mA cm−2 for 2 s every 20 s to study total polarization and power properties. Discharge data were obtained by electronic load (ITECH, IT8511, USA). Total polarization was calculated by following formula.27| Rtotal = ΔU/ΔI |
Results and discussion
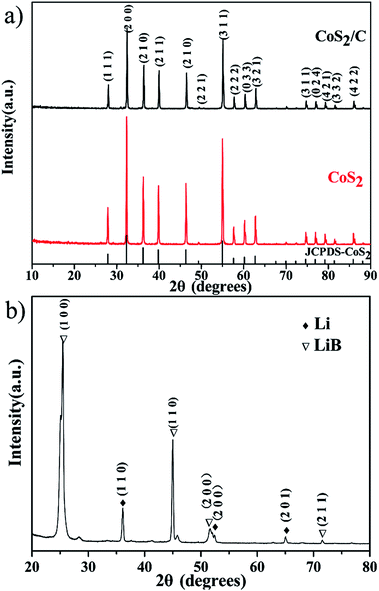
X-ray diffraction patterns of both CoS2/C and pristine CoS2 are shown in Fig. 2a. All peaks of pristine CoS2 and CoS2/C can be indexed to a pure-phase, and no apparent differences appear between CoS2 and CoS2/C patterns, except the whole diffraction intensity. It indicates that the coating process has no affection on the crystal structure of pristine CoS2. Besides, no peaks involved to carbon are observed in diffraction patterns of CoS2/C. Fig. 2b is the results of XRD analysis of Li–B alloy anode. It shows that Li–B alloy was mainly made up of free lithium metal and LiB compound. According to past studies, no free lithium metal was appeared at Li–Si or Li–Al alloy anode. It is the free lithium metal that makes the Li–B alloy has much more activity than that of Li–Si or Li–Al alloy.Fig. 3a and b display SEM images of pristine CoS2 and CoS2/C respectively. Both pristine CoS2 and CoS2/C show aggregation which is sticked by tiny spherical particles. There are gaps and holes between tiny spherical particles, which can provide the passageway for molten electrolytes at the process of discharge. Compared Fig. 3a and b, CoS2/C has bigger granularity than pristine CoS2. This phenomenon can be explained by bonding of sucrose. Since the melting point of sucrose is 186 °C,28 sucrose will be heated to the liquid state before the carbonized stage and CoS2 particles may be bonded by viscous molten sucrose. The changes of granularity observed by SEM are also identical to the consequence of particle size analysis. Median particle diameter (D50) of pristine CoS2 is increased from 19.7 μm to 26.8 μm after coating. Fig. 3c and d show the TEM micrographs of CoS2/C particles. There is a clear boundary between the core of CoS2 and the bright translucent shell materials of the carbon. The thickness is estimated to be 6 nm. The combination between CoS2 and carbon is proved to be complete, only in this way can carbon shell protect CoS2 particles effectively.
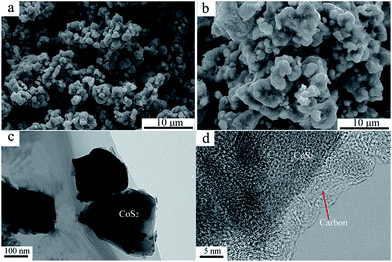 | ||
| Fig. 3 SEM images of pristine CoS2 (a) and carbon-coated CoS2 (b). TEM images of carbon-coated CoS2 (c, d). | ||
Fig. 4a exhibits the Raman spectroscopy of CoS2/C. The peaks at 1590 cm−1 and 1358 cm−1 are commonly referred as G peak and D peak.29 G peak is corresponding to a Raman active E2g mode of two-dimensional graphite layer, while D peak is attributed to a zone boundary phonon activated by disordered graphite or glass carbon.30 The ratio of intensity between D peak and G peak (ID/IG) is 0.65. A general expression that gives the crystallite size (La) of graphite from the intensity ratio ID/IG is given by
![[double bond, length as m-dash]](https://www.rsc.org/images/entities/char_e001.gif) C fundamental stretching vibration of S2C
C fundamental stretching vibration of S2C![[double bond, length as m-dash]](https://www.rsc.org/images/entities/char_e001.gif) CS2 configuration is observed at around 1445 cm−1. It reveals that no polymer is produced among interaction of CoS2 and sucrose.
CS2 configuration is observed at around 1445 cm−1. It reveals that no polymer is produced among interaction of CoS2 and sucrose.
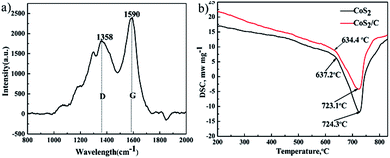 | ||
| Fig. 4 Raman spectroscopy of CoS2/C (a). Differential scanning calorimeter of pristine CoS2 and CoS2/C (b). | ||
Fig. 4b gives results of differential scanning calorimeter of pristine CoS2 and CoS2/C. Good thermal stability of cathode materials is a significant requirement at thermal batteries. Sulfide cathode materials with bad thermal stability may decompose and produce sulfur steam because the instantaneous high temperature at the beginning of activation,32 which leads fatal safe issues and loss of capacity. Only one endothermic peak related to decomposition of CoS2 is observed in both curves. The endothermic peak of pristine CoS2 is 724.3 °C, and that of CoS2/C is 723.1 °C. In addition, approximate endothermic onset temperature that sample become decompose are pointed at two curves. DSC date can be inferred that the carbon coating has no apparent influence on the thermal stability of pristine CoS2.
According to the past studies, the discharge reactions of CoS2 included three steps which are expressed by following chemical reaction equations.1,33
| (1 − x)CoS2 + (2 − 4x)e− → Co(1−x)S + (1 − 2x)S−2 | (1) |
 | (2) |
| Co9S8 + 16e− → 9Co0 + 8S−2 | (3) |
Correspondences of reaction equations are three plateau voltages. V. A. Bryukin inferred that x was ranged from 0.110 to 0.124.34 calculated by the theories of V. A. Bryukin, the specific capacity of first discharge plateau is 374–382 mA h g−1, that of second and third discharge plateau are 102–110 mA h g−1 and 348 mA h g−1 respectively.
Once a thermal battery is activated at the high temperature, self-discharge caused by dissolved lithium anode is remarkable. Thus, on the open circuit, the electromotive force (EMF) of the single cell will be decreased as time goes on due to active electrode materials are lost gradually by self-discharge reaction. Fig. 5a clarifies the relation between EMF and time of the battery cells fabricated with CoS2 and CoS2/C cathodes on the open circuit at 520 °C (single cells are designed with superfluous anode materials). EMF-time curves in the Fig. 5a reveal that active cathode materials are exhausted at last. There is no doubt that EMF of CoS2/C cell is decreased more slowly than that of pristine CoS2 cell. It can be concluded that CoS2/C cell has lower self-discharge rate than pristine CoS2 cell. Multiple EMF plateaus in the Fig. 5a represent phase transition of cathode materials. According to discharge process of CoS2, three open-circuit plateau voltages ordered from the most to the least are related to phases of CoS2, Co1−xS, Co9S8 respectively. Fig. 5b shows differential capacity plots of cells. Three peaks located at 1.93 V, 1.80 V, 1.57 V in differential capacity plots are also very consistent with open circuit voltage curves. The EMF of the reaction from CoS2 to Co1−xS has been depressed by carbon coating.
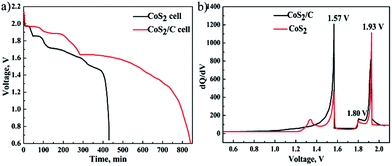 | ||
| Fig. 5 The voltage of single cells as function of time on open circuit at 520 °C (a). Differential capacity plots of CoS2/C cell and pristine CoS2 (b). | ||
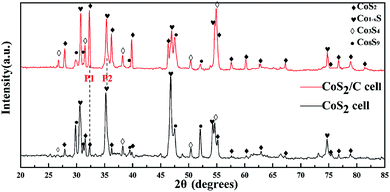
In order to further validate above deductions, X-ray diffraction was applied for analyzing the composition of the cathode part which has experienced an open circuit losses. To prepare appropriate samples for XRD, CoS2/C cell and pristine CoS2 cell were laid on open circuit for 40 min at 520 °C respectively. Then, cathode parts were rinsed with distilled water to remove electrolytes which will produce obvious interference signal. Fig. 6 displays XRD results of remainder active cathode materials which are obtained during open circuit. Diffraction spectrums show that the major phases of two samples are CoS2 and Co1−xS. Peaks located at 32.39° (P1) and 35.18° (P2) are contributed to CoS2 and Co1−xS respectively. The mass ratio of CoS2 and Co1−xS on the samples is directly proportional to intensity ratio of P1 and P2 (P1/P2), and the P1/P2 of CoS2/C cell is 0.83, while for pristine CoS2 is 0.14. Thus we can get the conclusion that there are less lost active materials on CoS2/C cell. Those results are consistent with the analysis of the EMF curve in Fig. 5a. It should be noted that obvious peaks related to Co9S8 and Co3S4 appear at two patterns. Co9S8 phase may exist because of the non-uniform distribution of self-discharge reaction. A small amount of Co3S4 can be related to thermal decomposition of CoS2.35
Fig. 7 reports discharge curve of single cell that Li–B alloy anode is superfluous at 100 mA cm−2 (a) and 500 mA cm−2 (b). It can be used to study electrochemical properties of cathode materials. Because only the capacity of first discharge plateau for CoS2 is utilized at practice application, specific capacity of first discharge plateau is regarded as standard to compare discharge capability of CoS2 cathode. Fig. 7a reveals that the specific capacity of first discharge plateau for CoS2/C is 243 mA h g−1, which is 50 mA h g−1 higher than of pristine CoS2, and accounts for 64.9% of the theoretical capacity of CoS2 (374 mA h g−1). In Fig. 7b, the specific capacity for first discharge plateau of CoS2/C and pristine CoS2 are 283 mA h g−1 and 258 mA h g−1, respectively. CoS2/C cells perform more flat and long first voltage plateau than pristine CoS2 cell. The carbon coating has a significant effect in increasing specific capacity whether at 500 mA cm−2 or 100 mA cm−2. However, due to the loss of capacity caused by self-discharge will increase with discharge time, and completing discharge takes a longer time at 100 mA cm−2 than at 500 mA cm−2, CoS2/C with lower self-discharge represents a more obvious advantage when single cells are discharged at the low current rate of 100 mA cm−2.
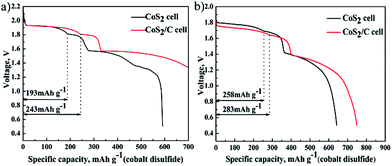 | ||
| Fig. 7 Specific discharge capacity of cobalt disulfide cathode, data of pristine CoS2 cell or CoS2/C cell at 100 mA cm−2 (a) and 500 mA cm−2 (b). | ||
Sustained self-discharge reactions will consume lithium from anode. Thus self-discharge rate at cathode has a great influence on the specific capacity of Li–B alloy anode. To compare the specific capacity of Li–B alloy anodes which are matched with different cathodes, single cells that cathode is superfluous are discharged at 100 mA cm−2 (Fig. 8a) and 500 mA cm−2 (Fig. 8b). In the Fig. 8a, as a result of using CoS2/C cathode, the specific capacity of Li–B anode is increased from 805 mA h g−1 to 885 mA h g−1 at first plateau. In the Fig. 8b, an increase of 51 mA h g−1 also appears on first discharge plateau of Li–B alloy anode. There is no doubt that CoS2/C cathode improves discharge efficient of Li–B alloy anode. The consequences of Fig. 8 provide further evidence that carbon coating on the CoS2 has evident effect in depressing self-discharge to the Li–B/LiF–LiCl–LiBr/CoS2 cells. Li–B alloy is made up of lithium and LiB compound, which results in first and second discharge plateaus respectively.36 Besides, only lithium metal can dissolve into electrolytes and cause self-discharge. Therefore, CoS2/C cathode only has positive influence on the first discharge plateau of Li–B alloy anode.
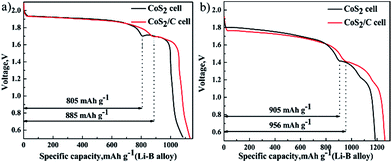 | ||
| Fig. 8 Specific discharge capacity of Li–B alloy anode, data of pristine CoS2 cell or CoS2/C cell at 100 mA cm−2 (a) and 500 mA cm−2 (b). | ||
In Fig. 7a and 8a, the first plateau voltage of CoS2/C cell is equal to pristine CoS2 cell at 100 mA cm−2. In Fig. 7b and 8b, compared with pristine CoS2 cell, however, a decrease about 0.4 V to the plateau voltage appears at CoS2/C cell when the current density is increased to 500 mA cm−2. Apparently, the carbon coating also has blocked diffusion of lithium ion, which produces additional concentration polarization for single cells at 500 mA cm−2. The unique porous structure of amorphous carbon provide channels for the diffusion of lithium ion, which ensures enough lithium ion will diffuse to reaction interface in time at the low current density, but not at the high current density of 500 mA cm−2. To know the detail of polarization increased by the carbon coating and estimate properties of single cell at transitory high current, single cells were discharged at pulse loading mode. Fig. 9a depicts pulse discharge curve. The total polarization was calculated by previous formula. Fig. 9b compares the difference of total polarization between CoS2 cell and CoS2/C cell. The resistances of both cells are increased with discharge time. Though CoS2/C cell shows higher total polarization than CoS2 cell especially when the voltage is higher than 1.65 V. CoS2/C cell also exhibits excellent performances at pulse current, which meets the requirement of delivering electricity with high power for thermal batteries.
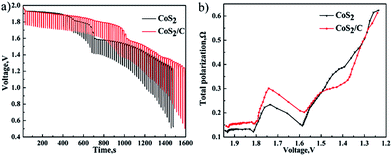 | ||
| Fig. 9 Discharge performance at a background current of 100 mA cm−2 and pulse current of 600 mA cm−2 for 2 s every 20 s (a). Comparison of total polarization between CoS2 cell and CoS2/C cell (b). | ||
Conclusions
In summary, to solve self-discharge problem at Li–B/LiF–LiCl–LiBr/CoS2 system, we have modified CoS2 with carbon coating by facile pyrolysis reaction of sucrose. Compare to the CoS2/Li–B couple, thermal batteries fabricated with CoS2/C and Li–B alloy can deliver much higher specific capacity. The enhanced discharge efficiency can be explained by the mechanisms that the carbon coating can prevent CoS2 from directly exposing to the electrolytes and minimize the self-discharge reactions between the cathode and dissolved lithium. Besides, the carbonized process has no obvious influences on the thermal stability of pristine CoS2. It has been proved that CoS2/C was efficient and safe cathode materials. CoS2/C has great merits and value particularly at the long-life thermal batteries for the low self-discharge rate. The method of modifying cathode materials with carbon may be applied to other cathode materials such as FeS2 and NiCl for thermal batteries, all of those studies are underway.Conflicts of interest
There are no conflicts of interest to declare.Acknowledgements
This research work was financially supported by the National Natural Science Foundation of China (51771236), the Innovation-Driven Project of Central South University (No. 2017CX002).References
- R. A. Guidotti and P. Masset, J. Power Sources, 2006, 161, 1443–1449 CrossRef CAS
.
- K. Nitta, S. Inazawa, S. Sakai, A. Fukunaga, E. Itani and K. Numata, SEI Tech. Rev., 2013, 76, 33–39 Search PubMed
.
- P. Kulkarni, S. K. Nataraj, R. G. Balakrishna, D. H. Nagarajua and M. V. Reddy, J. Mater. Chem. A, 2017, 5, 22040–22094 CAS
.
- M. Chen, X. Yin, M. V. Reddy and S. Adams, J. Mater. Chem. A, 2015, 3, 10698–10702 CAS
.
- S. Fujiwara, M. Inaba and A. Tasaka, J. Power Sources, 2010, 195, 7691–7700 CrossRef CAS
.
- R. A. Guidotti and P. Masset, J. Power Sources, 2008, 183, 388–398 CrossRef CAS
.
- A. J. Burak and M. F. Simpson, JOM, 2016, 68, 1–7 CrossRef
.
- N. Watanabe, K. Nakanishi and A. Komura, Journal of the Society of Chemical Industry Japan, 1968, 71, 1599–1602 CrossRef CAS
.
- J. X. Gao, Microcosmic characteristics and discharge properties of cobalt sulfide as cathode in thermal batteries, Central South University, 2014 Search PubMed
.
- P. Zeng, Dissolution characteristics and discharge properties of LiB alloys as anode in thermal batteries, Central South University, 2016 Search PubMed
.
- F. Wu, Q. Xue, L. Li, X. Zhang, Y. Huang and E. Fan, RSC Adv., 2017, 7, 1191–1199 RSC
.
- P. R. Kumar, V. Madhusudhanrao and B. Nageswararao, J. Solid State Electrochem., 2016, 20, 1855–1863 CrossRef CAS
.
- M. V. Reddy, G. V. Subba Rao and B. V. Chowdari, Chem. Rev., 2013, 113, 5364–5457 CrossRef CAS PubMed
.
- S. Amaresh, K. Karthikeyan and K. J. Kim, RSC Adv., 2014, 4, 23107–23115 RSC
.
- M. Seungtaek, I. Kentarou and K. Shinichi, J. Mater. Chem., 2005, 17, 3695–3704 CrossRef
.
- M. Yoshio, H. Wang and K. Fukuda, J. Electrochem. Soc., 2000, 147, 1245–1250 CrossRef CAS
.
- S. Petnikota, S. K. Marka, A. Banerjee, M. V. Reddy, V. V. S. S. Srikanth and B. V. R. Chowdari, J. Power Sources, 2015, 293, 253–263 CrossRef CAS
.
- S. Petnikota, V. V. S. S. Srikanth, P. Nithyadharseni, M. V. Reddy, S. Adams and B. V. R. Chowdari, ACS Sustainable Chem. Eng., 2015, 3, 3205–3213 CrossRef CAS
.
- S. Petnikota, S. K. Marka, V. V. S. S. Srikanth, M. V. Reddy and B. V. R. Chowdari, Electrochim. Acta, 2015, 178, 699–708 CrossRef CAS
.
- L. Wang, Z. Liu, Q. Guo, X. Guo and J. Gu, RSC Adv., 2017, 7, 36735–36743 RSC
.
- S. Petnikota, N. K. Rotte, V. V. S. S. Srikanth, B. S. R. Kota, M. V. Reddy and K. P. Loh, J. Solid State Electrochem., 2014, 18, 941–949 CrossRef CAS
.
- S. Xie, Y. Deng and J. Mei, Electrochim. Acta, 2017, 231, 287–293 CrossRef CAS
.
- S. Amaresh, K. Karthikeyan and I. C. Jang, J. Mater. Chem. A, 2014, 2, 11099–11106 CAS
.
- J. Dong, D. Li and Z. Peng, J. Solid State Electrochem., 2008, 12, 171–174 CrossRef CAS
.
- J. Wang and X. Sun, Energy Environ. Sci., 2012, 5, 5163–5185 CAS
.
- Z. J. Liu, Z. Y. Li, W. Duan, X. H. Qu, B. Y. Huang and S. Q. Zhang, J. Mater. Sci. Technol., 2000, 16, 581–584 CAS
.
- S. Xie, Y. Deng, J. Mei, Z. Yang, W. M. Lau and H. Liu, Composites, Part B, 2016, 93, 203–209 CrossRef CAS
.
- M. Hurtta, I. Pitkänen and J. Knuutinen, Carbohydr. Res., 2004, 339, 2267–2273 CrossRef CAS PubMed
.
- J. Schwan, S. Ulrich and V. Batori, J. Appl. Phys., 1996, 80, 440–447 CrossRef CAS
.
- A. C. Ferrari and J. Robertson, Phys. Rev. B: Condens. Matter Mater. Phys., 2008, 61, 14095–14107 CrossRef
.
- L. G. Cancado, K. Takai and T. Enoki, Appl. Phys. Lett., 2006, 88, 163106 CrossRef
.
- S. Serge, J. Power Sources, 2005, 142, 361–369 CrossRef
.
- Y. Wang, J. Wu, Y. Tang, X. Lu, C. Yang and M. Qin, ACS Appl. Mater. Interfaces, 2012, 4, 4246–4250 CAS
.
- V. A. Bryukvin and L. I. Blokhina, Nickel-Cobalt International 97 Symposium, Canada, August 1997 Search PubMed
.
- M. A. Rodriguez, E. N. Coker, J. J. M. Griego, C. D. Mowry, A. S. Pimentel and T. M. Anderson, Powder Diffr., 2016, 31, 90–96 CrossRef CAS
.
- P. Sanchez, C. Belin, G. Crepy and A. D. Guibert, J. Mater. Sci., 1992, 27, 240–246 CrossRef CAS
.
Footnote |
| † Electronic supplementary information (ESI) available. See DOI: 10.1039/c7ra13071f |
| This journal is © The Royal Society of Chemistry 2018 |

