 Open Access Article
Facile synthesis of a high electrical and ion conductivity junction-less 3D carbon sponge electrode for self-standing lithium ion battery anode†
Jyunichiro Abe,
Yuta Kobayashi,
Koki Kawase ,
Mizuki Tenjimbayashi and
Seimei Shiratori
 *
*
Department of Integrated Design Engineering, Faculty of Science and Technology, Keio University, 3-14-1 Hiyoshi, Kohoku-ku, Yokohama, Kanagawa 223-8522, Japan. E-mail: shiratori@appi.keio.ac.jp
First published on 8th February 2018
Abstract
Lithium ion batteries (LIB) are the most extensively researched and developed batteries. Currently, LIBs are used in various applications such as electric vehicles (EV), hybrid EVs (HEV), plug-in HEVs, and energy storage systems. However, their energy density is insufficient and further improvement is required. In this study, we propose the facile synthesis of a self-standing, junction-less 3D carbon sponge electrode (3DCS) for improving the energy density. A self-standing structure can improve the energy density by reducing non-active materials such as binders and current collectors, in electrodes. We use a kitchenware melamine sponge as the carbon precursor. The utilization of materials mass-produced by existing facilities is crucial for ensuring availability and low costs. Such characteristics are imperative for industrialization. These self-standing 3DCS electrodes, fabricated using available low-cost melamine sponges, demonstrate high charge-rate characteristics with a capacity retention of 81.8% at 4000 mA g−1 and cycle durability with 95.4% capacity retention after 500 cycles, without current collector, binder, and conductive additives. This high availability, low-cost material with excellent characteristics is beneficial for research institutions and companies that do not have facilities.
Introduction
Lithium ion batteries (LIB) are the most extensively researched and developed batteries. They were first developed by Sony for application in video cameras, in the 1990s.1 Further, their performance was continuously2 improved and they were used in various applications such as fuel cell vehicles, electric vehicles (EVs), hybrid EVs (HEVs), Plug-in HEVs,3 and energy storage systems.4 However, as their energy density is insufficient, further improvement is required.5Improvements in the energy density may not have occurred because there were no significant changes in the type of active material, manufacturing process, and cell structure. For example, the initial lithium-ion batteries consisted of layered transition metal oxides: LiCoO2 and graphite on the positive and negative electrodes, respectively; however, the basic concept remains the same, even today.6 In addition, the process of applying a slurry obtained by mixing an active material, auxiliary agent, and binder to a metal foil and the winding or stacking of the cell structure on an electrode that is to be inserted into a prismatic or laminate cell has not changed.7 Positive-electrode materials such as LiNi0.5Mn1.5O4 spinel8 and Li-rich layered material,9 and negative-electrode materials such as silicon10,11 and metal oxide12 were proposed in previous studies. For the cell structure, binder-free,13,14 collector-free,15 and bipolar structures16,17 were proposed. In these proposals, the energy density was improved by reducing the non-capacitive parts. On reducing the binder and current collector in a conventional structure, problems in the durability18 and output characteristics were encountered. In order to solve these problems, a self-standing, carbon nonwoven electrode fabricated by electrospinning19,20 and vacuum filtration21,22 was proposed. Such electrodes were characterized by a high specific surface area, high-porosity, and high conductivity; they were light weight with high strength, and exhibited high durability and excellent output characteristics, without binders and current collectors. In addition, the devices manufactured using these methods were simple and inexpensive. However, there were difficulties in continuous production methods such as the roll-to-roll process and considerable solvent quantities were required.
In this study, we propose a self-standing, junction-less 3D carbon sponge (3DCS) electrode for the LIB anode. This 3DCS electrode is synthesized by the carbonization of a commercial melamine sponge as the carbon precursor. As melamine is a polymer in an aromatic system containing nitrogen, it can be carbonized by calcinating in inert atmosphere. There is no prior research in which a carbon electrode derived from commercial melamine sponge is applied to LIBs. Previously, using melamine-derived carbon, applications such as supercapacitors,23 lithium oxygen batteries,24 and fuel cells25 have been proposed. However, they involve problems in mass production, such as complex synthesis. In contrast, we propose the use of mass-produced material as the carbon precursor because the utilization of material mass-produced by existing facilities is crucial for ensuring availability and low costs. Such characteristics are imperative for industrialization. Moreover, the 3DCS electrode exhibits high charge-rate characteristics and cycle durability. This is due to the high electrical conductivity provided by the 3D junction-less carbon sponge structure shown in Fig. 1(a), as well as the high ion conductivity owing to the high porosity and surface area, as shown in Fig. 1(b). This high-availability, high-rate capability, high-cycle durability, low-cost carbon material for LIB anodes is beneficial for research institutions and companies that do not have facilities.
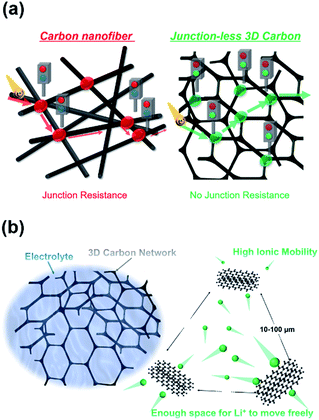 | ||
| Fig. 1 Schematic of the high – (a) electrical conductivity and (b) ion conductivity carbon melamine sponge structure. | ||
Experimental
Materials
The melamine sponge was purchased from LEC (Tokyo, Japan). Polyacrylonitrile (PAN, average Mw ∼ 150![[thin space (1/6-em)]](https://www.rsc.org/images/entities/char_2009.gif) 000) was purchased from Sigma-Aldrich (USA). N,N-dimethylformamide (DMF; 99.5%) was purchased from Tokyo Chemical Industry Co. Inc. (Tokyo, Japan). LiPF6 (1 mol L−1) in ethylene carbonate (EC)/dimethyl carbonate (DMC) (1
000) was purchased from Sigma-Aldrich (USA). N,N-dimethylformamide (DMF; 99.5%) was purchased from Tokyo Chemical Industry Co. Inc. (Tokyo, Japan). LiPF6 (1 mol L−1) in ethylene carbonate (EC)/dimethyl carbonate (DMC) (1![[thin space (1/6-em)]](https://www.rsc.org/images/entities/char_2009.gif) :
:![[thin space (1/6-em)]](https://www.rsc.org/images/entities/char_2009.gif) 1 v/v%) solution was purchased from Kishida Chemical (Osaka, Japan).
1 v/v%) solution was purchased from Kishida Chemical (Osaka, Japan).
Carbonization of the junction-less 3DCS
The melamine sponges were carbonized in N2 atmosphere at 600, 800, and 1000 °C, respectively, for 1 h each (heating rate: 5 °C min−1).Preparation of comparison sample
For comparison, we prepared electrospun carbon nanofiber (ES-CNF). PAN (10 wt%) was dissolved in DMF with stirring for at least 48 h at 60 °C. The solution was loaded into a plastic syringe and Al substrates were mounted on a metal collector. The applied voltage was set to 10 kV, the distance between the needle tip and collector was set to 20 cm, the solution flow rate was 1.0 mL h−1, and humidity was maintained at 30–40% by silica gel. After electrospinning, the as-spun membranes were removed from the Al collector and cut into 3 cm × 3 cm. The PAN nanofibers were first stabilized in air at 280 °C for 2 h (heating rate: 1 °C min−1) and then carbonized in N2 atmosphere at 1000 °C for 1 h (heating rate: 5 °C min−1).Characterization of the composite nanofibers
The surface morphology was determined using a field emission scanning electron microscope (S-4700, Hitachi, Tokyo, Japan) and accelerated surface area and porosimetry system (ASAP, shimadzu, Kyoto, Japan). ImageJ was used for image analysis.26 The electric resistance was determined with a four-terminal resistance meter (Loresta-GP, Mitsubishi chemical analytech, Japan). The functional groups were determined using Fourier transform infrared spectroscopy (FT-IR) (ALPHA, Bruker optics, Germany). The carbon microstructure was established using Raman spectroscopy (inVia confocal Raman microscope, Renishaw, Gloucestershire, United Kingdom). The chemical surface state was determined using X-ray photoelectron spectroscopy (XPS) (JPS-9010 TR, JEOL, Tokyo, Japan).Electrochemical measurements
The electrochemical properties of the carbonized melamine sponge were characterized using 2032-coin cells with a lithium metal foil as the anode. 3DCS mass loading is 1.9 mg cm−2. Copper-foil collectors and poly (vinylidene fluoride) binder were not used in the preparation of the working electrodes, for these 2032-coin cells. The separator consisted of a 25 μm microporous monolayer membrane (Celgard 2500, Celgard, Charlotte, North Carolina, USA), whereas the electrolyte was 1 mol L−1 LiPF6 in EC/DMC (1![[thin space (1/6-em)]](https://www.rsc.org/images/entities/char_2009.gif) :
:![[thin space (1/6-em)]](https://www.rsc.org/images/entities/char_2009.gif) 1 v/v%). The cells were assembled in a dry air-filled glove box (Galaxy, Matsuura Manufactory Corporation, Tokyo, Japan) and cycled in a voltage range of 3.0–0.05 V with a multi-channel charge–discharge device. The alternating current impedance of cells was determined with battery tester (BATTERY HiTESTER, Hioki, Nagano, Japan). The discharge and charge current values were increased to 50, 100, 250, 500, 1000, 2000, 3000, and 4000 mA g−1, every three cycles, for examining the current load characteristics. Further, the current value was set to 1000 mA g−1 for the cycle charge–discharge test. The current value was set to 100 mA g−1 for examining the capacity retention, under the cycle charge–discharge test.
1 v/v%). The cells were assembled in a dry air-filled glove box (Galaxy, Matsuura Manufactory Corporation, Tokyo, Japan) and cycled in a voltage range of 3.0–0.05 V with a multi-channel charge–discharge device. The alternating current impedance of cells was determined with battery tester (BATTERY HiTESTER, Hioki, Nagano, Japan). The discharge and charge current values were increased to 50, 100, 250, 500, 1000, 2000, 3000, and 4000 mA g−1, every three cycles, for examining the current load characteristics. Further, the current value was set to 1000 mA g−1 for the cycle charge–discharge test. The current value was set to 100 mA g−1 for examining the capacity retention, under the cycle charge–discharge test.
Results and discussion
Characterization of the junction-less 3DCS
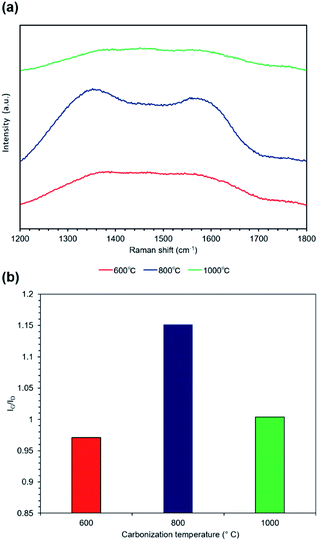
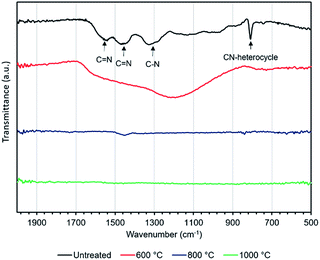
FE-SEM images of the melamine and carbonized melamine sponge surface morphologies are shown in Fig. 2(a), where two change points can be observed. One is a change in the fiber diameter and the other is a change in the conductivity seen by the charge-up. Fig. 2(b) shows the fiber diameter histogram of the melamine sponge, before and after carbonization at 1000 °C, by imaging analysis. The average fiber diameter of the melamine sponge decreases from 5.0 μm to 2.7 μm. This is because the melamine was partially burnt, when it was carbonized. Fig. 2(c) shows the resistance of the melamine sponge at various carbonization temperatures. At carbonization temperatures below 600 °C, the melamine sponge behaves as an insulator; however, it becomes a conductor at carbonization temperatures higher than 800 °C. When the carbonization temperature is 1000 °C, the resistance of the melamine sponge is minimum at 24 Ω. This is because the graphitization of the melamine sponge is accelerated by the increase in the carbonization temperature.27 Also, Fig. 2(d) shows that carbonization greatly contributes to the improvement of the specific surface area. This reduces the reaction resistance. Fig. 3(a) shows the Raman spectrum of the carbonized melamine sponge at various carbonization temperatures. The extent of graphitization of the samples was estimated by considering the ratio between the D-band (disorder-induced phonon mode: 1250 and 1450 cm−1) and G-band (graphite band: 1550 and 1660 cm−1) intensities. The former can be attributed to defects and the disordered portions of carbon (sp3-coordinated), whereas the latter can be attributed to the ordered graphitic crystallites of carbon (sp2-coordinated). The ratio between the D and G band intensities (ID/IG) can be used to analyze the number of carbon defects in self-standing iron oxide/carbon composite electrospun nanofibers. A high IG/ID ratio indicates a large amount of sp2-coordinated carbon. Generally, the IG/ID ratio increases marginally on increasing the carbonization temperature. However, the IG/ID ratio is maximum, when the carbonization temperature is 800 °C, as shown in Fig. 3(b). On the other hand, when the carbonization temperature is 1000 °C, the IG/ID ratio decreases. Generally, when the IG/ID ratio increases, the resistance decreases. This result is not consistent with the decrease in the resistance. When the carbonization temperature is 1000 °C, the decrease in the full-width-at-half maximum (FWHM) of the G band is significantly more than that of the D band, as shown in Fig. S1.† A high FWHM in the Raman spectrum indicates a large crystallite size; conversely, a decrease in the FWHM indicates a decrease in the crystallite size. Hence, it was determined that at carbonization temperatures higher than 800 °C, oxidation does not promote carbonization.Fig. 4 shows the FT-IR absorption spectra of the carbonized melamine sponge. The peaks at 1452 and 1541 cm−1 are due to C![[double bond, length as m-dash]](https://www.rsc.org/images/entities/char_e001.gif) N stretching; whereas, the peaks at 1323 cm−1 and 810 cm−1 are due to aromatic C–N stretching and C–N heterocycles,28 respectively. At carbonization temperatures higher than 800 °C, all the absorption peaks are considerably reduced. At a carbonization temperature of 800 °C, a slight C
N stretching; whereas, the peaks at 1323 cm−1 and 810 cm−1 are due to aromatic C–N stretching and C–N heterocycles,28 respectively. At carbonization temperatures higher than 800 °C, all the absorption peaks are considerably reduced. At a carbonization temperature of 800 °C, a slight C![[double bond, length as m-dash]](https://www.rsc.org/images/entities/char_e001.gif) N peak remains. When the carbonization temperature reaches 1000 °C, the peak disappears almost completely. This indicates a decrease in the 3DCS functional group, i.e., the resistance is decreased due to the loss of the functional group in the melamine sponge. In addition to Raman's results, it can be seen that the amount of nitrogen contained is considerably reduced, when carbonization is promoted. Hence, the improvement in the conductivity is not due to the progress of graphitization, but due to the reduction of the nitrogen-containing polymer.
N peak remains. When the carbonization temperature reaches 1000 °C, the peak disappears almost completely. This indicates a decrease in the 3DCS functional group, i.e., the resistance is decreased due to the loss of the functional group in the melamine sponge. In addition to Raman's results, it can be seen that the amount of nitrogen contained is considerably reduced, when carbonization is promoted. Hence, the improvement in the conductivity is not due to the progress of graphitization, but due to the reduction of the nitrogen-containing polymer.
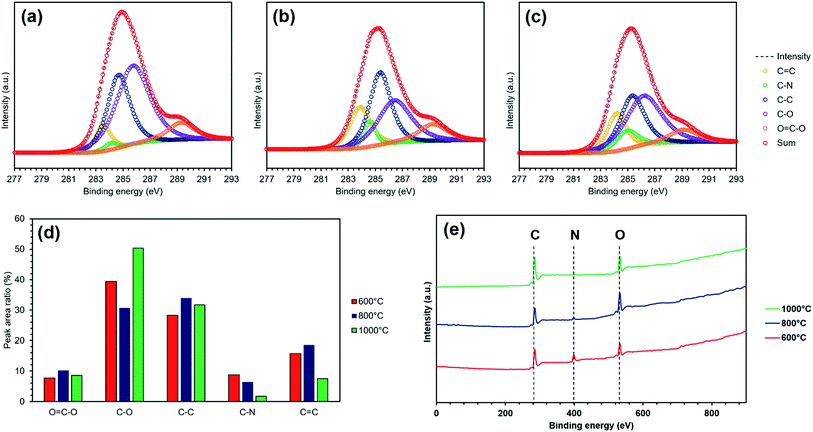
Fig. 5 shows the XPS peak of the carbonized melamine sponge. Fig. 5(d) depicts the ratio of each coupling, obtained by decomposing the XPS spectra of Fig. 5(a)–(c). As the carbonization temperature increases, the C–N bond proportion decreases. This is consistent with the result of the FT-IR. However, as the carbonization temperature is increased, the C![[double bond, length as m-dash]](https://www.rsc.org/images/entities/char_e001.gif) C bond does not monotonically increase. When the carbonization temperature is 1000 °C, the C
C bond does not monotonically increase. When the carbonization temperature is 1000 °C, the C![[double bond, length as m-dash]](https://www.rsc.org/images/entities/char_e001.gif) C bond decreases compared to that at a carbonization temperature of 800 °C. Thus, the reason for the decrease in resistance in the melamine sponge after carbonization is not the increased graphite layer. This is consistent with the decrease in the IG/ID ratio. On the other hand, the C–O bond increases in contrast with the C
C bond decreases compared to that at a carbonization temperature of 800 °C. Thus, the reason for the decrease in resistance in the melamine sponge after carbonization is not the increased graphite layer. This is consistent with the decrease in the IG/ID ratio. On the other hand, the C–O bond increases in contrast with the C![[double bond, length as m-dash]](https://www.rsc.org/images/entities/char_e001.gif) C bond.
C bond.
This is caused by the oxidation of the melamine sponge by heating. Thus, the improvement in conductivity is not due to the progress of graphitization, but is due to the decrease in the C–N bonds. Although the conductivity is improved, the occupation of most of surface bonds by the C–O bonds is a problem. This is a less-desirable characteristic, considering the irreversible capacity; hence, there is need for improvement.
Electrochemical measurements
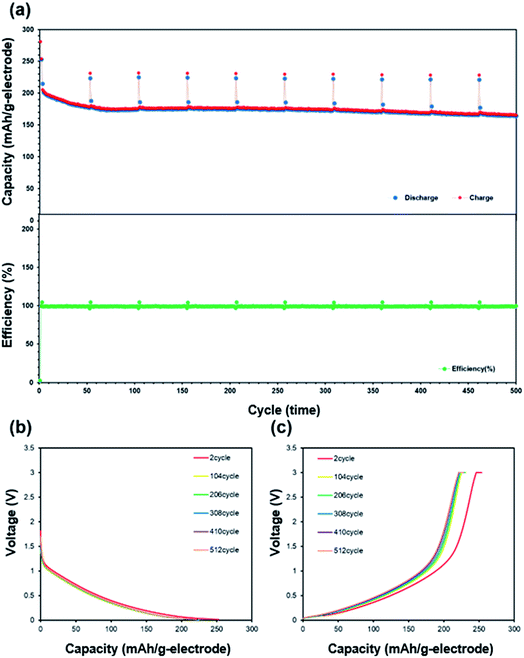
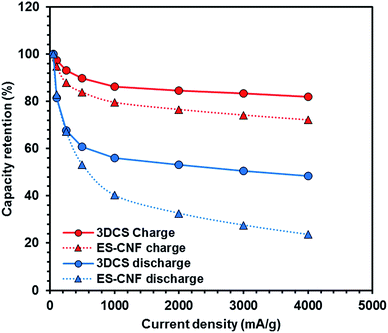
The charge/discharge rate characteristics are shown in Fig. 6. Melamine sponge carbonized at 1000 °C exhibited a high irreversible reaction in the first cycle. This was caused by the functional group produced by carbonization.29 This functional group reacted with the electrolyte and generated a solid electrolyte interface. 3DCS at 1000 °C carbonization exhibited considerably high rate characteristics; however, at carbonizations other than 1000 °C, it could not pass the charge/discharge rate test in Fig. S2.† These were caused by different cell resistance in Fig. 7. These resistances were excessive for evaluating the rate characteristics. This is due to the difference in the electric conductivity of 3DCS at 1000 °C carbonization. As shown in Fig. 2(c), 3DCS at 1000 °C carbonization is one twentieth that of the carbonization at 800 °C. When the current density was 4000 mA g−1, the charge capacity retention ratio was 80% and the discharge capacity retention ratio was 95.4%. These values are considerably high. The difference between the retention of charge and discharge may be owing to the influence of the cut-off voltage. Such high rate characteristics may be exhibited because the sponge structure has high electrical and ion conductivity due to the junction-less and porous structure. In addition, the initial irreversible capacity may be due to the functional group remaining on the surface. This initial irreversibility is one of the problems to be addressed in future. Fig. 8 shows the results of the cycle durability test. Although some deterioration is confirmed in the initial 50 cycles, there is almost no deterioration thereafter (Fig. 8(a)). Fig. 8(b) and (c) show the charge/discharge curves, respectively, loaded at 100 mA g−1. There were no changes in these curves. If the resistance increases, the curve changes due to ohmic drop. Hence, there was no deterioration in the resistance. There were nearly no changes in the charge/discharge efficiency, during 500 cycles; this does not indicate an increase in the side reactions. From these results, it can be determined that the junction-less 3DCS electrode has high cycle durability. Fig. 9 shows the comparison between the discharge and charge rate capacity retention ratios of 3DCS and ES-CNF. For both charging and discharging, 3DCS showed better characteristics compared to the ES-CNF.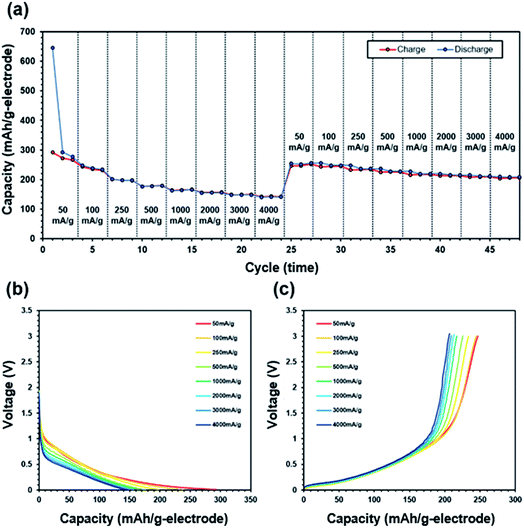 | ||
| Fig. 6 (a) Discharge and charge rate capabilities, (b) discharge curve, and (c) charge curve of melamine-derived carbon sponge after carbonization at 1000 °C at various current loads. | ||
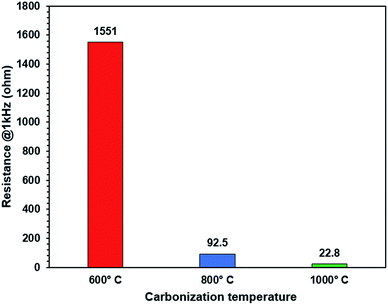 | ||
| Fig. 7 Alternating current impedance of the melamine sponge after carbonization at 600 °C (red), 800 °C (blue), 1000 °C (green). | ||
These characteristics are owing to a high electrode strength due to the junction-less sponge structure.
These results demonstrate that junction-less 3DCS electrodes without non-active material have significant potential as LIB anode material.
Conclusions
We fabricated junction-less 3DCS electrodes with excellent rate and cycle characteristics, without using non-active materials such as conductive agents and binders. These characteristics are owing to the high electrical and ionic conductivities resulting from the porous and junction-less structure of the carbon electrodes. Such high-performance electrodes made from mass-produced materials are useful in several aspects.In future, we intend to propose a combination of a junction-less 3DCS electrode and metal oxide for the LIB anode and for application to a metal air battery.
Conflicts of interest
There are no conflicts to declare.Acknowledgements
This work was supported by the Graduate School Doctoral Student Grant-in-Aid Program 2016 (Keio University). We are grateful to the Shiratori Laboratory Members, Yuka Abe and Fumika Abe.Notes and references
- B. Scrosati, J. Solid State Electrochem., 2011, 15, 1623–1630 CrossRef CAS.
- J. M. Tarascon and M. Armand, Nature, 2001, 414, 359–367 CrossRef CAS PubMed.
- A. Burke, Proc. IEEE, 2007, 95, 806–820 CrossRef.
- B. Dunn, H. Kamath and J.-M. Tarascon, Science, 2011, 334, 928–935 CrossRef CAS PubMed.
- L. Ji, Z. Lin, M. Alcoutlabi and X. Zhang, Energy Environ. Sci., 2011, 4, 2682–2699 CAS.
- L. Croguennec and M. R. Palacin, J. Am. Chem. Soc., 2015, 137, 3140–3156 CrossRef CAS PubMed.
- M. Wakihara, Mater. Sci. Eng., R, 2001, 33, 109–134 CrossRef.
- M. Hu, X. Pang and Z. Zhou, J. Power Sources, 2013, 237, 229–242 CrossRef CAS.
- M. Zheng, X. B. Wu and Y. Yang, Electrochim. Acta, 2011, 56, 3071–3078 CrossRef.
- C. K. Chan, H. Peng, G. Liu, K. McIlwrath, X. F. Zhang, R. A. Huggins and Y. Cui, Nat. Nanotechnol., 2008, 3, 31–35 CrossRef CAS PubMed.
- C. K. Chan, H. L. Peng, G. Liu, K. McIlwrath, X. F. Zhang, R. A. Huggins and Y. Cui, Nat. Nanotechnol., 2008, 3, 31–35 CrossRef CAS PubMed.
- J.-M. Tarascon, P. Poizot, S. Laruelle, S. Grugeon and L. Dupont, Nature, 2000, 407, 496–499 CrossRef PubMed.
- G. Q. Zhang, H. Bin Wu, H. E. Hoster, M. B. Chan-Park and X. W. (David) Lou, Energy Environ. Sci., 2012, 5, 9453 CAS.
- C. Ban, Z. Wu, D. T. Gillaspie, L. Chen, F. Yan, J. L. Blackburn and A. C. Dillon, Adv. Mater., 2010, 22, 145–149 CrossRef PubMed.
- L.-F. Cui, L. Hu, J. Wook and Y. Cui, ACS Nano, 2010, 4, 3671–3678 CrossRef CAS PubMed.
- Y. Gambe, Y. Sun and I. Honma, Sci. Rep., 2015, 5, 8869 CrossRef CAS PubMed.
- T. Matsuo, Y. Gambe, Y. Sun and I. Honma, Sci. Rep., 2014, 4, 6084 CrossRef CAS PubMed.
- F. Jeschull, F. Lindgren, M. J. Lacey, F. Björefors, K. Edström and D. Brandell, J. Power Sources, 2016, 325, 513–524 CrossRef CAS.
- L. Ji and X. Zhang, Nanotechnology, 2009, 20, 314–331 Search PubMed.
- J. Abe, K. Kawase, N. Tachikawa, Y. Katayama and S. Shiratori, RSC Adv., 2017, 7, 32812–32818 RSC.
- M. N. Hyder, R. Kavian, Z. Sultana, K. Saetia, P. Y. Chen, S. W. Lee, Y. Shao-Horn and P. T. Hammond, Chem. Mater., 2014, 26, 5310–5318 CrossRef CAS.
- M. N. Hyder, B. M. Gallant, N. J. Shah, Y. Shao-Horn and P. T. Hammond, Nano Lett., 2013, 13, 4610–4619 CrossRef CAS PubMed.
- D. Hulicova, J. Yamashita, Y. Soneda, H. Hatori and M. Kodama, Chem. Mater., 2005, 17, 1241–1247 CrossRef CAS.
- P. Zhang, R. Wang, M. He, J. Lang, S. Xu and X. Yan, Adv. Funct. Mater., 2016, 26, 1354–1364 CrossRef CAS.
- M. Yu, C. Wang, Y. Bai, Y. Wang, Q. Wang and H. Liu, Polym. Bull., 2006, 57, 525–533 CrossRef CAS.
- M. D. Abràmoff, P. J. Magalhães and S. J. Ram, Int. J. Chem. Kinet., 2004, 11, 36–41 Search PubMed.
- J. K. Lee, K. W. An, J. B. Ju, B. W. Cho, W. Il Cho, D. Park and K. S. Yun, Carbon, 2001, 39, 1299–1305 CrossRef CAS.
- V. N. Khabashesku, J. L. Zimmerman and J. L. Margrave, Chem. Mater., 2000, 12, 3264–3270 CrossRef CAS.
- J. Collins, G. Gourdin, M. Foster and D. Qu, Carbon, 2015, 92, 193–244 CrossRef CAS.
Footnote |
| † Electronic supplementary information (ESI) available: Supplementary data of the fabricated method of the comparative product and Raman spectra. See DOI: 10.1039/c7ra12759f |
| This journal is © The Royal Society of Chemistry 2018 |


