
 Open Access Article
 This Open Access Article is licensed under a
 Creative Commons Attribution 3.0 Unported Licence
High rate capability by sulfur-doping into LiFePO4 matrix†
K. Okada ab,
I. Kimuraa and
K. Machida*a
ab,
I. Kimuraa and
K. Machida*a
aDivision of Applied Chemistry, Graduate School of Engineering, Osaka University, Suita, Osaka 565-0871, Japan. E-mail: machida@chem.eng.osaka-u.ac.jp
bDepartment of Materials Science, Graduate School of Engineering, Osaka Prefecture University, Sakai, Osaka 599-8531, Japan
First published on 6th February 2018
Abstract
Enhanced electrochemical performance of LiFePO4 for Li-ion batteries has been anticipated by anion doping at the O-site rather than cation doping at the Fe-site. We report on the electrochemical performance of S-doped LiFePO4 nanoparticles synthesized by a solvothermal method using thioacetamide as a sulfur source. S-doping into the LiFePO4 matrix expands the lattice due to the larger ionic radius of S2− than that of O2−. The lattice parameters a and b increase by around 0.2% with sulfur content, while that of c remains almost unchanged with only 0.03% increase. The S-doping also contributes to the suppression of antisite defects (Fe occupying Li sites), which facilitates the easy migration of Li in the diffusion channels without blockage. Owing to these effects of S-doping, the S-doped LiFePO4 nanoparticles show enhanced electrochemical properties with a high discharge capacity of ∼113 mA h g−1 even at a high rate of 10C.
Introduction
Rechargeable lithium-ion batteries (LIBs) are widely used for portable electronics and are also considered as promising energy storage devices for electric vehicles due to their long cycle life and high energy density.1,2 Ensuring safety of the devices and the use of environmentally-friend and cheap materials are important requirements to deal with further use of LIBs in the near future. Also, the current requirement for LIBs is to achieve both high charging/discharging rates and high capacity.3 Development of cathode materials plays an important role in satisfying these requirements because anode materials (mainly carbon materials) already exhibit high capacity at high charging/discharging rates.4,5Olivine-structured LiFePO4 is considered as one of the most promising cathode materials for LIBs due to its high thermal stability, good cycling property, high energy density, theoretical capacity, and environmental friendliness as well as low cost.6,7 Although the theoretical capacity (170 mA h g−1) of LiFePO4 is a bit lower than that of conventional cathode materials (e.g., LiCoO2: 274 mA h g−1), its benefits such as low toxicity, high safety, low-cost and good cycling property will make LiFePO4 replaced to conventional cathode materials as now being produced commercially.8,9 However, its poor electronic conductivity (10−8 to 10−10 S cm−1) and low lithium ion diffusion coefficient (10−10 to 10−16 cm2 s−1) lead to a decreased capacity at a high charging/discharging rate, which has inhibited the use in high-rate applications.10–13 Many efforts have been made to solve the problems by mainly three strategies: (1) carbon coating,14,15 (2) reducing particle size,16,17 (3) doping with certain element.18–20 Excellent electrochemical properties have been reported by combining these three strategies. The carbon coating can increase the surface electronic conductivity, leading to an improvement of rate performance and cycling life. The method of carbon coating has been developed and established already as a thermal treatment of the mixture of LiFePO4 and carbon sources under inert gas. Reducing particle size can shorten the Li+ diffusion pathway length, that is an effective way to improve rate capability. Hydro/solvo-thermal synthesis approaches have been applied to obtain the LiFePO4 nanoparticles. As for the doping strategy, doping proper ions into the LiFePO4 can increase the electronic and ionic conductivity of the LiFePO4 and also expand lithium ions diffusion channels in the structure, leading to a significant improvement of the rate capability and cyclic performance. Various elements such as La, Cu, Y, V, Mn, Mg, Bi, Co, Pt, Pd, Ni, Zn, Mo and Cr have been previously used as dopant elements in cation-site (Fe-site) of LiFePO4. Certain cation doping elements like Ni and Zn can remarkably enhance the electrochemical performance of LiFePO4.21–24 There are much less reports on anion doping at O-site for LiFePO4. However, the O-site doping is expected to significantly enhance the conductivity of LiFePO4 rather than Fe-site doping as indicated by first-principle calculations.25,26 Indeed, significantly enhanced high rate capability and cycling performance have been reported for anion-doped (such as F and Cl) LiFePO4.27–29 Among considerable anion species, sulfur doping would be efficient to improve the electrochemical performance (rate capability and cyclic performance) because easy Li+ intercalation and extraction are expected by an expansion of lattice arising from larger anion doping and the lower bond dissociation energy of Li–S (312.5 kJ mol−1) than that of Li–O (340.5 kJ mol−1).30 Sulfur-doping has been only reported by Park et al. where S-doped LiFePO4 nanoparticles exhibit enhanced electrochemical properties compared to non-doped and N-doped LiFePO4.31 However, only surface substitution of LiFePO4 nanoparticles was achieved by exposing solvothermally-synthesized LiFePO4 nanoparticles to sulfur vapor at high temperature. The further enhancement of electrochemical properties can be expected for the sulfur doping into the LiFePO4 matrix.
Herein, we report on the synthesis of S-doped LiFePO4 nanoparticles by a single-step solution approach and its improved electrochemical performance compared to non-doped LiFePO4. Thioacetamide was used as a sulfur source, which was the conventional way for the synthesis of S-doped TiO2 and metal sulfide such as CdS, ZnS and Bi2S3 by the solution approach.32–35 The successful S-doping into LiFePO4 matrix was confirmed by X-ray diffraction (XRD), energy dispersive X-ray spectrometry (EDS) analysis and X-ray photoelectron spectrometry (XPS). The formation of LiFePO4 nanoparticles with ∼100 nm in diameter was observed by scanning electron microscopy (SEM). The S-doped LiFePO4 nanoparticles showed a high discharge capacity of ∼113 mA h g−1 even at a high rate of 10C.
Experimental
Preparation of non-doped and S-doped LiFePO4 nanoparticles
Non-doped and S-doped LiFePO4 nanoparticles were prepared by a solvothermal method. The non-doped LiFePO4 nanoparticles were prepared as following the literature.36 At first, 6 mmol of FeSO4·7H2O and 6 mmol of H3PO4 (85%) were completely dissolved in 20 mL of ethylene glycol. At same time, 16.2 mmol of LiOH·H2O was also dissolved in 15 mL of ethylene glycol. Then, the solution containing a Li source was added dropwise to the solution containing Fe and P sources. The final molar ratio of Li![[thin space (1/6-em)]](https://www.rsc.org/images/entities/char_2009.gif) :Fe:P was 2.7:1:1. The reaction was carried out in an autoclave at 180 °C for 10 h. After the reaction, the resultant gray precipitate was washed with deionized water and ethanol for several times and then dried at 70 °C overnight under vacuum. S-doped LiFePO4 nanoparticles were prepared by adding thioacetamide with different amount (0.13, 0.40, 0.67, 1.33, 2.66 and 3.99 mmol) to the reaction solution containing Li, Fe and P sources before solvothermal treatment (the molar ratio; Li:Fe:P:S = 2.7:1:1:0.02, 0.07, 0.11, 0.22, 0.44 or 0.67). In the manuscript, the non-doped and S-doped LiFePO4 nanoparticles prepared with different amount of thioacetamide were denoted as LFP and LFP-S-x (where x = 0.02, 0.07, 0.11, 0.22, 0.44 or 0.67), respectively. For the electrochemical measurements, the dried samples with a certain amount of sucrose (10 wt%) were mixed in ethanol and calcined at 650 °C for 6 h under N2 atmosphere in order to obtain the carbon-coated samples.
:Fe:P was 2.7:1:1. The reaction was carried out in an autoclave at 180 °C for 10 h. After the reaction, the resultant gray precipitate was washed with deionized water and ethanol for several times and then dried at 70 °C overnight under vacuum. S-doped LiFePO4 nanoparticles were prepared by adding thioacetamide with different amount (0.13, 0.40, 0.67, 1.33, 2.66 and 3.99 mmol) to the reaction solution containing Li, Fe and P sources before solvothermal treatment (the molar ratio; Li:Fe:P:S = 2.7:1:1:0.02, 0.07, 0.11, 0.22, 0.44 or 0.67). In the manuscript, the non-doped and S-doped LiFePO4 nanoparticles prepared with different amount of thioacetamide were denoted as LFP and LFP-S-x (where x = 0.02, 0.07, 0.11, 0.22, 0.44 or 0.67), respectively. For the electrochemical measurements, the dried samples with a certain amount of sucrose (10 wt%) were mixed in ethanol and calcined at 650 °C for 6 h under N2 atmosphere in order to obtain the carbon-coated samples.
Characterization
The crystalline phases of samples were identified by X-ray diffraction (XRD; Rigaku, RINT-2200) using a Cu Kα radiation. The unit cell parameters were investigated by Rietveld refinement (using the RIETAN-FP program).37 Surface morphologies of samples were observed using a scanning electron microscope (SEM, Hitachi Corp., S-3000HXS); the energy dispersive X-ray analysis has been performed using 15 keV. X-ray photoelectron spectrometry (XPS) measurements were carried out using an electron spectrometer (Shimadzu Corp./Kratos, AXIS-165×) with an Al Kα X-ray source. The position of each peaks was collected by using C spectra. Fourier transform infrared spectroscopy (FTIR) measurements were carried out using a FTIR 4700 spectrometer (JASCO).:2.5:1) in N-methyl-2-pyrrolidone (NMP) solution. Then, the slurry was coated on an Al foil by using a coater. After being dried under vacuum at 90 °C for 10 h, working electrodes were punched and weighed. Then, the cells containing 1.0 mol L−1 LiPF6 in ethylene carbonate (EC)-diethyl carbonate (DEC) (1:1, v/v) as electrolyte were assembled in a glove box under a dry and high purity argon atmosphere. Charge/discharge tests were performed between 2.0 and 4.3 V by using a battery tester (Kikusui, PFX2011, Japan) at room temperature at around 20 °C.Results and discussion
Non-doped and S-doped LiFePO4 nanoparticles were prepared by a solvothermal method. The non-doped LiFePO4 nanoparticles were prepared from lithium, iron and phosphorus sources dissolved in ethylene glycol at 180 °C for 10 h as following the literature.36 For the sulfur doping, thioacetamide was added to the reaction solution. Hereafter, the non-doped and S-doped LiFePO4 nanoparticles prepared with different amount of thioacetamide were denoted as LFP and LFP-S-x (where x = 0.02, 0.07, 0.11, 0.22, 0.44 or 0.67), respectively. Fig. 1(a) shows XRD patterns of the obtained samples (where silicon was used as a standard). The peaks of LFP and LFP-S-x (x ≤ 0.22) were exclusively indexed to the LiFePO4 phase (JCPDS card number: 81-1173). While, the formation of FeS2 (JCPDS card number: 42-1340) was detected as an impurity for the samples prepared with an excess of thioacetamide (x ≥ 0.44). The unit cell parameters were investigated by Rietveld refinement (using the RIETAN-FP program).37 An increase of lattice parameters with sulfur doping amount was confirmed as shown in Fig. 1(b) and Table S1,† indicating the successful doping of sulfur in LiFePO4 matrix because the ionic radius of S2− (1.84 Å) is larger than O2− (1.40 Å).38 Interestingly, the lattice parameters of a and b were found to increase by around 0.2% with sulfur doping, while that of c remained almost unchanged as only 0.03% increase. Such large changes of a and b lattice parameters were similarly reported for the F-doping into LiFePO4.39 In the case of cation doping at Fe-site, the most cationic elements (except vanadium) are found to change the lattice parameters uniformly in literature.40–45 Thus, it should be noted that the anion doping at O-site can specially change the a and b lattice parameters and remain c lattice parameter unchanged, which is not observed for cation doping. That might be explained by the position of oxygen atoms in the LiFePO4 lattice. Oxygen atoms are located parallel to the a and b axes of LiFePO4 lattice while irregularly for the c axis.46 Thus, it can be considered that the sulfur doping at O-site simply expands the lattice along the both a and b axes and the stress of c axis induced by the sulfur doping are released toward a and b axes by distortion, which would induce the specific changes for a and b axes of LiFePO4 lattice. The expansion of LiFePO4 lattice by sulfur doping was maintained after carbon coating at 650 °C under inert atmosphere (Fig. S1†). A further increase in a and b lattice parameters was observed after the carbon coating process. The thermal treatment at 650 °C might make the crystal structure more stable by displacing the S atoms into favored positions and minimizing ion disorder.47 The expansion of LiFePO4 lattice by a sulfur doping would give us the benefit of high capacity at high charging/discharging rate because of easy Li+ intercalation and extraction by expanded lithium ions diffusion channels.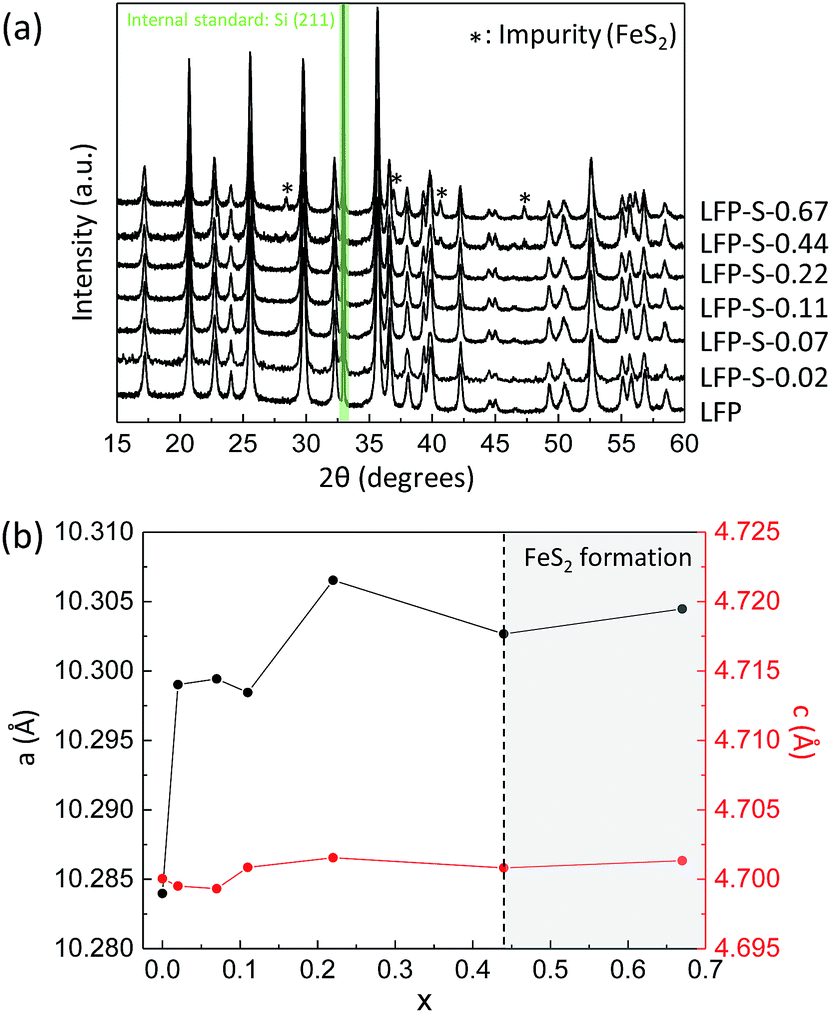 | ||
| Fig. 1 (a) XRD patterns of LFP and LFP-S-x (where x = 0.02, 0.07, 0.11, 0.22, 0.44 or 0.67) (silicon was used as a standard). (b) Changes in a and c lattice parameters of LFP-S-x (x: from 0 to 0.67). | ||
Fig. 2 shows the SEM images of LFP, LFP-S-0.22 and LFP-S-0.67. Uniform nanoparticles with ∼100 nm in diameter were observed for LFP (Fig. 2(a)). Similar nanoparticles formed in LFP-S-0.22 (Fig. 2(b)), indicating S-doping did not affect the morphology. In the LFP-S-0.67, larger and crystalline particles over 1 μm were observed with the presence of LiFePO4 nanoparticles (Fig. 2(c) and (d)). The large particles were concluded as an impurity FeS2 by the XRD result and EDS analysis (Fig. S2†). EDS mapping and analysis for S-doped LiFePO4 (LFP-S-0.22) confirmed that sulfur was uniformly dispersed as an atomic percent of ∼1.4% (Fig. 3 and S3†). Based on this result, the composition of LFP-S-0.22 was estimated as LiFePO3.9S0.1.
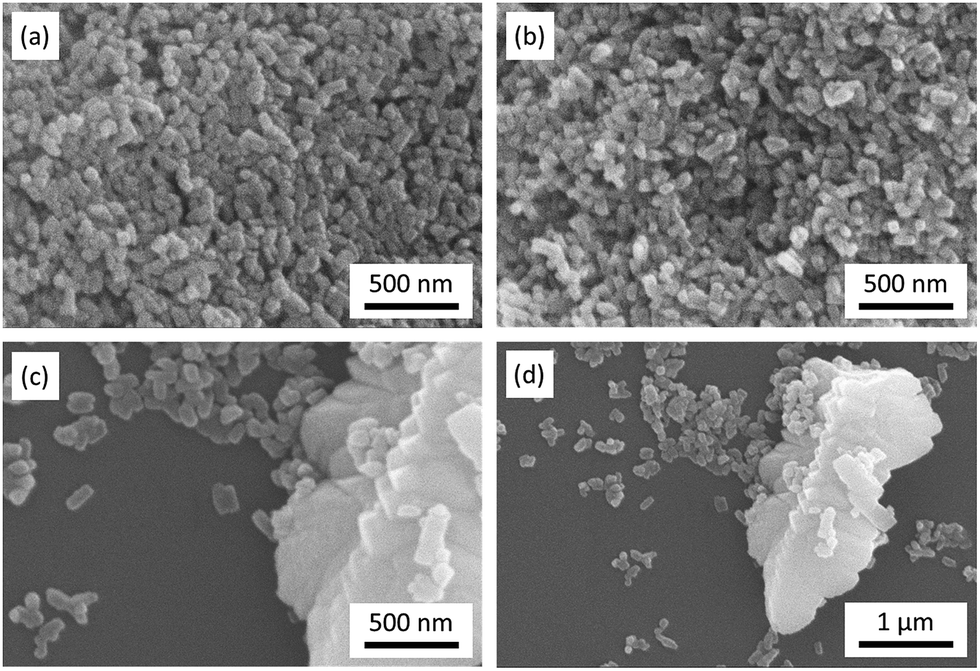 | ||
| Fig. 2 SEM images of LFP (a), LFP-S-0.22 (b) and LFP-S-0.67 (c and d). | ||
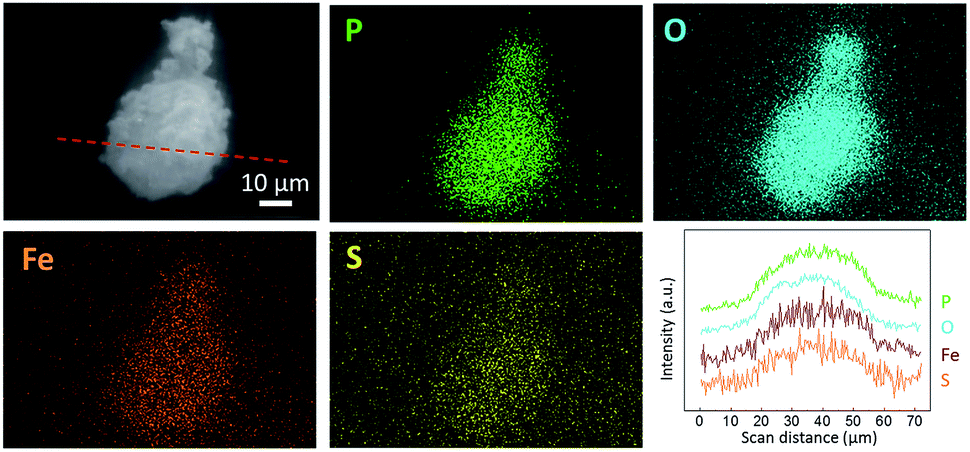 | ||
| Fig. 3 Secondary electron image (SEI), EDS mapping images and line scan profile of LFP-S-0.22 for P, O, Fe and S. The line scan profile was collected in the red dot line of the SEI image. | ||
The chemical states of sulfur, phosphorous and oxygen ions were investigated by XPS (Fig. 4). Fig. 4(a) shows the XPS spectra for the S 2p electrons of LFP, LFP-S-0.22 and LFP-S-0.67. A broad peak at around 160–163 eV was confirmed in the LFP-S-0.22 although no peaks was detected in LFP. The peak was fitted as the core levels of S 2p1/2 (at 162.4 eV) and S 2p3/2 (at 161.4 eV) separated by a spin–orbit splitting of 1.0 eV, demonstrating that the sulfur atoms are doped in the state of S2−.48,49 On the other hand, a broad peak at ∼1.0 eV higher than that of LFP-S-0.22 was detected in LFP-S-0.67. The peak at higher energy could be assigned to that of disulfide derived from FeS2.50,51 The presence of FeS2 in LFP-S-0.67 was consisted with the XRD results. The XPS spectra for the P 2p electrons of LFP, LFP-S-0.22 and LFP-S-0.67 are shown in Fig. 4(b). As shown in Fig. 4(b), the sulfur doping shifted the P 2p XPS peak to lower binding energy. Similar chemical shift of binding energy has been reported for the nitrogen doping at Li3PO4 and Na3PO4 where a decrease in the P 2p binding energy was explained by simple charged-shell models52,53 as reducing the average ionic charge on the phosphorus ions due to the replacement of P–O bonds with less ionic P–N bonds.54,55 The binding energy chemical shift by sulfur doping to LiFePO4 can be explained by the similar effect; reducing the average ionic charge on the phosphorus ions due to the replacement of P–O bonds with less ionic P–S bonds results in the lower P 2p binding energy. O 1s XPS peaks in LFP-S-0.22 also showed lower binding energy compared to LFP, which is similar to N-doped Li3PO4 and Na3PO4 (ref. 54) (Fig. S4†). These XPS results for the S 2p, P 2p and O 1s electrons clearly indicate the successful S2− doping at O-site of LiFePO4 matrix.
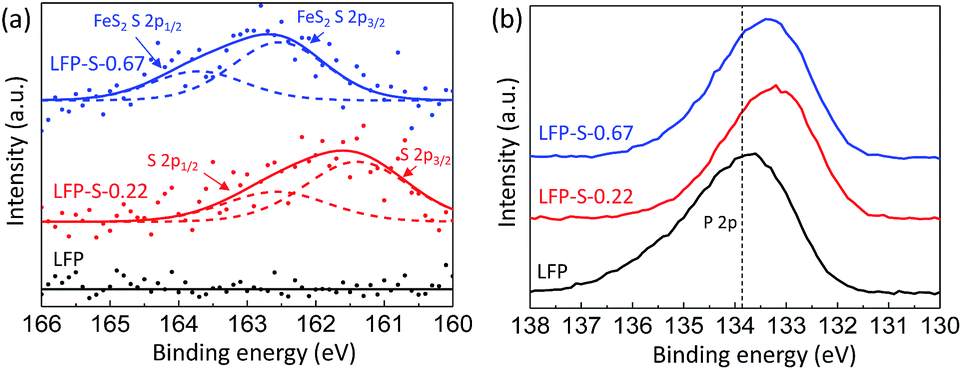 | ||
| Fig. 4 XPS spectra for the S 2p (a) and P 2p (b) electrons of LFP, LFP-S-0.22 and LFP-S-0.67. | ||
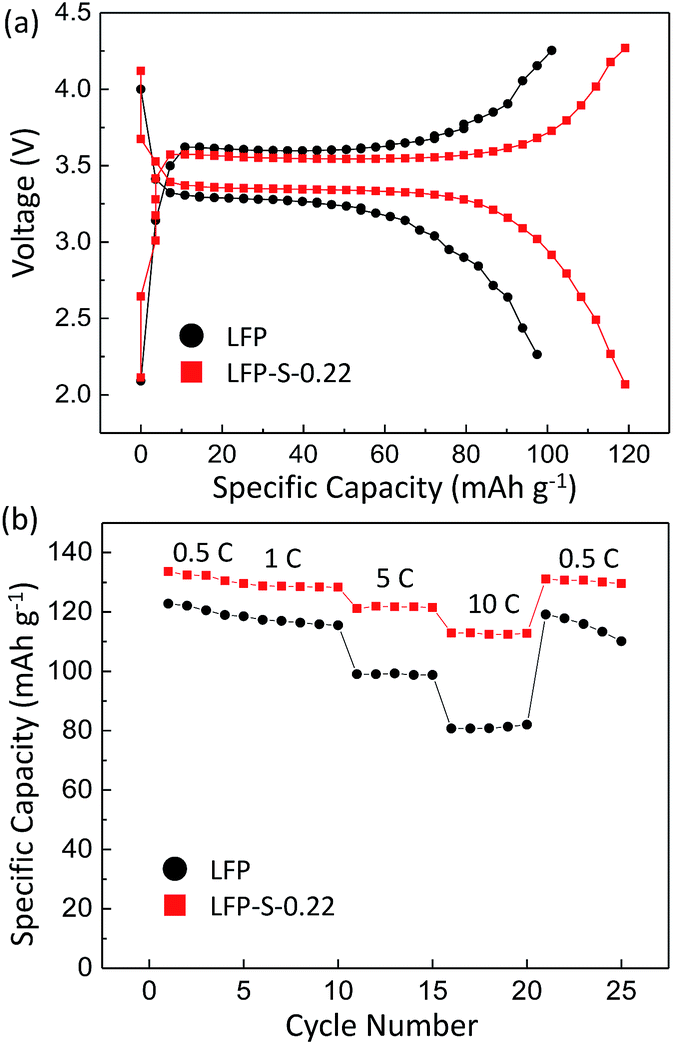
Electrochemical measurements were carried out to test the electrical properties of LFP and LFP-S-0.22 after carbon coating by following a reported method.56 Fig. 5(a) shows the charge/discharge curves of carbon-coated LFP and LFP-S-0.22 measured at 5C (850 mA g−1) between 2.0 and 4.3 V vs. Li+/Li. Both samples showed a charging and discharging plateau region at ∼3.4 V which is correspond to the redox reaction between FePO4 and LiFePO4.57 A smaller voltage difference between the charge and discharging plateaus was confirmed in LFP-S-0.22 compared to LFP, implying that LFP-S-0.22 possess the better electronic conductivity and higher reaction reversibility.58 The non-doped LFP presented a discharge capacity of 99.0 mA h g−1 at 5C. In contrast, S-doped LFP-S-0.22 led to a higher discharge capacity of 121.6 mA h g−1 at 5C. The discharge capacities of LFP and LFP-S-0.22 were investigated at different rates from 0.5C to 10C in order to examine the rate capabilities (Fig. 5(b)). The LFP-S-0.22 showed much higher discharge capacities (131.7, 128.5, 121.6 and 112.7 mA h g−1 at 0.5, 1, 5 and 10C, respectively) at each rates compared to LFP (120.6, 116.4, 99.0 and 81.1 mA h g−1 at 0.5, 1, 5 and 10C, respectively). In addition, the discharge capacity of LFP-S-0.22 varied much smaller from 128.5 to 112.7 mA h g−1 at rates of 1C to 10C, retaining 87.7% of discharge capacity. There was no difference between LFP and LFP-S-0.22 for coulombic efficiency at each C rate (Fig. S5†). These electrochemical investigations exhibited that sulfur doping into LiFePO4 effectively improved the rate capability. It has been considered that high rate capability can be achieved by an increase in electric conductivity of LiFePO4. The significantly enhanced high rate capability achieved in LFP-S-0.22 was considered due to an increase in electric conductivity by sulfur doping as expected by first-principle calculations.31 The differential capacity (dQ/dV) studies showed smaller peak voltage separation between the anodic and cathodic peaks in LFP-S-0.22 compared to LFP, indicating the smaller electrochemical polarization and better electrochemical kinetics of the S-doped LiFePO4 (Fig. S6†).59,60 Also, the LFP-S-0.22 exhibited higher internal electronic conductivity and lower resistance than LFP (Fig. S7†). In addition, the sulfur doping results in the suppression of  antisite defects (Fe occupying Li sites) in LiFePO4 which is important as it facilitates the easy migration of Li in the diffusion channels without blockage.61 The antisite defect is considered to be present in the one-dimensional channel of LiFePO4 and effectively block the Li+ pathways,62–64 which reduces the capacity, rate capability and cycle life of a battery. The suppression of
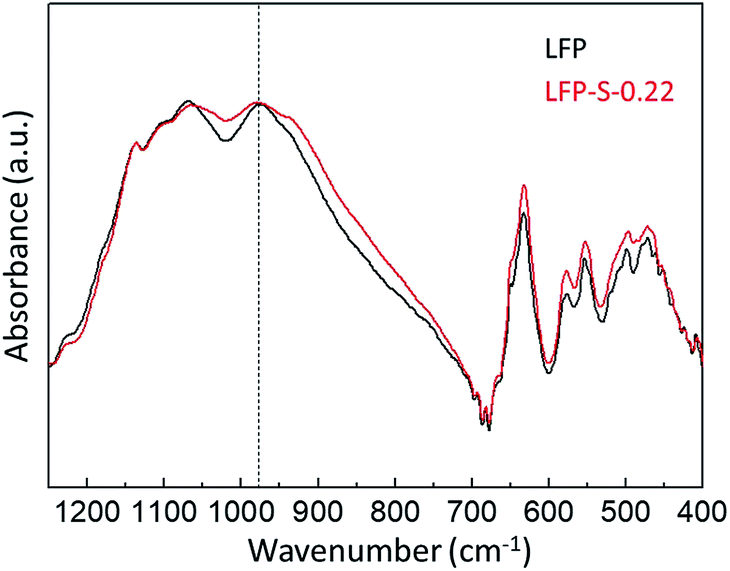
  antisite defects can be investigated by Fourier transform infrared (FTIR) spectra.39,65 Fig. 6 shows the FTIR spectra of LFP and LFP-S-0.22. The Infrared absorption spectra in the range 800–1200 cm−1 and 400–700 cm−1 were assigned to the symmetric (ν1) and asymmetric (ν3) P–O stretching, symmetric (ν2) and asymmetric (ν4) O–P–O bending in (PO4)3− tetrahedral, respectively.66 As shown in Fig. 6, the sulfur doping shifted a peak at ∼975 cm−1 to lower wavenumber, while there were no significant changes for the other peaks. This result is clearly consistent with the
  antisite defects-suppressed LiFePO4, suggesting sulfur doping into the LiFePO4 matrix can also suppress the formation of
  antisite defects. In the LiFePO4 structure, lithium and iron ions are surrounded by six oxygen atoms and occupy the different octahedral interstitial sites; Li ions occupy edge-sharing sites (M1) and Fe ions occupy corner-sharing sites (M2). The
  antisite defects reportedly form by cation intermixing (cation-exchanging) between the M1 and M2 sites.62 Our results indicate that the sulfur doping at O-site makes the Fe ions preferentially located in the M2 sites. In the reaction media, the sulfur prefers to react with iron ions as our XRD investigation revealed the formation of FeS2 with excess of sulfur sources and also the preferential formation of Fe–S bonds was reported in the sulfur-modified LiFePO4 on the surface by theoretical and experimental investigations.31 Then, the formed Fe–S species react with the H3PO4 by replacing O to S in the reaction media, which results in the preferential location of Fe in M2 sites by corner-sharing oxygen or sulfur atoms with PO4 tetrahedral. Consequently, the occupation of Fe in the M1 sites (
 antisite defects) would be suppressed by sulfur doping at O-site. The suppression of
  antisite defects by S-doping would also contribute to improvement in the capacity and the rate capability compared to non-doped LiFePO4. It should be also mentioned that the discharge capacity of 112.7 mA h g−1 at 10C achieved in LFP-S-0.22 is much higher than that of sulfur-doped LiFePO4 only on the surface (86.4 mA h g−1 at 10C) reported in the literature.31 Thus, it can be concluded that anion doping into the LiFePO4 matrix is more important than anion doping only on the surface of LiFePO4 particle in order to enhance the electrochemical performance. The synthesis of cation-doped LiFePO4 has been reported by similar solvothermal approaches.67,68 Thus, our system would be simply applied to the cation-doping approach. The further enhancement of electrochemical performance is expected by multi-elements co-doped LiFePO4 with certain elements.
 | ||
| Fig. 5 (a) Charge–discharge voltage curves of LFP and LFP-S-0.22 at 5C. (b) Rate performance of LFP and LFP-S-0.22. | ||
 | ||
| Fig. 6 FTIR spectra of LFP and LFP-S-0.22. | ||
Conclusions
In this work, we successfully prepared the S-doped LiFePO4 nanoparticles with ∼100 nm in diameter by a solvothermal method using thioacetamide as a sulfur source. The LiFePO4 lattice is expanded with increasing the sulfur amount, but the excess amount of sulfur results in the formation of FeS2 as an impurity. The lattice parameters of a and b increase by around 0.2% with the sulfur content, while that of c remains almost unchanged as only 0.03% increase. The sulfur doping at O-site also results in the suppression of antisite defects in lithium ions diffusion channels. Both the lattice expansion and the suppression of
  antisite defects by S-doping contribute to the enhancement of electrochemical properties due to the easy migration of Li in the diffusion channels without blockage.
Conflicts of interest
There are no conflicts to declare.Acknowledgements
K. O. is practically supported financially by a research grant from Toyota Rikagaku Kenkyuujo.Notes and references
- M. Armand and J.-M. Tarascon, Nature, 2008, 451, 652 CrossRef CAS PubMed.
- B. Dunn, H. Kamath and J.-M. Tarascon, Science, 2011, 334, 928 CrossRef CAS PubMed.
- A. Eftekhari, ACS Sustainable Chem. Eng., 2017, 5, 2799 CrossRef CAS.
- M. S. Islam and C. A. J. Fisher, Chem. Soc. Rev., 2014, 43, 185 RSC.
- V. Etacheri, R. Marom, R. Elazari, G. Salitra and D. Aurbach, Energy Environ. Sci., 2011, 4, 3243 CAS.
- A. K. Padhi, K. S. Nanjundaswamy and J. B. Goodenough, J. Electrochem. Soc., 1997, 144, 1188 CrossRef CAS.
- A. Yamada, S. C. Chung and K. Hinokuma, J. Electrochem. Soc., 2001, 148, 224 CrossRef.
- M. Dubarry and B. Y. Liaw, J. Power Sources, 2009, 194, 541 CrossRef CAS.
- K. Striebel, J. Shim, A. Sierra, H. Yang, X. Song, R. Kostecki and K. McCarthy, J. Power Sources, 2005, 146, 33 CrossRef CAS.
- J.-M. Tarascon and M. Armand, Nature, 2001, 414, 359 CrossRef CAS PubMed.
- B. Kang and G. Ceder, Nature, 2009, 458, 190 CrossRef CAS PubMed.
- A. V. Churikov, A. V. Ivanishchev, I. A. Ivanishcheva, V. O. Sycheva, N. R. Khasanova and E. V. Antipov, Electrochim. Acta, 2010, 55, 2939 CrossRef CAS.
- P. P. Prosini, M. Lisi and M. Pasquali, Solid State Ionics, 2002, 148, 45 CrossRef CAS.
- J. Wang and X. Sun, Energy Environ. Sci., 2012, 5, 5163 CAS.
- Y.-H. Huang, K.-S. Park and J. B. Goodenough, J. Electrochem. Soc., 2006, 2282 CrossRef.
- B. Ellis, W. H. Kan, W. R. M. Makahnouk and L. F. Nazar, J. Mater. Chem., 2007, 17, 3248 RSC.
- J. Chen and M. S. Whittingham, Electrochem. Commun., 2006, 8, 855 CrossRef CAS.
- Z. Xu, L. Gao, Y. Liu and L. Li, J. Electrochem. Soc., 2016, 163, 2600 CrossRef.
- M. Wagemaler, B. Ellis, D. Lutzenkirchen-Hecht, F. M. Mulder and L. F. Nazar, Chem. Mater., 2008, 20, 6313 CrossRef.
- S. Y. Chung, J. T. Bloking and Y. M. Chiang, Nat. Mater., 2002, 1, 123 CrossRef CAS PubMed.
- A. Ornek, E. Bulut, M. Can and M. Ozacar, J. Solid State Electrochem., 2013, 17, 3101 CrossRef CAS.
- Q. Liu, Z. Liu, G. Xiao and S. Liao, Ionics, 2013, 19, 445 CrossRef CAS.
- A. Y. Shenouda and H. K. Liu, J. Alloys Compd., 2009, 477, 498 CrossRef CAS.
- N. Yesibolati, N. Umirov, A. Koishybay, M. Omarova, I. Kurmanbayeva, Y. Zhang, Y. Zhao and Z. Bakenov, Electrochim. Acta, 2015, 152, 505 CrossRef CAS.
- Z. Lin, X. Huang and D. Wang, Solid State Commun., 2008, 147, 505 CrossRef.
- J. Xu and G. Chen, Phys. B, 2010, 405, 803 CrossRef CAS.
- F. Pan and W. L. Wang, J. Solid State Electrochem., 2011, 16, 1423 CrossRef.
- F. Lu, Y. Zhou, J. Liu and Y. Pan, Electrochim. Acta, 2011, 56, 8833 CrossRef CAS.
- C. S. Sun, Y. Zhang, X. J. Zhang and Z. Zhou, J. Power Sources, 2010, 195, 3680 CrossRef CAS.
- Y. R. Luo, Comprehensive Handbook of Chemical Bond Energies, CRC Press, Boca Raton, FL, 2007 Search PubMed.
- K.-S. Park, P. Xiao, S.-Y. Kim, A. Dylla, Y.-M. Choi, G. Henkelman, K. J. Stevenson and J. B. Goodenough, Chem. Mater., 2012, 24, 3212 CrossRef CAS.
- A. Zaleska, P. Gorska, J. W. Sobczak and J. Hupka, Appl. Catal., B, 2007, 76, 1 CrossRef CAS.
- V. Houskova, V. Stengl, S. Bakardjieva, N. Murafa, A. Kalendova and F. Oplustil, J. Phys. Chem. A, 2007, 111, 4215 CrossRef CAS PubMed.
- L. J. Zhang, X. C. Shen, H. Liang, S. Guo and Z. H. Liang, J. Colloid Interface Sci., 2010, 342, 236 CrossRef CAS PubMed.
- J. D. Desai and C. D. Lokhande, Mater. Chem. Phys., 1995, 41, 98 CrossRef CAS.
- C. Nan, J. Lu, C. Chen, Q. Peng and Y. Li, J. Mater. Chem., 2011, 21, 9994 RSC.
- F. Izumi and Y. Kawamura, Solid State Phenom., 2007, 130, 15 CrossRef CAS.
- J. W. Zheng, A. Bhattcahrayya, P. Wu, Z. Chen, J. Highfield, Z. Dong and R. Xu, J. Phys. Chem. C, 2010, 114, 7063 CAS.
- A. V. Radhamani, C. Karthik, R. Ubic, M. S. Ramachandra Rao and C. Sudakar, Scr. Mater., 2013, 69, 96 CrossRef CAS.
- Q. Liu, Z. Liu, G. Xiao and S. Liao, Ionics, 2013, 19, 445 CrossRef CAS.
- A. Ornek, E. Bulut, M. Can and M. Ozacar, J. Solid State Electrochem., 2013, 17, 3101 CrossRef CAS.
- Y. Mi, C. Yang, Z. Zuo, L. Qi, C. Tang, W. Zhang and H. Zhou, Electrochim. Acta, 2015, 176, 642 CrossRef CAS.
- F. Mao, D. Wu, Z. Zhou and S. Wang, Ionics, 2014, 20, 1665 CrossRef CAS.
- H. Gao, L. Jiao, J. Yang, Z. Qi, Y. Wang and H. Yuan, Electrochim. Acta, 2013, 97, 143 CrossRef CAS.
- F. Omenya, N. A. Chernova, S. Upreti, P. Y. Zavalij, K. W. Nam, X. Q. Yang and M. S. Whittingham, Chem. Mater., 2011, 23, 4733 CrossRef CAS.
- S. Nishimura, G. Kobayashi, K. Ohoyama, R. Kanno, M. Yashima and A. Yamada, Nat. Mater., 2008, 7, 707 CrossRef CAS PubMed.
- S. Fujieda, K. Shinoda and S. Suzuki, Solid State Ionics, 2014, 262, 613 CrossRef CAS.
- W. Ho, J. C. Yu and S. Lee, J. Solid State Electrochem., 2006, 179, 1171 CrossRef CAS.
- N. Li, X. Zhang, W. Zhou, Z. Liu, G. Xie, Y. Wang and Y. Du, Inorg. Chem. Front., 2014, 1, 521 RSC.
- J. Chen, X. Zhou, C. Mei, S. Zhou and C.-P. Wong, Electrochim. Acta, 2016, 222, 172 CrossRef CAS.
- H. W. Nesbitt, G. M. Bancroft, A. R. Pratt and M. J. Scaini, Am. Mineral., 1998, 83, 1067 CrossRef CAS.
- U. Gelius, Phys. Scr., 1974, 9, 133 CrossRef CAS.
- B. K. Brow and C. G. Pantano, J. Am. Ceram. Soc., 1986, 69, 314 CrossRef.
- B. K. Brow, J. Non-Cryst. Solids, 1988, 99, 178 CrossRef.
- Y. G. Kim and H. N. G. Wadley, J. Vac. Sci. Technol., A, 2008, 26, 174 CAS.
- X. Huang, X. He, C. Jiang and G. Tian, RSC Adv., 2014, 4, 56074 RSC.
- A. K. Padhi, K. S. Nanjundaswamy, C. Masquelier, S. Okada and J. B. Goodenough, J. Electrochem. Soc., 1997, 144, 1609 CrossRef CAS.
- P. P. Prosini, D. Zane and M. Pasquali, Electrochim. Acta, 2011, 46, 3517 CrossRef.
- X. Zhi, G. Liang, X. Qu, S. Zhang and L. Wang, J. Electrochem. Soc., 2017, 164, A1285 CrossRef CAS.
- S. Torai, M. Nakagomi, S. Yoshitake, S. Yamaguchi and N. Oyama, J. Power Sources, 2016, 306, 62 CrossRef CAS.
- A. V. Radhamani, C. Karthik, R. Ubic, M. S. Ramachandra Rao and C. Sudakar, Scr. Mater., 2013, 69, 96 CrossRef CAS.
- S.-Y. Chung, S.-Y. Choi, T. Yamamoto and Y. Ikuhara, Phys. Rev. Lett., 2008, 100, 125502 CrossRef PubMed.
- S.-Y. Chung, S.-Y. Choi, T. Yamamoto and Y. Ikuhara, Angew. Chem., Int. Ed., 2009, 48, 543 CrossRef CAS PubMed.
- R. Malik, D. Burch, M. Bazant and G. Ceder, Nano Lett., 2010, 10, 4123 CrossRef CAS PubMed.
- X. Qin, J. Wang, J. Xie, F. Li, L. Wen and X. Wang, Phys. Chem. Chem. Phys., 2012, 14, 2669 RSC.
- S. Shi, H. Zhang, X. Ke, C. Ouyang, M. Lei and L. Chen, Phys. Lett. A, 2009, 373, 4096 CrossRef CAS.
- F. Ye, L. Wang, X. He, M. Fang, Z. Dai, J. Wang, C. Huang, F. Lian, J. Wang, G. Tian and M. Ouyang, J. Power Sources, 2014, 253, 143 CrossRef CAS.
- Y. Zhong, Z. Wu, J. Li, W. Xiang, X. Guo, B. Zhong and S. Sun, ChemElectroChem, 2015, 2, 896 CrossRef CAS.
Footnote |
| † Electronic supplementary information (ESI) available. See DOI: 10.1039/c7ra12740e |
| This journal is © The Royal Society of Chemistry 2018 |