DOI:
10.1039/C7RA12700F
(Paper)
RSC Adv., 2018,
8, 3782-3788
The first colorimetric receptor for the B4O72− anion based on nitro substituted phenanthroimidazole ferrocene derivatives†
Received
23rd November 2017
, Accepted 12th January 2018
First published on 19th January 2018
Abstract
Four phenanthroimidazole ferrocene derivatives (2a–2d) were designed, synthesized and characterized by 1H NMR, 13C NMR and high-resolution mass spectroscopy (HRMS). Recognition of 12 anions by 2a–2d was investigated by UV-Vis absorption analysis, showing that 2b and 2d sensed B4O72− selectively among the tested anions with an obvious color change observed. 1H NMR titrations and theoretical calculations demonstrated that 2b binds B4O72− through O⋯H hydrogen bonding and O⋯B interactions between the nitro moiety and the B4O72− anion.
1. Introduction
Sodium borate (Na2B4O7·10H2O) is an important boron-containing mineral and is used widely in the fields of glassmaking, metallurgy, detergents, cosmetics, pesticides and medicines. The borate anion, or tetraborate anion, is a bicyclic structure that is composed of two BO4 and two BO3 moieties. A receptor for sensing the borate anion is urgently needed because about five hundred thousand tons of sodium borate is produced in China every year. The massive industrial production leads to the production of a large amount of waste water containing borate anions, and no receptor to detect this anion exists.
Imidazole is a five-membered heterocyclic aryl system that coordinates easily with metal ions to form imidazole complexes. Different structural ferrocenyl imidazole derivatives can coordinate with cations, such as Ag(I), Cu(I),1 Pd(II), Pt(II),2 Mo(II),3 Mn(II), Co(II),4 Pb(II)5 and Hg(II),6 to form complexes, and can be used in the recognition of cations. Imidazole can also interact with anions by hydrogen bonding, electrostatic forces and other non-covalent interactions to function as a complexing unit of an anion sensor. Ferrocene is a good sensing unit because of its excellent electrochemical properties. In 2002, Tomas and coworkers reported a simple ferrocenyl imidazolium, in which ferrocene bonded to the nitrogen of imidazole by a methylene group could interact with Cl−, Br−, NO3− and HSO4− anions,7 but with broad selectivity. In recent years, a series of acyclic and trinuclear ferrocene-based imidazolium receptors noticeably improved selectivity toward the F− anion.8–10 Structural characterization of other ferrocenyl imidazole derivatives showed that specific recognition properties involve the ferrocene being linked directly with the C2 of imidazole, with the C4 and C5 fused to a conjugative system. One of the receptors discovered was 2-ferrocenyl-1H-anthra[1,2-d]imidazole-6,11(5aH,11aH)-dione, which was capable of detecting [CN−]aq as low as ∼0.1 ppm.11 The ferrocene–imidazopyrene dyad is a simple but effective dual redox and fluorescent ion pair receptor that can detect Hg2+ and H2PO4− ions simultaneously.12 Another ion pair sensor is the bisferrocene–benzobisimidazole triad, which acts as a multichannel receptor for selective sensing of Hg2+ and HSO4− ions.13
We are interested in studying the synthesis of ferrocenyl imidazole sensors14 and the application of these sensors as cation and anion receptors.15,16 Ferrocene moiety in these receptors raised the selectivity. It was due to the electronic properties and rigid structure of ferrocene. 2-Ferrocenyl-1H-phenanthro-[9,10-d]imidazole (2a) is an electrochemical switching device.17 When studying the UV-Vis spectral response of 2a to different ions, we found that the absorbance at 400 nm in the presence of borate and hydroxyl anions showed significant increases, but no color change to the solution was observed. In this report, a strategy was designed to introduce a nitro group to ferrocenyl imidazophenanthrene and link an acetyl group to the cyclopentadienyl (Cp) to yield novel receptors (2b–2d) that display better sensing responses to the borate anion.
2. Results and discussion
2.1 Synthesis of receptors
Methods for the syntheses of the receptors (2a–2d) are shown in Scheme 1. 2-Nitrophenanthraquinone (d) was prepared by the nitration of phenanthraquinone (c).18 In the presence of NH4OAc, formylferrocene and 1′-acetyl-1-formylferrocene reacted with c and d, respectively, and underwent Radziszewski synthesis to yield the products (2a–2d).
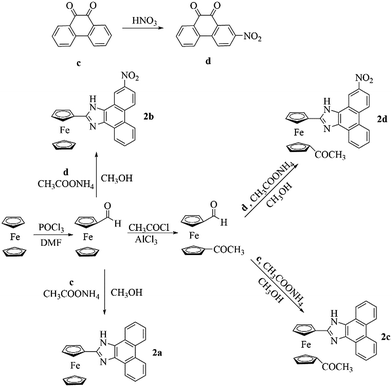 |
| | Scheme 1 Synthesis of 2a–2d. | |
2.2 X-ray diffraction single crystal structure of 2a
The X-ray diffraction single crystal structure of 2a is shown in Fig. 1. The Fe–C bond length ranges between 2.043 and 2.059 Å. The dihedral angle of the two Cps is 0.217°, and the dihedral angle between Cp and phenanthroimidazole is 5.055°. The structure shows that Cp and phenanthroimidazole are almost parallel and form a larger conjugative system.
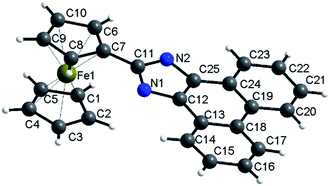 |
| | Fig. 1 Molecular structure of 2a. CCDC: 1509214.† | |
The rigid structure of ferrocene and phenanthroimidazole provides a specific space configuration to facilitate selectivity toward anions.
2.3 UV-Vis spectrum
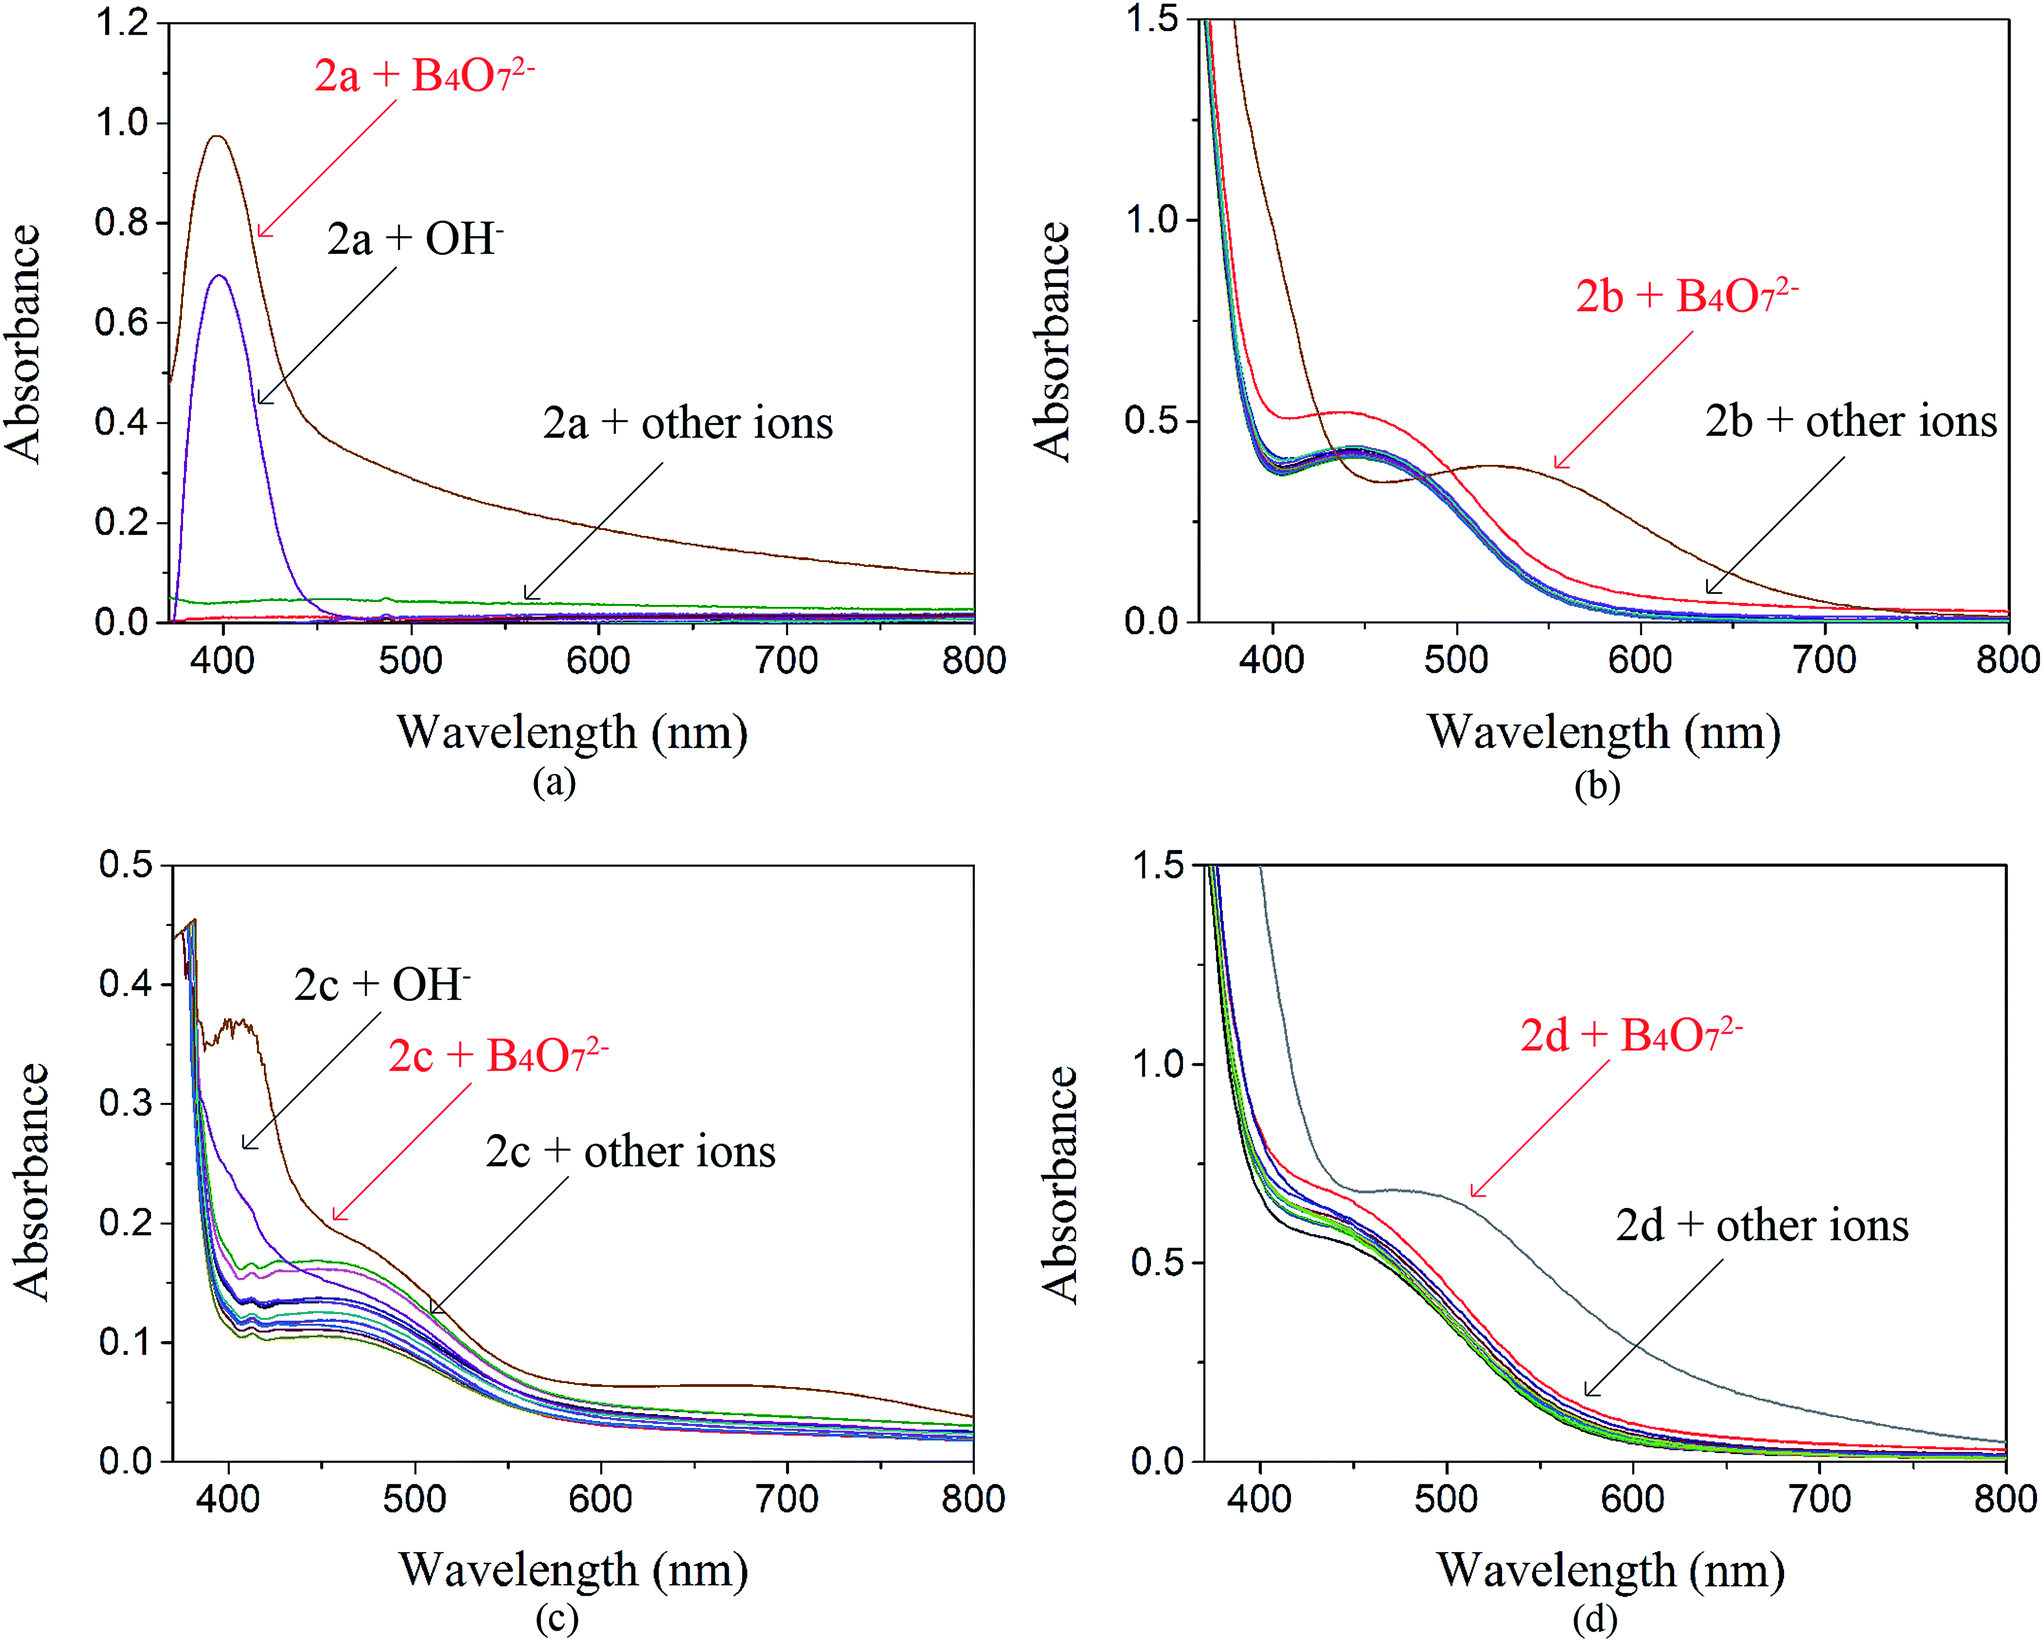
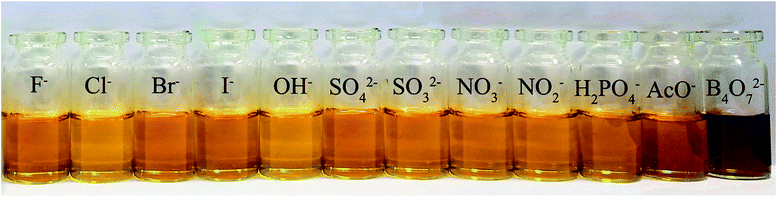
The anion recognition properties of the receptors 2a–2d toward F−, Cl−, Br−, I−, OH−, SO42−, SO32−, NO3−, NO2−, H2PO4−, AcO− and B4O72− were evaluated by UV-Vis spectroscopy. The solvent used in ion recognition manipulation was a mixture of DMSO and water (VDMSO![[thin space (1/6-em)]](https://www.rsc.org/images/entities/char_2009.gif) :VH2O = 4:1). The solutions of 2a–2d were prepared in DMSO (c = 1.0 × 10⁻³ mol L−1). All the tested anions were dissolved in water (c = 1.0 × 10⁻² mol L−1). The receptor 2a was studied by UV-Vis spectroscopy. The absorbance at 400 nm increased dramatically when B4O72− and OH− were added to 2a (Fig. 2(a)), but both anions showed the same yellow color. The receptor 2c possesses one acetyl group more than 2a. When the interaction of 2c with 12 anions was investigated, we observed that the maximum absorbance in the UV-Vis spectrum of 2c in the presence of B4O72− was at 400 nm, whereas the absorbance maximum of the peak for 2c in the presence of OH− had blue shifted (Fig. 2(c)). No color change was observed. Addition of B4O72− to 2b, which has one more nitro group than 2a, caused an immediate change in the color of the solution from light yellow to violet (Fig. 3). The change in the spectrum was caused by a bathochromic shift in the absorption maxima from 436 to 516 nm (Fig. 2(b)) and a change in the molar extinction coefficient from 4265 to 3890 L (mol cm−1)−1, when 10 equivalents in concentration of B4O72− was added. As shown in Fig. 5, 2b shows higher selectivity toward B4O72− over other anions. The receptor 2d possesses one more acetyl group and one more nitro group than 2a. Addition of B4O72− to a solution of 2d caused an immediate color change from yellow to brown (Fig. 4). Correspondingly, the absorption maxima shifted from 436 to 496 nm (Fig. 2(d)) and the molar extinction coefficient from 5628 to 6694 L (mol cm−1)−1, when 10 equiv. of B4O72− was added.
:VH2O = 4:1). The solutions of 2a–2d were prepared in DMSO (c = 1.0 × 10⁻³ mol L−1). All the tested anions were dissolved in water (c = 1.0 × 10⁻² mol L−1). The receptor 2a was studied by UV-Vis spectroscopy. The absorbance at 400 nm increased dramatically when B4O72− and OH− were added to 2a (Fig. 2(a)), but both anions showed the same yellow color. The receptor 2c possesses one acetyl group more than 2a. When the interaction of 2c with 12 anions was investigated, we observed that the maximum absorbance in the UV-Vis spectrum of 2c in the presence of B4O72− was at 400 nm, whereas the absorbance maximum of the peak for 2c in the presence of OH− had blue shifted (Fig. 2(c)). No color change was observed. Addition of B4O72− to 2b, which has one more nitro group than 2a, caused an immediate change in the color of the solution from light yellow to violet (Fig. 3). The change in the spectrum was caused by a bathochromic shift in the absorption maxima from 436 to 516 nm (Fig. 2(b)) and a change in the molar extinction coefficient from 4265 to 3890 L (mol cm−1)−1, when 10 equivalents in concentration of B4O72− was added. As shown in Fig. 5, 2b shows higher selectivity toward B4O72− over other anions. The receptor 2d possesses one more acetyl group and one more nitro group than 2a. Addition of B4O72− to a solution of 2d caused an immediate color change from yellow to brown (Fig. 4). Correspondingly, the absorption maxima shifted from 436 to 496 nm (Fig. 2(d)) and the molar extinction coefficient from 5628 to 6694 L (mol cm−1)−1, when 10 equiv. of B4O72− was added.
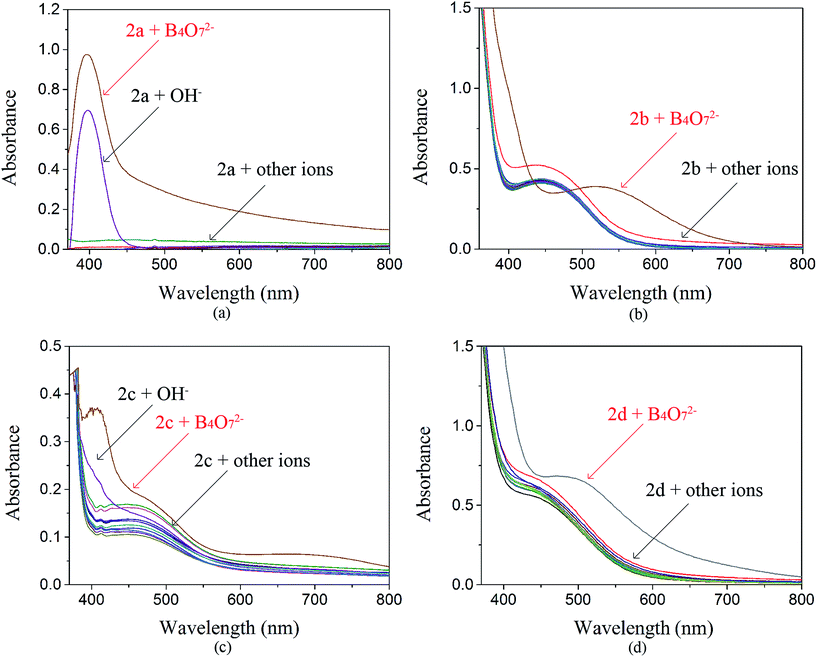 |
| | Fig. 2 Influence of various anions on the UV-Vis spectra of 2a–2d. | |
 |
| | Fig. 3 Influence of various anions on colorimetric properties of 2b. | |
 |
| | Fig. 4 Influence of various anions on the colorimetric properties of 2d. | |
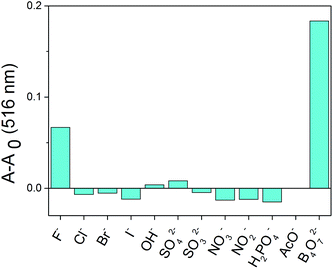 |
| | Fig. 5 Relative absorbance at 516 nm of different anions in the presence of 2b. | |
For the tested anions, receptors 2b and 2d possessed sensing properties only toward B4O72−. Thus, introduction of a nitro group to phenanthroimidazole resulted in a prominent color change, whereas the acetyl group showed no effect.
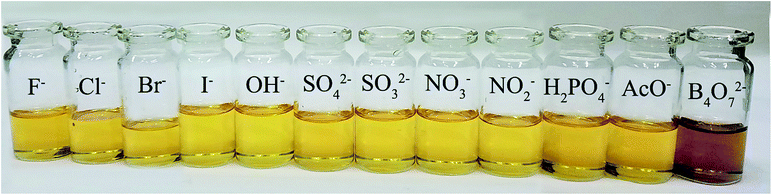
2.4 Competition with other anions
A competition experiment was performed to test the specificity of 2b toward B4O72−. No significant interference was observed in the presence of competing anions and the absorbance enhancement induced by B4O72− was retained (Fig. 6). Interestingly, all the anions were unable to decrease the absorbance of the 2b–B4O72− complex. Therefore, none of the anions test could alter the affinity of 2b towards B4O72−.
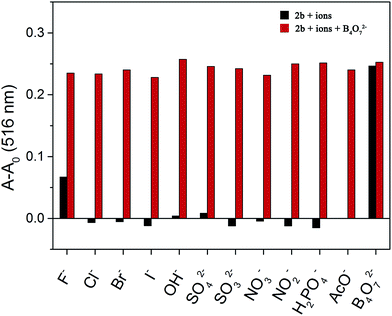 |
| | Fig. 6 Competitive selection of B4O72− by 2b in the presence of other anions (10 equiv. in DMSO/H2O (4:1)). | |
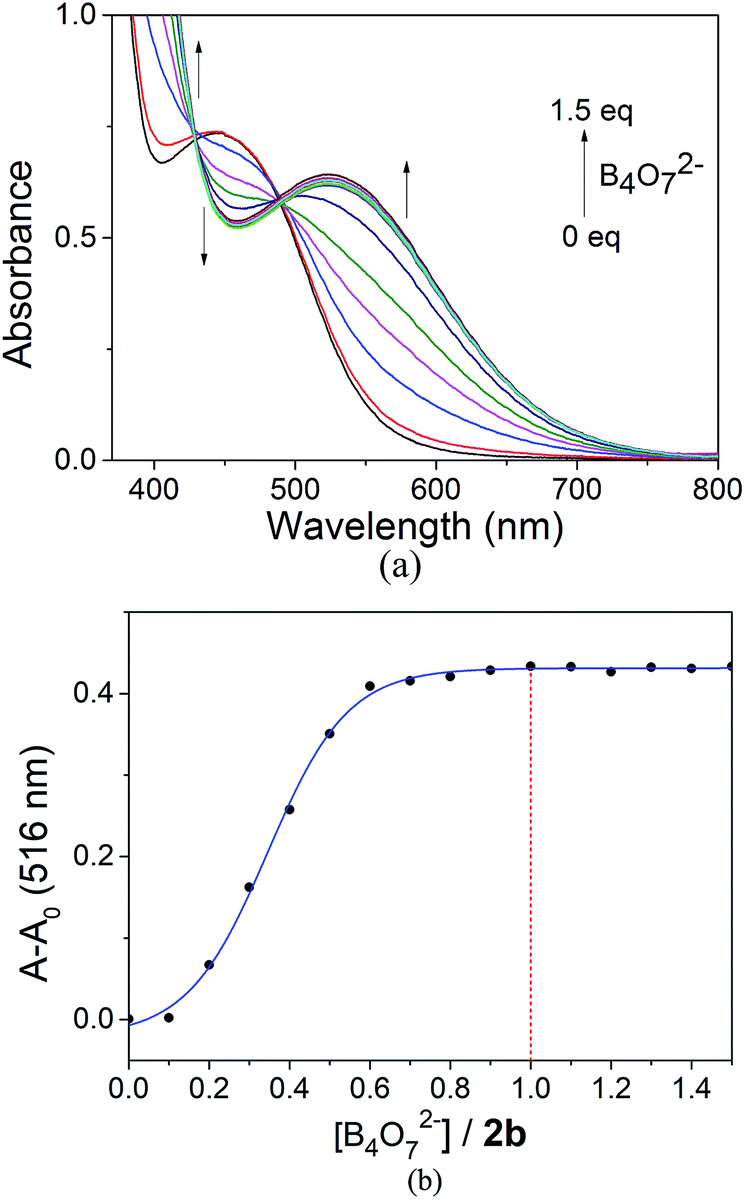
2.5 UV-Vis spectral response of 2b toward a concentration gradient of B4O72−
The 2b to B4O72− anion complex ratio was determined. At 20 °C, titrations were carried out in a DMSO/H2O (4:1) solution and the absorbance was monitored. The experiments were performed by preparing a solution (3 × 10⁻⁴ mol L−1) of 2b in DMSO/H2O (4:1), followed by the addition of aqueous sodium borate (Fig. 7(a)). No obvious change in color was observed when the concentration of B4O72− was below 1:2. At molar ratios of 2b and the B4O72− anion greater than 1:2, a color change to lavender was observed and the λmax showed a slight red shift. The color changed to violet when the concentration of B4O72− reached 1 equiv. to 2b. At higher concentrations of B4O72− no further change in the color was observed and the UV-Vis spectrum did not change either (Fig. 7(b)). This observation showed that the stoichiometry of the receptor 2b to B4O72− anion complex was 1:1.
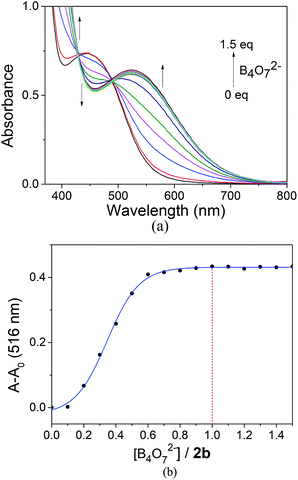 |
| | Fig. 7 (a) Absorbance spectra of 2b with B4O72−. (b) Relative absorbance at 516 nm of 2b in the presence of B4O72− at different B4O72−:2b ratios. | |
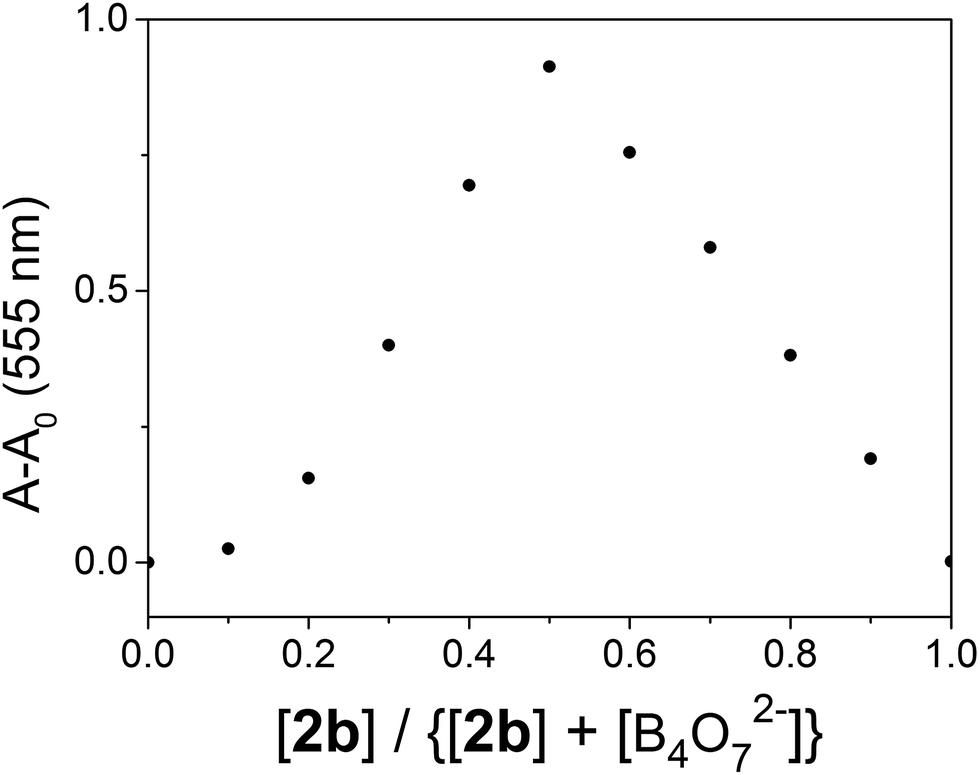
2.6 Measurement of Job's plot, LOD and Ka of 2b toward the B4O72− anion
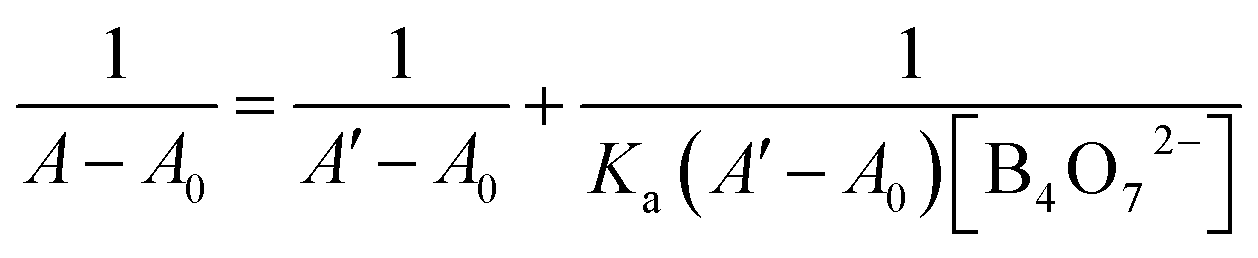
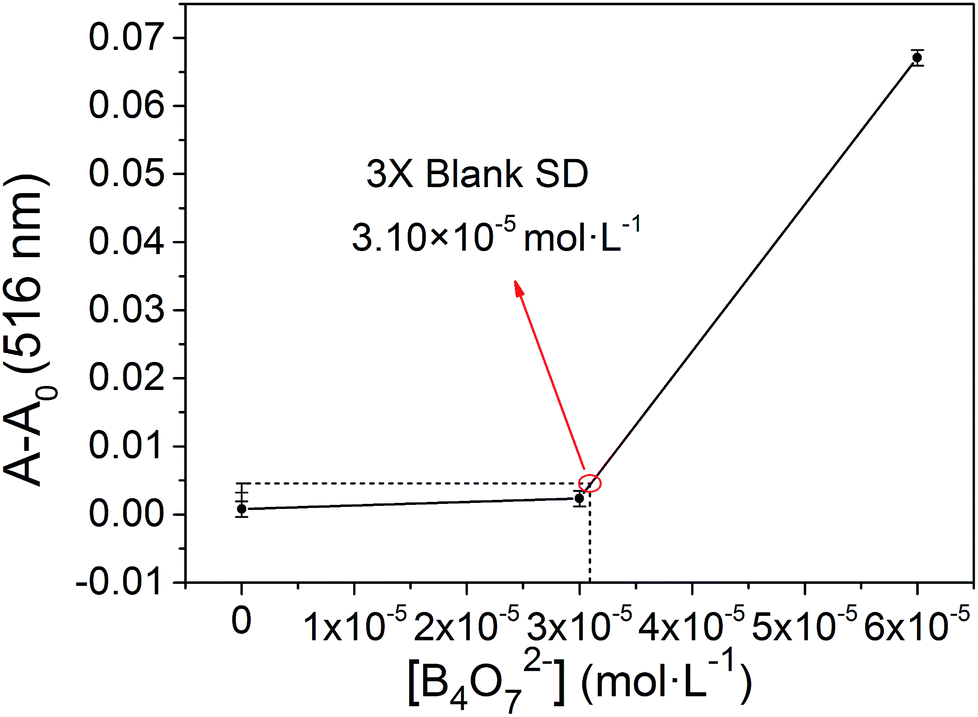
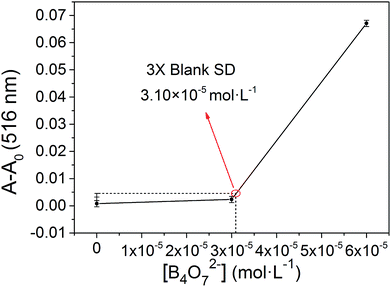
The binding stoichiometry of 2b with B4O72− was examined by the Job's plot method. The presence of a maximum absorbance at a mole fraction of 0.5 shows the formation of 1 molecule of 2b with 1 molecule of B4O72−. The binding mode is presented in Fig. 8, with a limit of detection (LOD) of 3.10 × 10⁻⁵ mol L−1, as estimated by the 3σ rule (Fig. 9). The binding constant of 2b with B4O72− is 5.45 × 10⁴, which was obtained from the absorbance titration data, using the Benesi–Hildebrand equation (Fig. S1†):
where A0 is the absorbance of 2b without B4O72−, A is the absorbance with a particular concentration of B4O72−, A′ is the absorbance of the fully complexed form at the highest concentration of B4O72−, and Ka is the binding constant.
 |
| | Fig. 8 Job's plot of the interaction of 2b with B4O72− in DMSO/H2O (4:1). | |
 |
| | Fig. 9 The absorbance of various B4O72− concentrations measured with respect to the absorbance of the blank. | |
2.7 Mechanism study
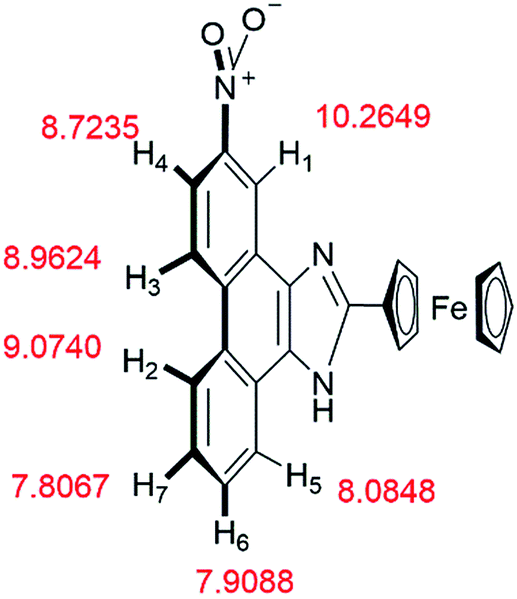
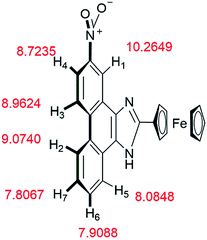
The mechanism of 2b binding to B4O72− was determined by conducting 1H NMR titration experiments and theoretical calculations. The chemical shifts of 2b were calculated based on the optimized geometry. The calculations were performed with the hybrid density functional B3LYP19,20 and the 6-311++G** basis set using Gaussian 0321 (Fig. 10). Hydrogen atoms (H1–H7) on the phenanthrene are labeled with chemical shifts. H1 and H4 stand for the first and the fourth biggest chemical shift values, correspondingly.
 |
| | Fig. 10 Chemical shifts of compound 2b calculated by Gaussian 03. | |
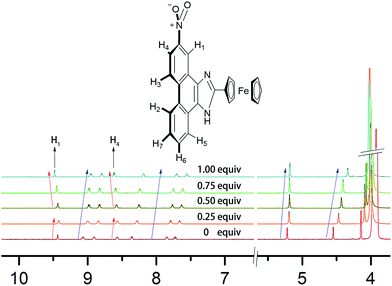
According to the 1H NMR titration experiments (Fig. 11), the chemical shifts of H1–H7 are in the range of 7.4–9.4 ppm. The chemical shifts of most peaks in the NMR spectrum moved upfield as the equiv. of B4O72− increased. Only the peaks of H1 and H4 shifted upfield at equiv. less than 0.25 and then downfield in response to further increases in equiv. of B4O72−.
 |
| | Fig. 11 1H NMR titration spectra of 2b in DMSO-d6 in the presence of various equivalents B4O72− in D2O. | |
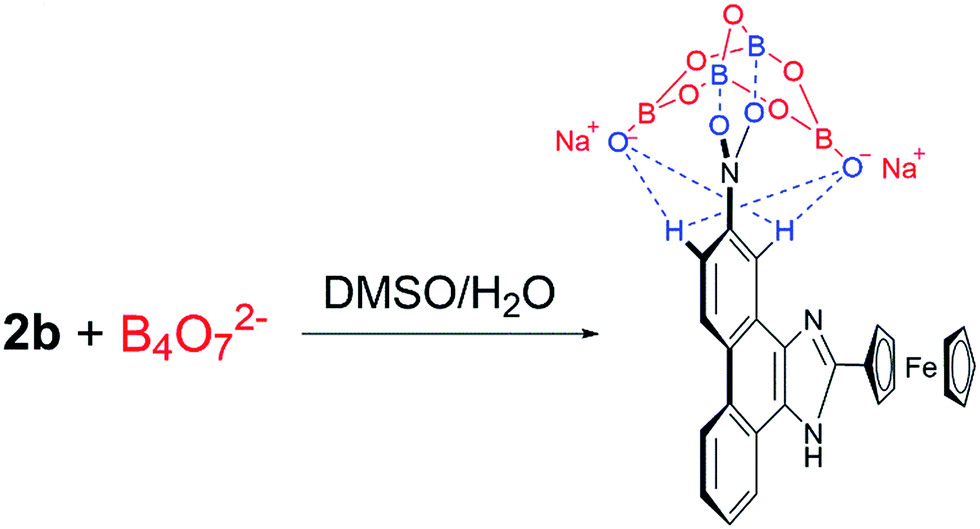
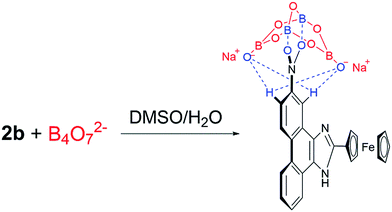
Based on the 1H NMR titration and the calculation results, the following mechanism is proposed (Scheme 2). The static force of borate anion toward 2b and hydrogen bonds between H1/H4 and two oxygen atoms of B4O72− are converse interaction. Two boron atoms of B4O72−, as an electron-deficient element bind readily with two oxygen atoms of the nitro. This event leads to all peaks in the spectra of 2b shifting upfield initially. The peaks of H1 (9.4 ppm) and H4 (8.6 ppm) shift downfield at higher B4O72− equiv. because of the formation of hydrogen bonds between H1/H4 and two oxygen atoms of B4O72−, which support the results of the theoretical calculations.
 |
| | Scheme 2 Proposed mechanism describing how 2b detects borate ions. | |
3. Detection of B4O72− in lake water
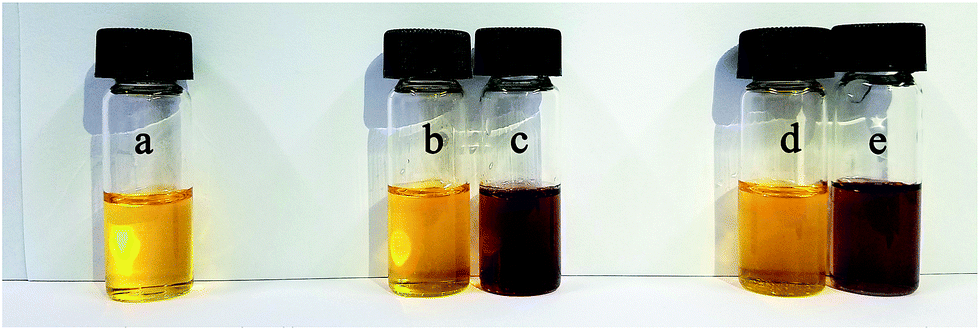
To evaluate whether our colorimetric probe can detect B4O72− anion in actual samples, we found some samples in the lakes of Yuanming Yuan (the Old Summer Palace) in Beijing. The insoluble substances were removed by filtration. Then 2b was added in. We observed that sample 1 and 2 showed the same yellow color (Fig. 12(b) and (d)). UV-Vis spectroscopy was used to study the two samples and it showed that no obvious change was found (Fig. 13). It manifested that concentration of B4O72− anion in sample 1 and 2 was below the limit of detection. When B4O72− anion was added into sample 1 and 2, the color changed from yellow to violet immediately and the change in the spectrum was caused by a bathochromic shift in the absorption maxima from 436 to 516 nm (Fig. 12(c, e) and 13(a, b) the blue curves). It means that the receptor could be used to determine the B4O72− anion in actual samples.
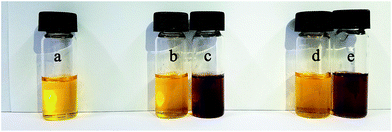 |
| | Fig. 12 Influence of different water samples on colorimetric properties of 2b (a) 2b; (b) 2b and sample1; (c) 2b, sample 1 and B4O72−; (d) 2b and sample 2; (e) 2b, sample 2 and B4O72−. The solvents in bottle a was the mixture of DMSO and deionized water (VDMSO:VH2O = 4:1). The solvents in bottle b–e were the mixture of DMSO and lake water (VDMSO:VH2O = 4:1). | |
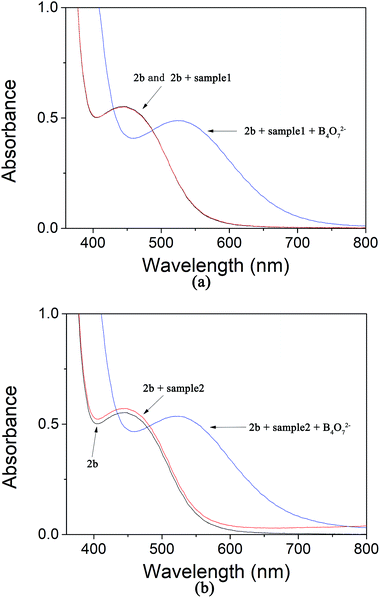 |
| | Fig. 13 (a) The absorption of 2b in the water samples 1; (b) the absorption of 2b in the water samples 2. | |
4. Conclusions
The syntheses of new ferrocenyl phenanthroimidazole derivatives 2a–2d have been achieved using simple and short synthetic routines from ferrocene. The introduction of a nitro group to receptor 2a to afford 2d gave rise to a prominent color change, and 2b and 2d formed 1:1 complexes with the borate anion. Both 2b and 2d showed good selectivity toward the borate anion when testing the 12 anions, and selectivity was visibly detected by a color change of the reaction solution.
5. Experimental section
5.1 Instruments and reagents
All solvents in the experiments were treated with 5 Å molecular sieves. Melting points were determined using a WRS-1B microscopic and a melting point instrument (Shanghai YiCe Apparatus & Equipment Co. Ltd) without correction. NMR spectra were acquired on a Varian Mercury 600. 1H NMR and 13C NMR were calibrated using tetramethylsilane. Infrared spectra were measured on a Bruker Tensor 27 Infrared spectrometer. Mass spectra were obtained using a Bruker APEXIIFT-ICR mass spectrometer. Crystal diffraction analysis was performed using a AFC10/Saturn 724+ X-ray Single Crystal Diffractometer. Compounds 1a and 1b were prepared according to literature.22,23 Compounds 2a and 2d were prepared according to literature.16,18
5.2 Synthesis of target compounds 2b–2d
A general method was used to synthesize 2b–2d, and we provide the method for synthesis of 2b. In a 100 mL three neck flask, 1-formylferrocene (0.32 g, 1.5 mmol), 2-nitrophenanthraquinone (0.38 g, 1.5 mmol), ammonia acetate (0.58 g, 7.5 mmol) and 20 mL anhydrous methanol were mixed. The temperature was held at ∼65 °C and the solution left overnight. The mixture was cooled to room temperature and poured into a 30 mL mixture of ice and water. A brown-red solid was precipitated when the pH value was adjusted to 8. After filtration and washing with dichloromethane, the brown-red product 2b was obtained.
2-Ferrocenyl-1H-2-nitrophenanthro[9,10-d]imidazole (2b). 580 mg brown-red solid, yield: 86.8%. Mp >270 °C; 1H NMR (DMSO-d6, 600 MHz): δ 13.24 (d, J = 85.5 Hz, 1H), 9.38 (dd, J = 135.2, 2.4 Hz, 1H), 9.09 (dd, J = 13.5, 9.2 Hz, 1H), 8.93 (dd, J = 23.7, 8.3 Hz, 1H), 8.57 (dd, J = 16.5, 7.9 Hz, 1H), 8.32 (ddd, J = 8.7, 4.8, 2.5 Hz, 1H), 7.85 (dt, J = 31.0, 7.4 Hz, 1H), 7.75–7.66 (m, 1H), 5.20 (d, J = 29.6 Hz, 2H), 4.58–4.51 (m, 2H), 4.17 (d, J = 2.3 Hz, 5H); 13C NMR (DMSO-d6, 151 MHz): δ 151.8, 145.7, 145.6, 138.2, 136.6, 131.4, 131.2, 129.0, 128.4, 128.0, 126.9, 126.4, 126.2, 126.0, 125.8, 125.7, 125.6, 125.4, 125.0, 123.5, 122.3, 122.2, 121.9, 118.0, 117.7, 117.3, 109.7, 74.4, 69.8, 69.5, 67.3, 67.2; HRMS (Thermo Q Exactive) calcd for C25H17FeN3O2 448.0743, found 448.0730.
2-(1′-Acetyl)ferroenyl-1H-phenanthro[9,10-d]imidazole (2c). 378 mg, brown solid, yield: 56.5%. Mp >236 °C; 1H NMR (DMSO-d6, 600 MHz): δ 13.02 (s, 1H), 8.87 (d, J = 8.3 Hz, 1H), 8.83 (d, J = 8.3 Hz, 1H), 8.54 (d, J = 7.9 Hz, 1H), 8.46 (d, J = 7.9 Hz, 1H), 7.78–7.73 (m, 1H), 7.73–7.68 (m, 1H), 7.66–7.59 (m, 2H), 5.25 (s, 1H), 4.75 (s, 1H), 4.56 (s, 1H), 4.52 (s, 1H), 2.11 (s, 3H); 13C NMR (DMSO-d6, 151 MHz): δ 201.2, 149.0, 137.3, 127.8, 127.6, 127.5, 127.4, 127.3, 125.4, 125.3, 124.5, 124.1, 122.7, 122.4, 122.3, 80.8, 77.5, 73.8, 73.7, 71.4, 71.0, 68.6, 27.7; HRMS (Thermo Q Exactive) calcd for C27H20FeN2O 445.0998, found 445.0997.
2-(1′-Acetyl)ferrocenyl-1H-(2-itrophenanthro)[9,10-d]imidazole (2d). 490 mg, brown red solid, yield: 66.7%. Mp >194 °C; 1H NMR (DMSO-d6, 600 MHz): δ 13.29 (d, J = 84.7 Hz, 1H), 9.37 (d, J = 120.7 Hz, 1H), 9.11 (s, 1H), 8.94 (d, J = 24.3 Hz, 1H), 8.56 (d, J = 23.9 Hz, 1H), 8.34 (s, 1H), 7.86 (d, J = 31.7 Hz, 1H), 7.72 (s, 1H), 5.26 (d, J = 32.7 Hz, 2H), 4.78 (s, 2H), 4.57 (d, J = 34.2 Hz, 4H), 2.10 (d, J = 4.5 Hz, 3H); 13C NMR (DMSO-d6, 151 MHz): δ 200.8, 150.0, 149.9, 145.7, 145.6, 138.3, 136.5, 131.5, 131.4, 129.1, 128.5, 128.1, 127.1, 126.4, 126.4, 126.3, 126.0, 125.8, 125.7, 125.4, 125.0, 123.5, 122.2, 121.9, 118.2, 117.7, 117.2, 80.5, 76.4, 73.4, 71.3, 70.7, 68.4, 68.4, 27.3; HRMS (Thermo Q Exactive) calcd for C27H19FeN3O3 490.0849, found 490.0845.
Conflicts of interest
There are no conflicts to declare.
Acknowledgements
We gratefully acknowledge the financial support by the Beijing Natural Science Foundation (No. 2173060) and the General Plan of Beijing Municipal Education Commission (No. KM201710028007).
Notes and references
- S. Quintal, M. C. Gimeno, A. Laguna and M. J. Calhorda, J. Organomet. Chem., 2010, 695, 558 CrossRef CAS.
- V. O. Nyamori, D. Onyancha, C. W. McCleland, C. Imrie and T. I. A. Gerber, J. Organomet. Chem., 2009, 694, 1407 CrossRef CAS.
- S. Quintal, J. Matos, I. Fonseca, V. Félix, M. G. B. Drew, N. Trindade, M. Meireles and M. J. Calhorda, Inorg. Chim. Acta, 2008, 361, 1584 CrossRef CAS.
- S. S. Yan, L. Q. Jing and Q. Shuai, Polyhedron, 2017, 126, 252 CrossRef CAS.
- F. Zapata, A. Caballero, A. Espinosa, A. Tárraga and P. Molina, J. Org. Chem., 2009, 74, 4787 CrossRef CAS PubMed.
- R. Pandey, R. K. Gupta, M. Shahid, B. Maiti, A. Misra and D. S. Pandey, Inorg. Chem., 2012, 51, 298 CrossRef CAS PubMed.
- J.-L. Thomas, J. Howarth and A. M. Kennedy, Molecules, 2002, 7, 861 CrossRef CAS.
- J. B. Zhuo, X. Q. Yan, X. X. Wang, L. L. Xie and Y. F. Yuan, Chin. J. Org. Chem., 2015, 35, 1090 CrossRef CAS.
- J. B. Zhuo, Q. Wan, X. Q. Yan, L. L. Xie and Y. F. Yuan, Chem. J. Chin. Univ., 2015, 36, 477 CAS.
- L. L. Ma, T. H. Leng, K. Wang, C. Y. Wang, Y. J. Shen and W. H. Zhu, Tetrahedron, 2017, 73, 1306 CrossRef CAS.
- S. Saha, A. Ghosh, P. Mahato, S. Mishra, S. K. Mishra, E. Suresh, S. Das and A. Das, Org. Lett., 2010, 12, 3406 CrossRef CAS PubMed.
- M. Alfonso, A. Espinosa, A. Tárraga and P. Molina, Org. Lett., 2011, 13, 2078 CrossRef CAS PubMed.
- M. Alfonso, A. Tárraga and P. Molina, Org. Lett., 2011, 13, 6432 CrossRef CAS PubMed.
- J. C. Wang, Z. M. Chen, L. Qiao, Y. X. Li, X. L. Jiao and Y. R. Jin, Chin. J. Synth. Chem., 2012, 20, 324 CAS.
- X. F. Wu, P. Wu, J. Y. Li, J. Lu and J. C. Wang, Chin. J. Org. Chem., 2017, 37, 1412 CrossRef CAS.
- J. C. Wang, X. F. Wu, X. L. Jiao and M. Wang, Chin. J. Synth. Chem., 2014, 22, 174 Search PubMed.
- N. Xie, K. Feng, B. Chen, L. Zhang, Z. H. Tong and L. Z. Wu, Imaging Sci. Photochem., 2011, 29, 45 CAS.
- A. Jaffe, A. S. Valdes and H. I. Karunadasa, Chem. Mater., 2015, 27, 3568 CrossRef CAS.
- A. D. Becke, J. Chem. Phys., 1993, 98, 5648 CrossRef CAS.
- C. Lee, W. Yang and R. G. Parr, Phys. Rev. B: Condens. Matter Mater. Phys., 1988, 37, 785 CrossRef CAS.
- M. J. Frisch, G. W. Trucks, H. B. Schlegel, G. E. Scuseria, M. A. Rob, J. R. Cheeseman, J. A. Montgomery Jr, T. Vreven, K. N. Kudin, J. C. Burant, J. M. Millam, S. S. Iyengar, J. Tomasi, V. Barone, B. Mennucci, M. Cossi, G. Scalmani, N. Rega, G. A. Petersson, H. Nakatsuji, M. Hada, M. Ehara, K. Toyota, R. Fukuda, J. Hasegawa, M. Ishida, T. Nakajima, Y. Honda, O. Kitao, H. Nakai, M. Klene, X. Li, J. E. Knox, H. P. Hratchian, J. B. Cross, V. Bakken, C. Adamo, J. Jaramillo, R. Gomperts, R. E. Stratmann, O. Yazyev, A. J. Austin, R. Cammi, C. Pomelli, J. W. Ochterski, P. Y. Ayala, K. Morokuma, G. A. Voth, P. Salvador, J. J. Dannenberg, V. G. Zakrzewski, S. Dapprich, A. D. Daniels, M. C. Strain, O. Farkas, D. K. Malick, A. D. Rabuck, K. Raghavachari, J. B. Foresman, J. V. Ortiz, Q. Cui, A. G. Baboul, S. Clifford, J. Cioslowski, B. B. Stefanov, G. Liu, A. Liashenko, P. Piskorz, I. Komaromi, R. L. Martin, D. J. Fox, T. Keith, M. A. Al-Laham, C. Y. Peng, A. Nanayakkara, M. Challacombe, P. M. W. Gill, B. Johnson, W. Chen, M. W. Wong, C. Gonzalez and J. A. Pople, Gaussian 03, Gaussian Inc., Wallingford, CT, 2003 Search PubMed.
- J. C. P. Mayer, A. C. Sauer, B. A. Iglesias, T. V. Acunha, D. F. Back, O. E. D. Rodrigues and L. Dornelles, J. Organomet. Chem., 2017, 841, 1 CrossRef CAS.
- A. Vecchi, N. R. Erickson, J. R. Sabin, B. Floris, V. Conte, M. Venanzi, P. Galloni and V. N. Nemykin, Chemistry, 2015, 21, 269 CrossRef CAS PubMed.
Footnote |
| † Electronic supplementary information (ESI) available. CCDC 1509214. For ESI and crystallographic data in CIF or other electronic format see DOI: 10.1039/c7ra12700f |
|
| This journal is © The Royal Society of Chemistry 2018 |
Click here to see how this site uses Cookies. View our privacy policy here. 
 Open Access Article
 This Open Access Article is licensed under a
  ,
Guo Wang,
Lu Zhou,
Jing Lu and
Jianchun Wang
,
Guo Wang,
Lu Zhou,
Jing Lu and
Jianchun Wang