 Open Access Article
Creative Commons Attribution 3.0 Unported Licence
Electrochemical oxidation of As(III) on Pd immobilized Pt surface: kinetics and sensing performance†
Md. Mahbubul Alama,
Md. A. Rashedb,
Md. Musfiqur Rahmana,
Mohammed M. Rahman d,
Yuki Nagao
 c and
Mohammad A. Hasnat
 *a
*a
aDepartment of Chemistry, Shahjalal University of Science and Technology, Sylhet–3114, Bangladesh. E-mail: mah-che@sust.edu; mahtazim@hotmail.com; Fax: +88-0821-715752 ext. 694; Tel: +88-0821-715752 ext. 694
bDepartment of Chemistry, Mawlana Bhashani Science and Technology University, Santosh, Tangail-1902, Bangladesh
cSchool of Materials Science, Japan Advanced Institute of Science and Technology, 1-1 Asahidai, Nomi, Ishikawa 923-1292, Japan
dCentre of Excellence for Advanced Materials Research (CEAMR), Chemistry Department, Faculty of Science, King Abdul Aziz University, P.O. Box 80203, Jeddah 21589, Saudi Arabia
First published on 20th February 2018
Abstract
Pd nanoparticles were electrochemically immobilized on a Pt surface in the presence of sodium dodecyl sulfate (SDS) molecules to study the electrokinetics of arsenite oxidation reactions and the corresponding sensing activities. The X-ray photoelectron spectroscopy (XPS) analysis showed that on the Pt surface, Pd atoms exist as adatoms and the contents of Pd(0) and Pd(II) were 75.72 and 24.28 at%, respectively, and the particle sizes were in the range of 61–145 nm. The experimental results revealed that the catalytic efficiency as well as the charge transfer resistance (at the redox potential of the Fe(II)/Fe(III) couple) increased in the order of Pt < Pt–Pd < Pt–Pdsds. A Pt–Pdsds electrode exhibited an open circuit potential (OCP) of 0.65 V in acidic conditions; however, when 50.0 mM NaAsO2 was present, the OCP value shifted to 0.42 V. It has been projected that the As(III) oxidation proceeds using a sequential pathway: As(III) → As(IV) → As(V). After optimization of the square wave voltammetric data, the limits of detection of As(III) were obtained as 1.3 μg L−1 and 0.2 μg L−1 when the surface modification of the Pt surface was executed with Pd particles in the absence and presence of the SDS surfactant, respectively. Finally, real samples were analyzed with excellent recovery performance.
Introduction
Arsenic is a highly toxic element and its compounds are known to be poisonous substances, which are widely distributed in the earth's crust. There are up to 50 million people in the world at the risk of arsenicosis, because of which the World Health Organization (WHO) addressed this problem as the world's worst mass poisoning disaster.1–3 Prolonged ingestion of arsenic contaminated water can have a variety of adverse effects on health, including skin, lung, heart, bladder cancer and kidney diseases.3,4 In many countries, including Argentina, Bangladesh, Chile, China, India (West Bengal), Mexico, Thailand, and the United States of America, natural contamination of arsenic is a serious health concern. Hence, the WHO and the US Environmental Protection Agency (EPA) have revised the maximum value of arsenic concentration in drinking water from 50 μg L−1 to 10 μg L−1.5,6 The toxicity of arsenic compounds depends on their forms. Inorganic compounds are about 100 times more toxic than organic metabolites. Inorganic arsenic exists in water primarily in two forms: arsenite (AsO2−) and arsenate (AsO43−). The arsenite ions are formed under strongly reduced conditions and are extremely soluble in water and approximately 60 times more toxic than the arsenate ions due to their ability to react with enzymes in the human respiratory system.7 The high toxicity and widespread occurrence of arsenic in ground water have prompted a pressing need for developing methods and materials for arsenic monitoring. A wide variety of methods, such as atomic absorption spectrophotometry (AAS), X-ray spectrometry, electrothermal AAS in graphite furnaces (ETAAS), inductively coupled plasma-mass spectroscopy (ICP-MS), capillary electrophoresis, neutron activation analysis (NAA), UV-Visible spectroscopic, ion exchange, and colorimetry, have been used to determine arsenic in water.8–13 In contrast, the versatile electrochemical technique offers some advantages including simple instrumentation and operation, low cost and rapid analysis, high sensitivity and minimum and/or no secondary pollution. A large number of studies have been carried out on arsenic detection and low limit of determination (LOD) using electrooxidative14–17 and stripping voltammetric methods.18–21 Its noteworthy that the principle of the oxidation process is based on the conversion of As(III) into a stable product As(V) by releasing two electrons.22–24 However, since As(III) species are more soluble and mobile than As(V) species, development of electrode materials for the conversion of As(III) to As(V) regarding detection, determination, and removal is still a challenge. To date, several articles have been published on the electrochemical and electrokinetic studies of As(III) electro-oxidation using Pt, Au, Hg, indium tin oxide (ITO) coated glass and carbon-based materials.16,17,22–31 In this context, to the best of our knowledge, very few research groups have worked on the applicability of palladium as an electrocatalyst for As(III) electro-oxidation.22 Moreover, contemporary scientists and technologists are paying much attention to minimizing the usage of precious metals as catalysts by developing porosity in the catalytic matrix since this approach can improve the active catalytic area. In this concern, Attard et al., reported that mesoporous Pt films with a large surface area could be fabricated onto Au surface if the deposition is executed using hexachloroplatinic acid (H2[PtCl6]) in the presence of an octaethylene glycol monohexadecyl ether (C16EO8) surfactant.32 Another surfactant, sodium dodecyl sulphate (SDS), has also been proved to be an effective templating reagent in generating larger surface area pertaining to the development of large capacity oxygen storage mesoporous materials33 and in attaining effective nitrite reduction when the Pt electrode is fabricated on a glassy carbon substrate.34 Since the Pt surface is highly corrosion resistant and one of the most extensively used electrode substrates, we amplified the active surface area by immobilizing Pd particles on it using a very simple electrochemical approach. In the present study, we immobilized Pd nanoparticles on a platinum substrate in the presence of an SDS surfactant assuming that this approach might improve the sensing activity of the electrode surface in the context of arsenite oxidation reactions.Herein, prior to applying the Pd fabricated Pt electrode as a sensor to detect As(III), the catalytic surface was characterized using different analytical tools. Field emission scanning electron microscopy (FE-SEM), X-ray photoelectron spectroscopy (XPS) and electrochemical (electrochemical impedance spectroscopy (EIS) and cyclic voltammetry (CV)) techniques were used. In addition, the heterogeneous kinetics of the arsenite electro-oxidation reactions was also studied in 0.1 M H2SO4 by applying convolution potential sweep voltammetry (CPSV) for understanding the arsenite oxidation mechanism.
Experimental
Materials and chemicals
All the chemicals were of analytical grade and were used without further purification. Palladium nitrate (Pd(NO3)2) was obtained from Wako Pure Chemical Industries Ltd., Japan. Sulfuric acid (H2SO4), alumina powder (Al2O3), and potassium ferrocyanide (K4[Fe(CN)6]) were purchased from Aldrich Chemical Co. Inc., Germany and sodium meta arsenite was purchased from Merck, Germany. All the solutions were prepared with Millipore Milli-Q water (resistivity >18 MΩ cm and micro-organic concentration ≤3 μg L−1). Degassing was conducted prior to each measurement using pure N2.Preparation of Pt–Pd catalysts
Before conducting the experiments, the bare Pt electrode was mechanically polished with alumina (0.3 μm) slurry on a soft lapping pad until a mirror-like shiny surface was obtained. Then, the polished surface was rinsed with double-distilled water and cleaned consecutively using ethanol and double-distilled water with sonication (10 min each). Finally, the Pt surface cleaning was carried out by potential cycling in a N2-saturated 0.5 M H2SO4 solution from −0.2 to 1.5 V at a scan rate of 100 mV s−1 until the characteristic reproducible voltammograms of cleaned Pt surface pertaining to hydrogen adsorption/desorption were obtained.The Pd particles were then electrochemically deposited on the Pt surface by means of cyclic voltammetry. For this, potential cycling was performed using a Pt disk electrode (2 mm diameter) between 0 and −1.0 V 10 times at a 100 mV s−1 scan rate in N2-saturated 0.01 M Pd(NO3)2 in the absence and the presence of 100 mg L−1 SDS. A well-defined cathodic peak was observed at −0.85 V corresponding to the electro-deposited Pd metals onto the Pt substrate according to the eqn (1).
| Pd2+ + 2e− → Pd | (1) |
After successful deposition of Pd on the Pt surface, the electrode was cleaned thoroughly with copious amounts of deionized water to remove loosely bonded particles (including SDS) and then dried at 60 °C prior to electrochemical investigations. In this article, the Pd modified Pt electrodes fabricated in the absence and in the presence of SDS molecules were designated as Pt–Pd and Pt–Pdsds, respectively.
Surface characterization
The morphology of the Pd modified surface was evaluated using a field emission scanning electron microscopic (FE-SEM) instrument (JSM-7600F, Japan). Energy dispersive X-ray analysis (XEDS) was performed using a FESEM-coupled XEDS from JEOL, Japan. The XPS study was performed using a DLD spectrometer (Kratos Axis-Ultra; Kratos Analytical Ltd.) with an Al Kα radiation source (1486.6 eV). Energy calibration and component separation were conducted using the bundled software with pure Gaussian profiles and a Shirley background.Electrochemical measurements
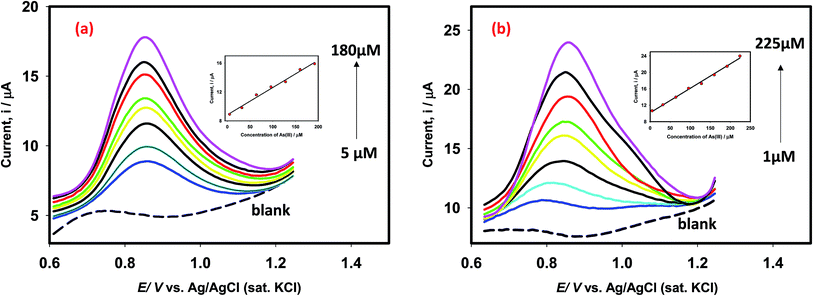
Electrochemical investigations were carried out with a computer-controlled Autolab potentiostat (PGSTST128 N, Netherlands) using a conventional three electrode cell. A Pd-modified Teflon jacket-coated Pt disk electrode (2 mm in diameter) served as the working electrode with Ag/AgCl (3 M KCl) and Pt wire acting as reference and counter electrodes, respectively. All the experiments were carried out at room temperature (25 ± 0.5 °C) in 0.1 M H2SO4.The working electrode (Pt/Pt–Pd/Pt–Pdsds) along with the counter and the reference electrodes were merged to form a 3-electrode cell containing 0.1 M H2SO4 with various concentration of As(III). The effect of scan rate was investigated by varying the scan rates, while keeping the concentration of As(III) (0.25 mM) constant. EIS measurements were performed in N2-saturated 0.1 M H2SO4 solution containing 1 mM NaAsO2 at an exciting potential of 1.0 V. The frequency range of EIS measurements was 0.1 MHz to 0.1 Hz with 50 measuring points. The open circuit potential (OCP) of the Pt–Pdsds electrode was determined in 0.1 M H2SO4 solution in the absence and the presence of 50 mM As(III) by recording linear polarization curves. The square wave voltammograms (SWV) were recorded (between 1 and 225 μM As(III) concentration) under inert conditions by applying an optimized step potential of 8 mV, amplitude of 20 mV, and frequency of 25 Hz.
Results and discussion
Surface characterization
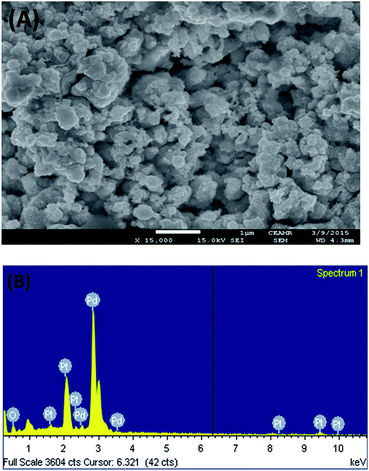
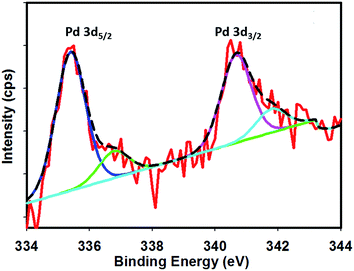
Fig. 1 shows the FE-SEM image with associated EDS spectra of Pd particles deposited on the Pt surface. It can be observed that the deposited particles are globular in nature and exist in aggregated form. The particle sizes of the deposited Pd particles are in the range of 61–145 nm. The intense EDS peak related to Pd particles as compared to that of Pt particles indicates that the surface predominantly contained Pd particles. In order to examine the surface properties profoundly, subsequent XPS analysis was performed. Fig. 2 shows the XPS fine scan spectra of Pd particles immobilized on the Pt surface. The XPS spectra (Fig. 2) of the deposited Pd particles over the Pt surface show two doublets originating from the spin–orbital splitting of the 3d5/2 and 3d3/2 states with the peaks centred at 335.4 eV and 340.7 eV, respectively, which are well-matched with the literature values.35 The peak corresponding to Pd 3d5/2 represents Pd(0) (BE = 335.4 eV) and an additional shoulder-like peak indicates the existence of Pd(II) species (BE = 337.5 eV), which is higher than the reported value (336.9 eV) for Pd(II).36 Thus, we assumed that this shifting of BE appeared due to the existence of some free Pd2+ ions adhered on the surface during the electrochemical deposition of palladium from Pd(NO3)2 solution. The narrow FWHM value (1.11 eV) suggests the identical oxide forms of Pd particles. The deconvolution of the spectrum suggested that the content of Pd(0) and Pd(II) particles were 75.72 and 24.28 at%, respectively. Moreover, to examine any change in Pt properties due to Pd deposition, the XPS of the Pt particles was recorded before and after Pd deposition. Before Pd deposition, the Pt particles exhibited a doublet at 71.2 eV (4f7/2) and 74.5 eV (4f5/2), indicating metallic platinum (Pt(0)) (see the ESI, Fig. S1†). After deconvolution, the shoulder-like peaks shifted to higher binding energies, i.e., 72.4 eV and 75.5 eV, which could be assigned to the existence of Pt(IV) species as platinum oxide and/or hydroxide that might have been formed due to oxidation of Pt(0) particles. After deposition of Pd particles, the position of the major peaks binding energies (associated to Pt 4f7/2 and Pt 4f5/2) were not measurably altered (see the ESI, Fig. S2†), indicating that Pt atoms did not have any chemical interactions with the deposited Pd atoms.Thus, we assumed that Pd atoms existed on the Pt surface as adatoms. To detect the Pt(IV) species, we tried to deconvolute the spectrum. However, the peak intensity of the Pt atoms was significantly low and spectra deconvolution was not possible. This observation suggests that the Pt surface was buried sufficiently under the Pd layers. Thus in this article, we have designated the working electrode as the Pd modified Pt electrode.
Electrochemical characterization
Fig. 3 shows the voltammograms of 0.01 M K4Fe(CN)6 in 0.1 M KNO3 recorded using Pt, Pt–Pd, and Pt–Pdsds electrodes at a scan rate of 50 mV s−1. The Pd particles were deposited on a Pt surface by cycling a Pt disk electrode in 0.01 M Pd(NO3)2 at the scan rate of 100 mV s−1 between −0.4 and −1.2 V (ESI, Fig. S3†). On integrating the peak area, it was found that the content of the deposited Pd particles was 2.7 × 10─3 μg, which was not affected by the presence or absence of the SDS molecules. Nevertheless, the Pt–Pdsds electrode generated maximum redox currents and followed a trend of Pt < Pt–Pd < Pt–Pdsds under the same experimental condition. It is well known that the efficiency of a redox process on a catalytic surface is generally increased by increasing the active surface area.37–40 Due to smaller sizes, the Pd nanoparticles provided higher surface area and thus improved contact areas with the reactants; this observation is analogous to those in homogeneous catalytic processes. However, it is observed that if the Pd deposition is executed in the presence of SDS molecules, the peak currents, in reference to a Pt electrode, increased by ca. 48%, while it increased by only 27% if the electrode was fabricated in the absence of SDS molecules. This observation implies that the Pd nanoparticles deposited in the presence of SDS molecules provided more contact area to the reactants than the Pd nanoparticles deposited in the absence of SDS molecules. Thus, in conjunction with reference,32 it can be assumed that the porosity of the catalytic matrix probably developed when the Pd nanoparticles were deposited in the presence of SDS molecules, thus providing more active surface area. In order to explore the consequences of surface area enlargement, the impedance spectra of the 1 mM NaAsO2 in 0.1 M H2SO4 was recorded by applying 1.0 V as the excitation potential assuming that at this potential, As(III) is oxidized. Fig. 4 shows the classical presentation of the Nyquist plots recorded using Pt, Pt–Pd, and Pt–Pdsds electrodes. As shown in Fig. 4 the charge transfer resistance (Rct) is augmented with an increasing order of Pt–Pdsds < Pt–Pd < Pt. The least Rct value exhibited by Pt–Pdsds confirms that the most favourable charge transfer pertaining to As(III) oxidation is administered by this electrode.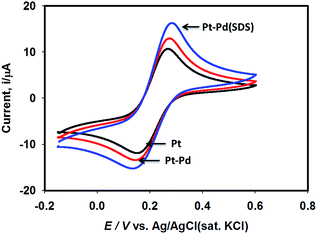 | ||
| Fig. 3 Cyclic voltammograms of 0.01 M K4Fe(CN)6 in 0.1 M KNO3 using Pt, Pt–Pd and Pt–Pdsds electrodes recorded at scan rate of 50 mV s−1. | ||
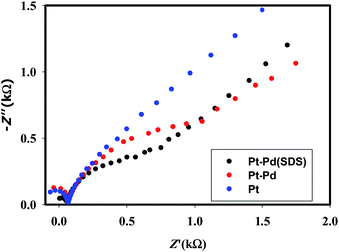 | ||
| Fig. 4 EIS spectra of 1 mM NaAsO2 in 0.1 M H2SO4 using Pt, Pt–Pd and Pt–Pdsds electrodes recorded at an excitation potential of 1.0 V. | ||
Since Pt–Pdsds assembly appeared to be the most efficient catalyst, in order to evaluate the types of interactions prevailing between Pd particles and the target arsenite ions in open circuit conditions in 0.1 M H2SO4, linear polarization curves were recorded using a Pt–Pdsds electrode assembly as a working electrode as shown in Fig. 5. It can be observed that the Pt–Pdsds surface exhibited OCP at 0.65 V; however, when 50 mM NaAsO2 was present, the OCP value shifted to 0.42 V. This observation suggests that Pt–Pdsds surface received negative charges after adsorption of arsenite ions. Thus, it could be assumed that Pt–Pdsds electrode might catalyse arsenite oxidation reactions after a pre-adsorption step. Therefore, to investigate the reaction mechanism in detail, heterogeneous electron transfer kinetics was studied next.
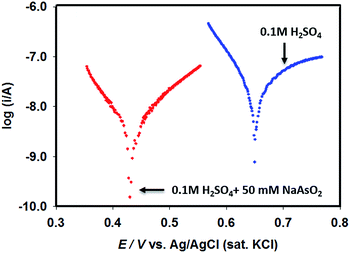 | ||
| Fig. 5 Linear polarization curves of Pt–Pdsds electrode recorded in 0.1 M H2SO4 in absence and in presence of 50 mM NaAsO2. | ||
Arsenite oxidation kinetics
Fig. 6 shows the cyclic voltammograms of 0.1 M H2SO4 in the absence and in the presence of 0.25 mM NaAsO2 recorded using Pt, Pt–Pd and Pt–Pdsds electrodes at a scan rate of 100 mV s−1. The electro-oxidation reactions of arsenite ions were studied by scanning the test solution between 0 and 1.2 V. A control experiment was performed and the result is included in the ESI (Fig. S4†).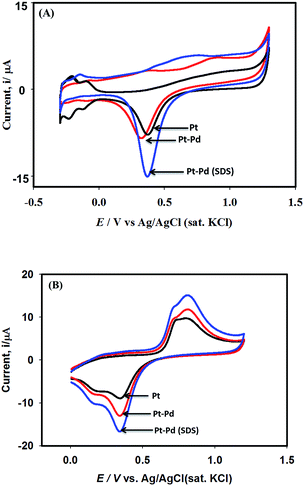 | ||
| Fig. 6 Cyclic voltammograms of 0.1 M H2SO4 using Pt, Pt–Pd and Pt–Pdsds electrodes at a scan rate of 100 mV s−1 (panel A). Panel ‘B’ shows corresponding voltammograms in presence of 0.25 mM NaAsO2. | ||
As shown in Fig. 6A, during the forward scan (negative to positive direction) small amount of oxidation current is observed between 0.5 and 1.1 V because of oxide formation; above 1.1 V, the current displayed is clearly associated with water oxidation. However, when the scan is reversed from 1.2 V, well-defined reductive waves (centred at ca. 0.34 V) are observed, which could be attributed to the reduction of the oxide particles formed during the positive scan. It should be noted that the peak height as well as the peak area obtained by the Pt–Pdsds electrode are larger than those obtained by a Pt or Pt–Pd surface, which again ensured enlargement of the active area of the Pd surface when deposition was executed in the presence of the SDS surfactant. However, when arsenite ions were added to 0.1 M H2SO4 solution, during positive scan, the characteristic waves pertaining to oxidation of arsenite ions (eqn (2)) develop between 0.62 and 1.0 V as shown in Fig. 6B.
| AsO2− + 2H2O → AsO43− + 4H+ + 2e− | (2) |
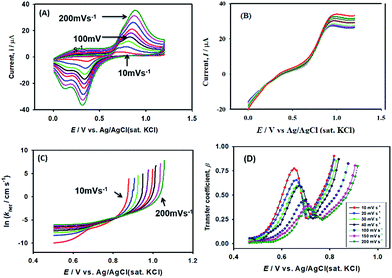
As expected, the most intense oxidation wave due to the reaction (eqn (2)) is observed in case of the Pt–Pdsds electrode. This observation ensures that maximum active sites were generated over the Pt–Pdsds surface to oxidize arsenite ions. It should be noted that at 0.72 and 0.80 V during the forward scan, two weak peaks are observed rather than a unique single peak. In order to assay these peaks, electro-kinetic investigations were performed next. For this purpose, CVs were recorded at variable scan rates (10 to 200 mV s−1) as shown in Fig. 7. It is observed from Fig. 7A that irrespective of the scan rate, a dual-hump like wave was retained during the positive scan. To explain such current–potential behaviour, convolution potential sweep voltammetry (CPSV) is often helpful. According to CPSV, the convolution current (I) is associated to the experimentally observed voltammetric current (i) as per the convolution integral (eqn (3)).41–46
 | (3) |
By approximating the above integral using Lawson–Maloy algorithm,47 the dependence of the convoluted current on applied potential can be deduced. In the present study, typical sigmoidal curves were obtained (shown in Fig. 7B) with a plateau at a large positive potential. The plateau level represents limiting convolution current (Il) as given by eqn (4).
 | (4) |
The heterogeneous rate constant (khet) for any irreversible electron transfer reaction can then be determined using the following equation (eqn (5)):48,49
 | (5) |
 | (6) |
Using the heterogeneous rate constants extracted from eqn (5) at variable potentials, the values of β were calculated using eqn (6). Excitingly, as shown in Fig. 7D, the variation of β with applied potential is also non-linear consisting of two distinct linear segments denoting two different oxidations.
This behaviour is usually observed only when the oxidation reaction proceeds using a stepwise mechanism. Pertaining to CV obtained at 10 mV s−1 scan rate in the first segment before 0.65 V, As(III) oxidized to metastable As(IV) species. In the second segment (above 0.70 V), intermediate As(IV) oxidized to As(V) species. The intermediate region between 0.65 and 0.70 V is critical, indicating that probably both oxidation reactions took place.
Chronoamperometry
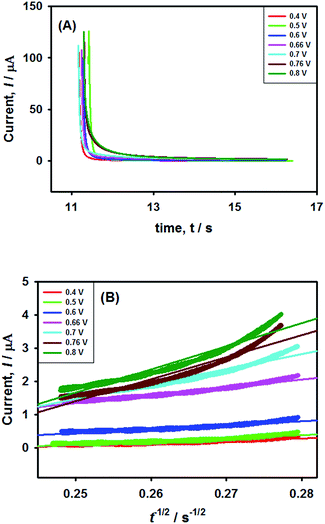
In order to verify the results obtained by voltammetry, chronoamperometric (CA) investigations of 0.25 mM NaAsO2 were performed in 0.1 M H2SO4 applying different step potentials ranging between 0.4 and 0.8 V as shown in Fig. 8(A).The changes in diffusional currents at different fixed potentials with respect to the reciprocal of the square root of time are illustrated in Fig. 8B. The currents are observed to increase with an increase in the step potential. Then, Cottrell equation [eqn (7)] was adapted to calculate the number of heterogeneous electron transfers:
 | (7) |
This result supports the results of the previously conducted CV and CPSV experiments, where we proposed that the electro-oxidation of As(III) on the Pt–Pdsds surface in a highly acidic medium is a two-step consecutive process. The As(III) species releases one electron at just below 0.7 V under the experimental conditions to form a metastable As(IV) species, which instantly releases another electron and forms As(V). Thus, it can be concluded that As(III) electro-oxidation undergoes via As(IV) to form As(V) at the Pt–Pdsds electrode surface in 0.1 M H2SO4.
These observations are also supported by the study conducted by Catherino et al., in which the authors analysed the i–E behaviour of As(III) oxidation curves recorded by a Pt electrode in HClO4 and predicted a stepwise (As(III) → As(IV) → As(V)) reaction path.23
LOD evaluation
In order to propose an efficient sensor for determination of As(III) in drinking water, we obtained the square wave voltammograms (SWV) of arsenite ions using Pt–Pd and Pt–Pdsds electrodes as shown in Fig. 9. For this purpose, the SWVs of variable arsenite concentrations were recorded between 1 μM and 225 μM (of As(III) concentration) at room temperature. The Pt–Pd and Pt–Pdsds electrodes exhibited a linear relationship (Ip vs. conc.) within the reported concentration range (5 to 225 μM for Pt–Pd and 1 to 225 μM for Pt–Pdsds). The slopes of the plots were 4.0 × 10⁻² AM−1(r2: 0.99) and 9.5 × 10⁻² AM−1(r2: 0.99), for the Pt–Pd and Pt–Pdsds electrodes, respectively. The larger slope value of the calibration curve exhibited by the Pt–Pdsds electrode justifies its superior catalytic efficiency pertaining to arsenite oxidation reactions. The limit of detection (LOD) was obtained from the slope (SC) of the calibration curve and standard deviation (SD) of the blank solution (LOD = 3 × [SD/SC]). The evaluated LOD values were found to be 1.3 μg L−1 and 0.2 μg L−1 for Pt–Pd and Pt–Pdsds electrodes, respectively. These results are much better than those obtained by the bulk Pt electrode.27 It should be noted that the WHO recommends the maximum permissible level of arsenic in drinking water to be 10 μg L−1. Thus, our experimental data suggest that the Pt–Pdsds sensor might be helpful in determining arsenic for practical purposes compared to various types of Pt based electrodes as reported in Table 1.| Electrode systems | Technique/method | LDR/μM | LOD/μg L−1 | Electrolyte | Ref. |
|---|---|---|---|---|---|
| a Note: LSASV: linear sweep anodic stripping voltammetry; SWASV: square wave anodic striping voltammetry; LSV: linear sweep voltammetry; SWV: square wave voltammetry; LDR: linear dynamic range; LOD: Limit of Detection [LOD = 3 x (standard deviation of the blank/slope of the linear Ip vs. conc. plot)]. | |||||
| Pt NPS | LSV | — | 2.1 | 0.1 M H2SO4 | 27 |
| Au–PtNPs/GCE | LSASV | 0.375–225 | 0.28 | 0.5 M H2SO4 | 51 |
| FePt NPs | SWASV | 1–15 | 0.8 | 10 mM PBS (7.0) | 52 |
| PtNPs-C/GCE | SWASV | 0–1000 | — | 0.5 M H2SO4 | 53 |
| Pt–Pd | SWV | 5–225 | 1.3 | 0.1 M H2SO4 | This work |
| Pt–Pdsds | SWV | 1–225 | 0.2 | 0.1 M H2SO4 | This work |
Determination of arsenite in real samples
To check the validity of the developed catalytic surface as a sensor in real system analysis, Pt–Pdsds was employed to quantify arsenite from underground water by the standard addition method. Five underground water samples were collected from different deep-tube wells and solutions of arsenite ions (10.0 μg L−1) were prepared. The obtained results are summarized and presented in Table 2. A very good recovery of arsenite ions (99.6–102.3%) indicates the effectiveness and reliability of the proposed Pt–Pdsds sensor.| Samples | Added (μg L−1) | Obtaineda (μg L−1) | Recoveryb (%) | RSDc (%) |
|---|---|---|---|---|
| a Mean of the three repeated determinations (S/N = 3).b (Concentration of arsenite determined/concentration of arsenite) × 100%.c Relative standard deviation (RSD) value indicates precision among three repeated determinations. | ||||
| Tube well-1 | 10 | 10.12 | 101.2 | 3.15 |
| Tube well-2 | 10 | 9.99 | 99.90 | 3.12 |
| Tube well-3 | 10 | 9.96 | 99.60 | 3.11 |
| Tube well-4 | 10 | 10.23 | 102.30 | 3.17 |
| Tube well-5 | 10 | 10.21 | 102.21 | 3.33 |
Consequently, the present study suggests that performance of the Pd modified Pt electrode for arsenic detection is the best when the modification is performed in the presence of an SDS surfactant.
Stability and interferences
In order to check the stability of the proposed sensor, batch injection analysis was performed. For this, a homemade batch cell was used under choroamperometric mode. The experiment was carried out for 600 s by setting the working potential at 0.9 V in 0.1 M H2SO4. A constant current was assured before first injection of 50 μL of 100 μM arsenite solution. Periodically, arsenite solution was injected and the current intensity was increased, leading to sharp, reproducible peaks. A short time passed by the analyte at the surface of the electrode leads to a levelling of the signal for the presence of As(III) species. The experiment was repeated several times and reproducible signals were observed as shown in Fig. 10. Thus, the batch chronoamperometry analysis showed that this sensor is stable and can be applied for longer duration for As(III) detection.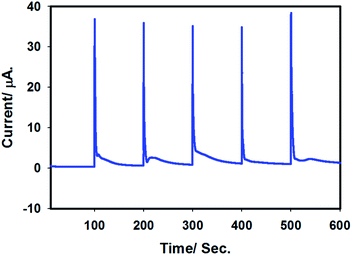 | ||
| Fig. 10 Batch injection chronoamperogram for stability test of Pt–Pdsds in 0.1 M H2SO4. Applied potential: 0.9 V. Batch injection: 50 μL of 100 μM arsenite solution. | ||
Finally, interferences were checked. Arsenite primarily coexists in nature with Na+, K+, Fe3+, Cu2+, NO3−, SO42−, Cl− etc. However, we did not notice any interference in the case of batch injection chronoamperometric experiments. This observation ensures that this sensor can be selectively used for As(III) detection in water.
Conclusion
Electro-oxidation of arsenite ions was investigated using cyclic voltammetry and CPSV techniques. A Pd modified Pt electrode surface was investigated using XPS analysis, which demonstrated that Pd exists both in metallic and oxidized states. The catalytic activity was significantly enhanced when Pd particles were deposited in the presence of a templating agent, i.e., SDS. This may occur due to an increase in the porosity or catalytic active sites. The investigation of electron transfer kinetics revealed that arsenite oxidation reaction occurred using a stepwise reaction mechanism, forming a metastable As(IV) species in a certain potential range, which finally converted to As(V). The LOD of the As(III) was determined to be 0.2 μg L−1 using a Pt–Pdsds sensor. The result presented in this article, particularly enlargement of the active surface area of Pd nanoparticles may be beneficial to similar catalytic processes in future research.Conflicts of interest
There are no conflicts to declare.Acknowledgements
Shahjalal University of Science and Technology Research Center is highly appreciated for allocating a research grant (2017-18) to conduct this research. The Ministry of Science and Technology of Bangladesh is acknowledged for the financial support (2017–18). The World Academy of Sciences (TWAS) is also acknowledged greatly for the development of our laboratory facilities (ref. 14−050 RG/CHE/AS_G050 RG/CHE/AS_G; UNESCO FR 34028605).References
- R. Feeney and S. P. Kounaves, Talanta, 2002, 58, 23–31 CrossRef CAS PubMed.
- M. G. M. Alam, G. Allinson, F. Stagnitti, A. Tanaka and M. Westbrooke, Int. J. Environ. Health Res., 2002, 12, 236–253 CrossRef PubMed.
- B. A. Sadee, M. E. Foulkes and S. J. Hill, Food Chem., 2016, 210, 362–370 CrossRef CAS PubMed.
- J. Mehovic and J. Blum, Arsenic Poisoning in Bangladesh, South Asia Research Institute for Policy and Development, Cambridge, 2004 Search PubMed.
- S. Shankar, U. Shanker and Shikha, Sci. World J., 2014, 2014, 1, DOI:10.1155/2014/304524.
- C. L. Balazs, R. Morello-Frosch, A. E. Hubbard and I. Ray, Environ. Health, 2012, 11, 1–84, DOI:10.1186/1476-069x-11-84.
- P. R. Kumar, S. Chaudhari, K. C. Khilar and S. P. Mahajan, Chemosphere, 2004, 55, 1245–1252 CrossRef PubMed.
- A. Bonyár, P. Nagy, V. Mayer, A. Vitéz, A. Gerecs, H. Sántha and G. Harsányi, Sens. Actuators, B, 2017, 251, 1042–1049 CrossRef.
- M. Burguera and J. L. Burguera, Talanta, 1997, 44, 1581–1604 CrossRef CAS PubMed.
- N. Tanjila, A. Rayhan, M. S. Alam, I. A. Siddiquey and M. A. Hasnat, RSC Adv., 2016, 6, 93162–93168 RSC.
- W. Siangproh, O. Chailapakul and K. Songsrirote, Talanta, 2016, 153, 197–202 CrossRef CAS PubMed.
- Z. Guo, M. Yang and X.-J. Huang, Curr. Opin. Electrochem., 2017, 3, 130–136 CrossRef.
- M. Zhu, X. Zeng, Y. Jiang, X. Fan, S. Chao, H. Cao and W. Zhang, Chemosphere, 2017, 168, 1677–1683 CrossRef CAS PubMed.
- E. Lacasa, P. Canizares, M. A. Rodrigo and F. J. Fernandez, J. Hazard. Mater., 2012, 203–204, 22–28 CrossRef CAS PubMed.
- J. F. Rivera, I. P. Paintrand, E. Pereira, B. L. Rivas and J. C. Moutet, Electrochim. Acta, 2013, 110, 465–473 CrossRef CAS.
- M. M. O. Thotiyl, H. Basit, J. A. Sánchez, C. Goyer, L. C. Guerente, P. Dumy, S. Sampath, P. Labbé and J. C. Moutet, J. Colloid Interface Sci., 2012, 383(1), 130–139 CrossRef PubMed.
- J. A. Sánchez, B. L. Rivas, S. A. Pooley, L. N. Basaez, E. Pereira, I. P. Paintrand, C. Bucher, G. Royal, E. S. Aman and J. C. Moutet, Electrochim. Acta, 2010, 55, 4876–4882 CrossRef.
- L. Xiao, G. G. Wildgoose and R. G. Compton, Anal. Chim. Acta, 2008, 620, 44–49 CrossRef CAS PubMed.
- L. Bu, T. Gu, Y. Ma, C. Chen, Y. Tan, Q. Xie and S. Yao, J. Phys. Chem. C, 2015, 119, 11400 CAS.
- Y. Song and G. M. Swain, Anal. Chim. Acta, 2007, 593(1), 7–12 CrossRef CAS PubMed.
- T. Gu, L. Bu, Z. Huang, Y. Liu, Z. Tang, Y. Liu, S. Huang, Q. Xie, S. Yao, X. Tu, X. Luo and S. Luo, Electrochem. Commun., 2013, 33, 43–46 CrossRef CAS.
- M. Sun, G. Zhang, Y. Qin, M. Cao, Y. Liu, J. Li, J. Qu and H. Liu, Environ. Sci. Technol., 2015, 49, 9289–9297 CrossRef CAS PubMed.
- H. A. Catherino, J. Phys. Chem., 1967, 71, 268–274 CrossRef CAS.
- M. A. Hasnat, M. M. Hasan, N. Tanjila, M. M. Alam and M. M. Rahman, Electrochim. Acta, 2017, 225, 105–113 CrossRef CAS.
- H. Xu, L. P. Zeng, S. J. Xing, G. Y. Shi, J. Chen, Y. Z. Xian and L. Jin, Electrochem. Commun., 2008, 10, 1893–1896 CrossRef CAS.
- A. Salimi, M. E. Hyde, C. E. Banks and R. G. Compton, Analyst, 2004, 129, 9–14 RSC.
- X. Dai and R. G. Compton, Analyst, 2006, 131, 516–521 RSC.
- J. Jeong, J. Das, M. Choi, J. Jo, M. A. Aziz and H. Yang, Analyst, 2014, 139, 5813–5817 RSC.
- Y. Ma, Y. Qin and C. Lin, Chemosphere, 2014, 103, 349–353 CrossRef CAS PubMed.
- Y. Ma, Y. Qin, B. Zheng, L. Zhang and Y. Zhao, Environ. Sci. Pollut. Res. Int., 2016, 23, 1381–1390 CrossRef CAS PubMed.
- R. Woods, I. M. Kolthoff and E. J. Meehan, J. Am. Chem. Soc., 1964, 86, 1698–1700 CrossRef CAS.
- G. S. Attard, P. N. Bartlett, N. R. B. Coleman, J. M. Elliott, J. R. Owen and J. H. Wang, Science, 1997, 278, 838–840 CrossRef CAS.
- M. Machida, K. Kawamura, T. Kawano, D. Zhang and K. Ikeue, J. Mater. Chem., 2006, 16, 3084–3090 RSC.
- M. A. Hasnat, M. A. Rashed, M. Saiful Alam, M. Maria Rahman, M. Amirul Islam, S. Hossain and N. Ahmed, Catal. Commun., 2010, 11, 1085–1089 CrossRef CAS.
- M. Peuckert, J. Phys. Chem., 1985, 89, 2481–2486 CrossRef CAS.
- A. Gniewek, A. M. Trzeciak, J. J. Ziółkowski, L. Kȩpiński, J. Wrzyszcz and W. Tylus, J. Catal., 2005, 229, 332–343 CrossRef CAS.
- M. S. Freud, A. B. Toth, T. M. Cotton and E. R. Henderson, Anal. Chem., 1991, 63, 1047–1049 CrossRef.
- G. E. Cabanis, A. A. Diamantis, W. R. Murphy Jr, R. W. Linton and T. J. Meyer, J. Am. Chem. Soc., 1985, 107, 1845–1853 CrossRef.
- R. C. Engstrom and V. A. Strasser, Anal. Chem., 1984, 56, 136–141 CrossRef CAS.
- J. X. Qiao, H. Q. Luo and N. B. Li, Colloids Surf., B, 2008, 62, 31–35 CrossRef CAS PubMed.
- A. Muthukrishnan, V. Boyarskiy, M. V. Sangaranarayanan and I. Boyarskaya, J. Phys. Chem., 2012, 116, 655–664 CAS.
- J. M. Saveant and D. Tessier, J. Electroanal. Chem. Interfacial Electrochem., 1975, 61, 251–263 CrossRef CAS.
- C. L. Bentley, A. M. Bond, A. F. Hollenkamp, P. J. Mahon and J. Zhang, Anal. Chem., 2014, 86, 2073–2081 CrossRef CAS PubMed.
- S. Antonello, M. Musumeci, D. D. M. Wayner and F. Maran, J. Am. Chem. Soc., 1997, 119, 9541–9549 CrossRef CAS.
- P. Daubinger, J. Kieninger, T. Unmüssig and G. A. Urban, Phys. Chem. Chem. Phys., 2014, 16, 8392–8399 RSC.
- A. J. Bard and L. R. Faulkner, Electrochemical Methods: Fundamentals and Applications, Wiley, New York, 2000 Search PubMed.
- R. J. Lawson and J. T. Maloy, Anal. Chem., 1974, 46, 559–562 CrossRef CAS.
- R. L. Donkers, F. Maran, D. D. M. Wayner and M. S. Workentin, J. Am. Chem. Soc., 1999, 121, 7239–7248 CrossRef CAS.
- C. L. Dufaure, F. Najjar and C. A. Barres, J. Phys. Chem. B, 2010, 114, 9848–9853 CrossRef PubMed.
- R. A. Marcus and N. Sutin, Biochim. Biophys. Acta, 1985, 811, 265–322 CrossRef CAS.
- L. J. Bu, J. Liu, Q. J. Xie and S. Z. Yao, Electrochem. Commun., 2015, 59, 28–31 CrossRef CAS.
- N. Moghimi, M. Mohapatra and K. T. Leung, Anal. Chem., 2015, 87, 5546–5552 CrossRef CAS PubMed.
- D. D. Han, Z. G. Liu, J. H. Liu and X. J. Huang, RSC Adv., 2015, 5, 38290–38297 RSC.
Footnote |
| † Electronic supplementary information (ESI) available. See DOI: 10.1039/c7ra12576c |
| This journal is © The Royal Society of Chemistry 2018 |

