 Open Access Article
Self-assembled MoS2/rGO nanocomposites with tunable UV-IR absorption†
Wei Wang *ab,
Olesya O. Kapitanovac,
Pugazhendi Ilanchezhiyanb,
Sixing Xia,
Gennady N. Panin
 *bd,
Dejun Fue and
Tae Won Kangb
aSchool of Mathematics & Physics, Hebei University of Engineering, Handan 056038, China. E-mail: wangwei19872010@163.com
bDepartment of Physics, Quantum-functional Semiconductor Research Center, Nano Information Technology Academy, Dongguk University, Seoul 100-715, Republic of Korea. E-mail: g_panin@dongguk.edu
cDepartment of Chemistry, Moscow State University, Leninskie Gory, 1, b.3, 119991, Moscow, Russia
dInstitute for Microelectronics Technology & High Purity Materials, RAS, 142432 Chernogolovka, Moscow District, Russia. E-mail: panin@iptm.ru
eKey Laboratory of Artificial Micro- and Nano-Materials of Ministry of Education, School of Physics and Technology, Wuhan University, Wuhan 430072, China
First published on 10th January 2018
Abstract
MoS2/reduced graphene oxide (rGO) nanocomposites were synthesized using an ultrasonic pretreatment with a single-stage hydrothermal and reduction process. Self-assembled MoS2 layers in the rGO matrix were obtained. The effect of quantum confinement in the structure, controlled by the degree of reduction of graphene oxide and the size of the 2D MoS2 nanocrystals, made it possible to obtain tunable optical absorption. MoS2/rGO layered nanocomposites exhibit a wide UV-IR absorption in the wavelength range from 280 nm to 973 nm, which is attractive for highly efficient multiband solar cells and advanced photonics.
Introduction
Layered two-dimensional materials have attracted considerable interest owing to their outstanding physical and chemical properties. The first and most investigated two-dimensional crystal graphene has excellent mechanical, thermal, electrical, and optical properties1–5 and is promising in various fields, such as electronics,6,7 optoelectronics,8,9 supercapacitors,10,11 photocatalysis,12 and biochemical sensors.13Recently, molybdenum disulfide (MoS2), a layered inorganic compound that is a semiconducting analog of graphene, has attracted much attention due to its noticeable bandgap, suitable for logic applications in electronics, and photonics. The MoS2 crystal consists of covalently bonded S–Mo–S atoms in the plane. The adjacent layers with a spacing of ∼6.5 Å are weakly stacked on the top of each other by van der Waals interactions. The indirect band gap of 1.3 eV for bulk crystal MoS2 is transformed into a direct band gap of ∼1.9 eV for monolayer MoS2, which is attributed to quantum confinement resulting in changes in hybridization states d- and pz-electrons of Mo and S atoms, respectively.14 Remarkable mechanical15–17 and opto-electrical properties14 of MoS2 make it attractive in various fields of energy harvesting and storage such as hydrogen storage,18,19 photocatalysis,20 solar cells21 and ion batteries.22–25 Weak van der Waals interactions of neighboring MoS2 layers allow the creation of new composites with unique properties.26 Hydrothermal/solvothermal synthesis is a cost effective way of growing MoS2 due to low growth temperature, a simple inexpensive process and mild synthetic conditions suitable for varies substrates, including flexible, large-scale, and selectively structured. The morphology of the MoS2 crystals can be controlled by pretreating the substrate prior to the growth process by adding an organic solvent such as i-propanol (IPA), acetic acid, L-cysteine, and oleylamine,22,23,27,28 which play the role of buffering. Structural and morphological compatibility of graphene and MoS2 allows the use of graphene-like molecules, such as reduced graphene oxide (rGO), carbon nanotubes, etc. as a precursor platform in the hydrothermal method for producing layered MoS2.23,25,27
In this work, self-assembled MoS2/rGO nanocomposites with various structures were obtained using ultrasonic pretreatment with liquid-phase reaction and reduction, which allow controlling the optical absorption of nanocomposites in a wide range of wavelengths.
Experimental
Synthesis of graphene oxide
Graphene oxide (GO) was obtained by a modified Hummer's method.29,30 In this method, oxidation was combined with a highly efficient method of purifying reaction products. Concentrated sulphuric acid (H2SO4, purity 96%, 360 mL) and phosphoric acid (H3PO4, purity 69.2%, 40 mL) were placed in a flask with mild stirring. Natural graphite flakes (Aldrich graphite, 3.0 g, purity 99.995 wt%, high density) were added and dispersed in the mixture, followed by the gradual addition of potassium permanganate (KMnO4, 18.0 g, purity 99%) used as the reducing agent during reaction process. The above mixture was maintained for 36 h at room temperature to release the gas under continuous stirring. The resulting solution is terminated by the addition of an aqueous solution of hydrogen peroxide (H2O2, 3 mL, 30 wt%), followed by continuous stirring for 30 minutes. The resulting mixture was then added to an aqueous solution of H2SO4 (500 mL, 5 wt%) with stirring for 20 minutes, followed by stirring for 1 hour. The mixture was sifted through two metal standard testing sieves with diameters of 320 μm and 30 μm. The filtrate was centrifuged with 9000 rpm for 20 minutes, and the supernatant was decanted away. The remaining solid material was then washed successively with 400 mL of 30% HCl, 1000 mL of distilled water, and 1000 mL of ethanol. The resulting GO suspension was dried in vacuum at 60 °C.Synthesis of MoS2/rGO composite and characterization
MoS2/rGO nanocomposites with MoS2 2D crystals in the rGO matrix were prepared by ultrasonic pretreatment with a soft liquid-phase reaction and reduction using sodium molybdate (Na2MoO4·2H2O), thioacetamide (CH3CSNH2, TAA), and GO as starting materials. The CH3CSNH2 (TAA, 0.06 g) and 0.5 mg mL−1 GO suspension, TAA![[thin space (1/6-em)]](https://www.rsc.org/images/entities/char_2009.gif) :
:![[thin space (1/6-em)]](https://www.rsc.org/images/entities/char_2009.gif) GO = 1
GO = 1![[thin space (1/6-em)]](https://www.rsc.org/images/entities/char_2009.gif) :
:![[thin space (1/6-em)]](https://www.rsc.org/images/entities/char_2009.gif) 1 (wt%) (0 mg mL−1; 1 mg mL−1, 1
1 (wt%) (0 mg mL−1; 1 mg mL−1, 1![[thin space (1/6-em)]](https://www.rsc.org/images/entities/char_2009.gif) :
:![[thin space (1/6-em)]](https://www.rsc.org/images/entities/char_2009.gif) 2 (wt%), 1.5 mg mL−1, 1
2 (wt%), 1.5 mg mL−1, 1![[thin space (1/6-em)]](https://www.rsc.org/images/entities/char_2009.gif) :
:![[thin space (1/6-em)]](https://www.rsc.org/images/entities/char_2009.gif) 3 (wt%)) were dissolved in a beaker with 20 mL of deionized (DI) water. After ultrasonication for 1 h, Na2MoO4·2H2O (0.03 g) was added into the solution. GO sheets containing abundant oxygen functional groups give rise to good dispersion due to the interaction between cations and GO sheets and at the same time lead to a decrease in the interaction between GO sheets and inorganic species owing to their negative charge.31 After vigorous stirring and ultrasonication of obtained dispersion both for 30 min, the pH value of the mixture was mildly modified to neutral by adding 1 M NaOH drop by drop. The obtained solution was used to grow MoS2/rGO composite by the hydrothermal technique. The blended solution was transferred into a 100 mL Teflon-lined stainless steel autoclave, followed by heating at 220 °C for 24 h. During hydrothermal process, GO was reduced using NaOH as a reducing agent to rGO with simultaneous dispersion of MoS2 and rGO nanosheets. The black precipitates of MoS2/rGO composites were first retrieved from the mixed solution after natural cooling down to room temperature and then were washed by centrifugation (9000 rpm for 20 min) with 200 mL of acetone, 200 mL of methanol, and 200 mL of DI water for more than five times decanting away the supernatant. Then obtained product was dried at 80 °C for 6 h in a vacuum oven. The black powder of MoS2/rGO composite of different composition was dispersed in IPA by vigorously sonication for 1 h to produce the homogenous solution. Ultrasonication was carried out through a point probe (Vibra cell) and a high-speed centrifuge (Eppendorf 5804). The suspension was separated out by different centrifugation speed. The obtained suspension of MoS2/rGO composite was spin-coated on the SiO2/Si substrate. The obtained composites were annealed with a rapid thermal annealing at 800 °C for 5 min in a gas stream of 200 sccm (H2/N2 = 1
3 (wt%)) were dissolved in a beaker with 20 mL of deionized (DI) water. After ultrasonication for 1 h, Na2MoO4·2H2O (0.03 g) was added into the solution. GO sheets containing abundant oxygen functional groups give rise to good dispersion due to the interaction between cations and GO sheets and at the same time lead to a decrease in the interaction between GO sheets and inorganic species owing to their negative charge.31 After vigorous stirring and ultrasonication of obtained dispersion both for 30 min, the pH value of the mixture was mildly modified to neutral by adding 1 M NaOH drop by drop. The obtained solution was used to grow MoS2/rGO composite by the hydrothermal technique. The blended solution was transferred into a 100 mL Teflon-lined stainless steel autoclave, followed by heating at 220 °C for 24 h. During hydrothermal process, GO was reduced using NaOH as a reducing agent to rGO with simultaneous dispersion of MoS2 and rGO nanosheets. The black precipitates of MoS2/rGO composites were first retrieved from the mixed solution after natural cooling down to room temperature and then were washed by centrifugation (9000 rpm for 20 min) with 200 mL of acetone, 200 mL of methanol, and 200 mL of DI water for more than five times decanting away the supernatant. Then obtained product was dried at 80 °C for 6 h in a vacuum oven. The black powder of MoS2/rGO composite of different composition was dispersed in IPA by vigorously sonication for 1 h to produce the homogenous solution. Ultrasonication was carried out through a point probe (Vibra cell) and a high-speed centrifuge (Eppendorf 5804). The suspension was separated out by different centrifugation speed. The obtained suspension of MoS2/rGO composite was spin-coated on the SiO2/Si substrate. The obtained composites were annealed with a rapid thermal annealing at 800 °C for 5 min in a gas stream of 200 sccm (H2/N2 = 1![[thin space (1/6-em)]](https://www.rsc.org/images/entities/char_2009.gif) :
:![[thin space (1/6-em)]](https://www.rsc.org/images/entities/char_2009.gif) 4).
4).
The crystalline structure of the synthesized MoS2/rGO composites was analyzed by field emission scanning electron microscopy (FESEM, S4800), X-ray diffraction techniques (XRD, Bruker D8 Advance) using a Cu Kα radiation (λ = 0.154 nm), high resolution transmission electron microscopy (HRTEM, JEM-2010FEF), and micro-Raman spectrometry (LabRAM HR800, He–Ne laser, 488 nm). The chemical composition of the composites was investigated using X-ray photoelectron spectroscopy (XPS, Escalab 250Xi, Mg Kα excitation), and the XPS spectra were fitted using Gaussian–Lorentzian peak shape and Shirley background subtraction. Optical absorption spectra were recorded using a Carry UV-vis spectrophotometer at room temperature.
Results and discussion
Fig. 1 shows SEM images of MoS2/rGO nanocomposites with different ratios. The as-grown MoS2 (TAA![[thin space (1/6-em)]](https://www.rsc.org/images/entities/char_2009.gif) :
:![[thin space (1/6-em)]](https://www.rsc.org/images/entities/char_2009.gif) GO = 1
GO = 1![[thin space (1/6-em)]](https://www.rsc.org/images/entities/char_2009.gif) :
:![[thin space (1/6-em)]](https://www.rsc.org/images/entities/char_2009.gif) 0) shows significantly aggregated spherical particles with a diameter of ∼700 nm (Fig. 1(a)). However the addition of GO leads to a decrease in the diameter and degree of aggregation of the particles (TAA
0) shows significantly aggregated spherical particles with a diameter of ∼700 nm (Fig. 1(a)). However the addition of GO leads to a decrease in the diameter and degree of aggregation of the particles (TAA![[thin space (1/6-em)]](https://www.rsc.org/images/entities/char_2009.gif) :
:![[thin space (1/6-em)]](https://www.rsc.org/images/entities/char_2009.gif) GO = 1
GO = 1![[thin space (1/6-em)]](https://www.rsc.org/images/entities/char_2009.gif) :
:![[thin space (1/6-em)]](https://www.rsc.org/images/entities/char_2009.gif) 1) (Fig. 1(b)). MoS2 spheres are not observed for MoS2/rGO dispersions with TAA
1) (Fig. 1(b)). MoS2 spheres are not observed for MoS2/rGO dispersions with TAA![[thin space (1/6-em)]](https://www.rsc.org/images/entities/char_2009.gif) :
:![[thin space (1/6-em)]](https://www.rsc.org/images/entities/char_2009.gif) GO = 1
GO = 1![[thin space (1/6-em)]](https://www.rsc.org/images/entities/char_2009.gif) :
:![[thin space (1/6-em)]](https://www.rsc.org/images/entities/char_2009.gif) 2 and 1
2 and 1![[thin space (1/6-em)]](https://www.rsc.org/images/entities/char_2009.gif) :
:![[thin space (1/6-em)]](https://www.rsc.org/images/entities/char_2009.gif) 3, indicating that rGO derived from GO acts as a dispersant platform, efficiently reducing the aggregation of MoS2 and forming during the hydrothermal process, self-assembled MoS2/rGO layered structures. Annealing changes slightly the morphology of the as-grown structure (Fig. 1S†).
3, indicating that rGO derived from GO acts as a dispersant platform, efficiently reducing the aggregation of MoS2 and forming during the hydrothermal process, self-assembled MoS2/rGO layered structures. Annealing changes slightly the morphology of the as-grown structure (Fig. 1S†).
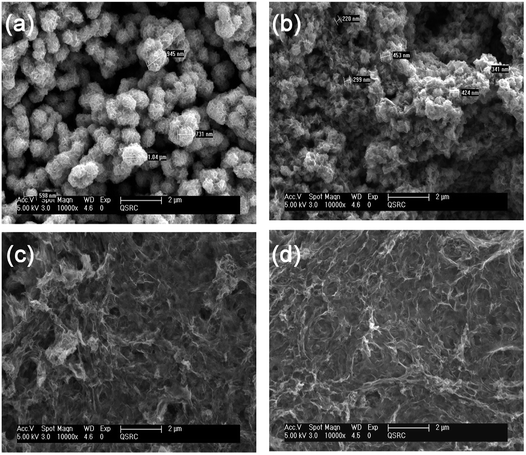 | ||
Fig. 1 SEM images of the grown MoS2/rGO with the ratio (a) (1![[thin space (1/6-em)]](https://www.rsc.org/images/entities/char_2009.gif) : :![[thin space (1/6-em)]](https://www.rsc.org/images/entities/char_2009.gif) 0), (b) (1 0), (b) (1![[thin space (1/6-em)]](https://www.rsc.org/images/entities/char_2009.gif) : :![[thin space (1/6-em)]](https://www.rsc.org/images/entities/char_2009.gif) 1), (c) (1 1), (c) (1![[thin space (1/6-em)]](https://www.rsc.org/images/entities/char_2009.gif) : :![[thin space (1/6-em)]](https://www.rsc.org/images/entities/char_2009.gif) 2) and (d) (1 2) and (d) (1![[thin space (1/6-em)]](https://www.rsc.org/images/entities/char_2009.gif) : :![[thin space (1/6-em)]](https://www.rsc.org/images/entities/char_2009.gif) 3). 3). | ||
Fig. 2a shows X-ray diffraction patterns of MoS2/rGO composites with different TAA/GO ratios. The diffraction peaks at 2θ = 14.1, 29.5, 32.9, 33.8, 39.5, 43.3, 49.4, 58.4, and 59.2 degree are in good agreement with the (002), (004), (100), (101), (103), (006), (105), (110) and (008) planes of the hexagonal MoS2 phase (JCPDS 75-1539), respectively.32,33 The (002) peak, detected in the grown MoS2, indicates well-stacked layers along the (002) direction.31 A wide diffraction peak is also observed at 2θ = 24.3 degrees, which is explained by the (002) plane of graphene layers corresponding to d-spacing of about 0.34 nm.22,24,25 The peak (002) of MoS2 gradually decreases and, finally, disappears in MoS2/rGO composites with increasing rGO/MoS2 ratio. This indicates a reduction of MoS2 in the structure stacked along the c-axis to the MoS2 monolayer in composites with a high GO/TAA ratio (TAA![[thin space (1/6-em)]](https://www.rsc.org/images/entities/char_2009.gif) :
:![[thin space (1/6-em)]](https://www.rsc.org/images/entities/char_2009.gif) GO = 1
GO = 1![[thin space (1/6-em)]](https://www.rsc.org/images/entities/char_2009.gif) :
:![[thin space (1/6-em)]](https://www.rsc.org/images/entities/char_2009.gif) 3).
3).
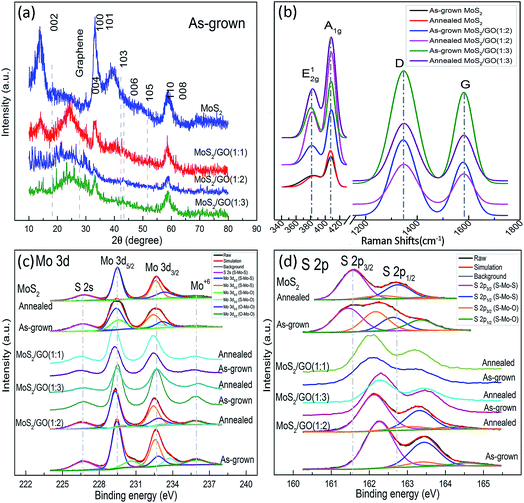 | ||
| Fig. 2 XRD patterns (a), Raman (b) and XPS (c, d) spectra of MoS2/rGO with different MoS2/GO ratios for Mo 3d (c) and S 2p (d). | ||
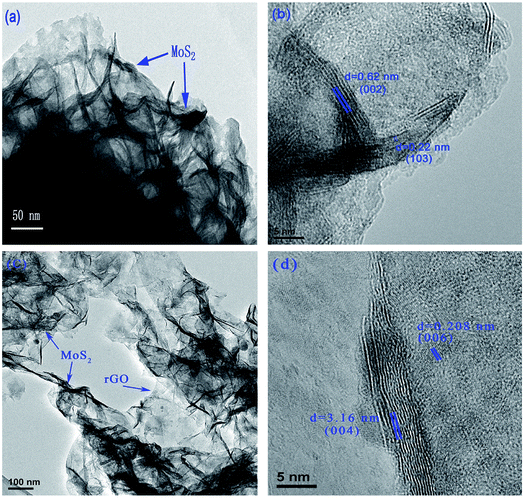
The composites were also examined using high-resolution transmission electron microscopy (HRTEM). Typical HRTEM images of the MoS2 and MoS2/rGO composite (1![[thin space (1/6-em)]](https://www.rsc.org/images/entities/char_2009.gif) :
:![[thin space (1/6-em)]](https://www.rsc.org/images/entities/char_2009.gif) 2) are shown in Fig. 3. MoS2 is well-stacked into more than 5 layers with interlayer distances of 0.62 and 0.22 nm, which are consistent with (002) and (103) 2H-MoS2 planes, respectively. However, the MoS2/rGO composite (1
2) are shown in Fig. 3. MoS2 is well-stacked into more than 5 layers with interlayer distances of 0.62 and 0.22 nm, which are consistent with (002) and (103) 2H-MoS2 planes, respectively. However, the MoS2/rGO composite (1![[thin space (1/6-em)]](https://www.rsc.org/images/entities/char_2009.gif) :
:![[thin space (1/6-em)]](https://www.rsc.org/images/entities/char_2009.gif) 2) shows self-assembling 1–2 layers of MoS2 on the rGO. The distances between the MoS2 layers of 0.316 and 0.208 nm correspond to the (004) and (006) planes, respectively.
2) shows self-assembling 1–2 layers of MoS2 on the rGO. The distances between the MoS2 layers of 0.316 and 0.208 nm correspond to the (004) and (006) planes, respectively.
Raman spectra of the nanocomposites (Fig. 2(b) and S2†) show the peaks at ∼382 and ∼405 cm−1, which correspond to E12g and A1g modes of H-MoS2 and characterize the vibration of sulfides in the in-planar and the vertical-plane in the c-axis directions, respectively.15,32,34 Two additional peaks at ∼1345 and ∼1578 cm−1 are assigned to the D and G bands of the rGO, which are attributed to the phonon vibration on defects and the sublattice A against the sublattice B (E2g symmetry) in the graphitic layers,35 respectively, confirming the coexistence of the rGO and MoS2 in the composites.36,37 The Raman features of the samples are summarized in Table 1 and S1.† In addition to the blue-shift of the E12g and red-shift of the A1g, intriguing degenerate characteristics in full width at half maximum (FWHM) and striking down-shifting of area ratio of E12g and A1g modes (IE/IA) of MoS2 were observed with increasing GO. This can be attributed to weak van der Waals forces between the adjacent layers, a decrease in the restoring forces in the vertical direction, the long-range Coulomb interlayer interactions and stacking-induced changes of the intralayer bonding.34 Elevated temperature of annealing also can effect on crystal reconstruction, intralayer bonding and lattice dynamics. The thickness of MoS2 layers can be quantitatively confirmed by shifting of E12g and A1g modes in frequency (ΔE).14,34 The values of ΔE decrease with decreasing TAA/GO ratio, which are in good agreement with the data of XRD and HRTEM confirming that the one two layer MoS2 is self-organizes on rGO. Shifting the G and D bands for composites with increasing GO, could be caused by the stabilizing sulfide in the hydrothermal process and the interaction between MoS2 and rGO (Table S2†). The intensity ratio G and D (IG/ID), used as a factor in determining the quality of the graphene-like material is in the range from 0.5 to 0.6, indicating significant lattice distortions after the reduction of GO in the hydrothermal process. After annealing, the IG/ID ratio is increased by further reducing the GO.
| Specimen | XPS (at%) | Raman (cm−1) | ||||||
|---|---|---|---|---|---|---|---|---|
| S/Mo | S–Mo–S | S–Mo–O | O–Mo–O | IE/IA | ΔE | IG/ID | ||
| MoS2 | As-grown | 1.5 | 69.7 | 18.6 | 11.7 | 1.18 | 26.5 | — |
| Annealed | 2.1 | 61.1 | 1.2 | 21.9 | 0.97 | 26.2 | — | |
MoS2/rGO (1![[thin space (1/6-em)]](https://www.rsc.org/images/entities/char_2009.gif) : :![[thin space (1/6-em)]](https://www.rsc.org/images/entities/char_2009.gif) 1) 1) |
As-grown | 1.4 | 72.8 | 9.3 | 17.9 | 1.01 | 24.7 | 0.6 |
| Annealed | 1.5 | 75.0 | 5.9 | 19.1 | 0.83 | 23.2 | 0.5 | |
MoS2/rGO (1![[thin space (1/6-em)]](https://www.rsc.org/images/entities/char_2009.gif) : :![[thin space (1/6-em)]](https://www.rsc.org/images/entities/char_2009.gif) 2) 2) |
As-grown | 1.5 | 64.8 | 17.1 | 18.1 | 0.87 | 22.5 | 0.6 |
| Annealed | 1.6 | 72.7 | 5.5 | 21.8 | 0.64 | 21.9 | 0.6 | |
MoS2/rGO (1![[thin space (1/6-em)]](https://www.rsc.org/images/entities/char_2009.gif) : :![[thin space (1/6-em)]](https://www.rsc.org/images/entities/char_2009.gif) 3) 3) |
As-grown | 1.3 | 58.6 | 12.3 | 29.1 | 0.8 | 21.8 | 0.6 |
| Annealed | 1.8 | 59.3 | 5.3 | 35.4 | 0.66 | 21.4 | 0.6 | |
The XPS spectra of Mo 3d and S 2p (Fig. 2(c) and (d)) show the peaks centered at ∼229.3 and ∼232.5 eV, which correspond to the doublet of Mo 3d5/2 and Mo 3d3/2, and reveal that typical Mo4+ state is predominant in prepared samples. A slight amount of Mo6+ (∼236.0 eV) state still appears and increases with addition of GO, which is due to the oxidization of MoS2 by oxygen resulted from reduction of GO. The Mo 3d5/2 peak can be divided into three peaks centered at 229, 230, and 232 eV, corresponding to Mo in S–Mo–S, S–Mo–O, and O–Mo–O, respectively. The XPS spectra of S display the binding energy at 226.4, 162.1, and 163.3 eV, which are assigned as S 2s, S 2p3/2 and S 2p1/2, respectively. The S 2p3/2 peak can be divided into two peaks centered at 162 and 163 eV, corresponding to S–Mo–S and S–Mo–O bonds (Table 1 and S2†). Reduced GO plays a role of a scalable precursor platform for adjusting the synthesis conditions for the self-assembly of MoS2 layers in GO. Properly used amount of rGO increases the intensity of the S–Mo–S bands. At high oxygen concentration the intensities of the S–Mo–S bands decrease, which results in indicating a lower yield of MoS2. The C 1s spectra prove the process of reducing the GO supplying oxygen (Fig. S3b and Table S3†). After annealing, the intensities of O–Mo–O and S–Mo–O bands increased and decreased, respectively, while the intensities of the S–Mo–S bands changed slightly, which can be explained by a phase transition from Mo2SxO1−x to MoO3. Annealing improved the quality of the crystals and removed the reaction residues. The atomic ratio of S and Mo after annealing of composites was in the range from 1.5 to 2.1.
The mechanism of formation of the self-assembled MoS2/rGO composite is illustrated in Fig. 4. Cations (CSNH2)+ (as TA+) are adsorbed onto the surface of GO sheets during the mixing process and ultrasonic treatment through strong electrostatic forces, resulting in the changing the GO charge to positive. Positive charge sheets of GO ensure overcoming the repulsion of the charges between GO and MoO42−. Thus, a suspension of positively charged sheets of GO with adsorbed TA+ was obtained. When Na2MoO4·2H2O is added to the resulting solution, MoO42− can be adsorbed on the TA+–GO single sheets surface to reconstitute the MoO42−–TA+–GO sheet complex.38,39 The hydrothermal process results in the GO being reduced to rGO, forming a self-assembled MoS2/rGO composite.
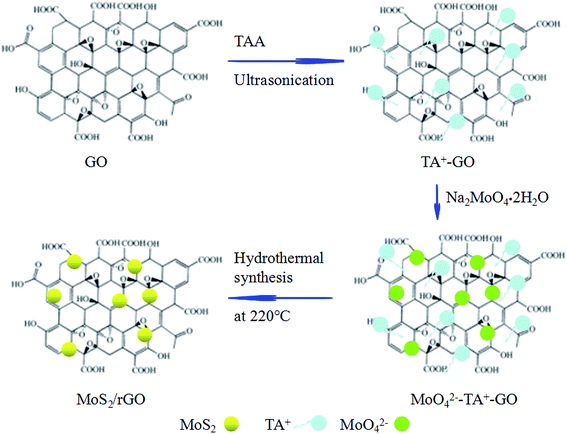 | ||
| Fig. 4 Schematic illustration of the formation of a self-assembled MoS2/rGO composite by sonication-assisted hydrothermal method. | ||
Control of the degree of reduction of graphene oxide allows the creation of super lattices structures with quantum confinement of electrons. Reduction of graphene oxide to rGO with a small band gap (<1.3 eV) would confined the electrons in rGO between the layers of molybdenum disulfide Eg = 1.3 eV. Reducing GO to rGO with a bandgap larger than the bandgap of a single layer of molybdenum disulfide (1.8 eV) or its multilayers (1.3 eV), leads to localization of electrons in the layers of molybdenum disulfide. Nanocomposites with tunnel barriers may form local super lattices with different bandgap. Thus, the size effect can adjust the wavelengths of absorption of the nanocomposite.
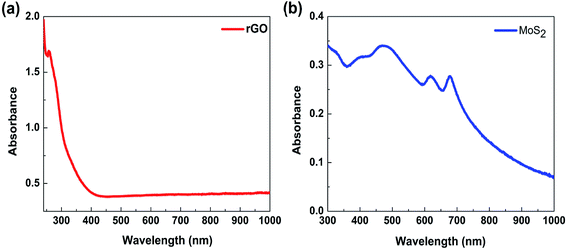
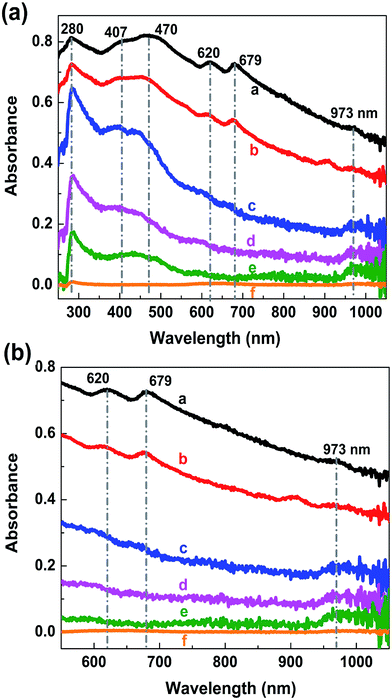
To confirm the tunability of the optical properties of the MoS2/rGO nanocomposite, UV absorption spectroscopy was used. The absorption spectrum of rGO shows a peak at about 280 nm, which originates from the π–π* transitions in the aromatic C–C bonds of the reduced graphene oxide40–42 (Fig. 5a). The MoS2 absorption spectrum shows four characteristics peaks of around 400–500 nm and 600–700 nm (Fig. 5b). The peaks at 608 and 670 nm corresponds to the exciton peaks of the MoS2 arising from the K point of the Brillouin zone.43 The peaks at 405 and 452 nm indicate a reduction in the 2H phase of MoS2.44 The absorption spectra of MoS2/rGO composites obtained at different formation conditions show six characteristic peaks located at 250–300 nm, 400–500 nm, 600–700 nm and 973 nm (Fig. 6a). It is interesting to note that in the case of MoS2/rGO nanocomposites, the peak at 280 nm associated with rGO red-shifts to 285 nm gradually with increasing centrifugation rate, indicating an increase in the π-electron concentration with reduction of sp3 graphene oxide to sp2-hybridization of carbon atoms.40–42 For a smaller size of nanocrystals, the self-assembly process results in a more efficient reduction of GO due to possible charge transfer in MoS2/rGO nanocomposites. In addition, with increasing the centrifugation speed the exciton peaks related to MoS2 at around 679 nm and 620 nm show a blue shift followed by a decrease in intensity. This behavior in good agreement with the quantum confinement effect,45 since the size of MoS2 decreases with increasing centrifugation speed. Interestingly, the absorption spectra of the nanocomposites showed the peak of about 973 nm (1.27 eV), which could be related to the strongly reduced GO (G). This peak is also blue shifted with increasing centrifugation speed and can be explained by the quantum confinement effect in G quantum dots. The obtained results show that the absorption of the MoS2/rGO nanocomposites can be adjusted over a wide range from ultraviolet to infrared light by using differently reduced GO and MoS2 flakes of various sizes and thickness. MoS2/GO nanocomposites with a wide adjustable absorption of light have a great potential for their use in high performance multi-band solar cells and advanced photonics.46
Conclusions
MoS2/rGO nanocomposites were synthesized using ultrasonic pretreatment with a single-stage hydrothermal and reduction process. Self-assembled MoS2 single layers in the rGO matrix were obtained. The nanocomposites, controlled by the degree of reduction of graphene oxide and the size of MoS2 nanocrystals, exibit tunable optical absorption in a wide UV-IR wavelength range from 280 nm to 973 nm.Conflicts of interest
There are no conflicts to declare.Acknowledgements
This work was supported by the National Natural Science Foundation of China under grant 11405117, the International Program of the Ministry of Science and Technology of China under grant 2015DFR00720 and the National Research Foundation (NRF) of Korea grant funded by the Korea government (MSIP) (No. 2015-066177) and under the framework of international cooperation program managed by NRF of Korea (No. 2015K2A1C2067880 and S-2015-A0173-00005), as well as by Basic Science Research Program through NRF funded by the Ministry of Education (No. 2017R1D1A1B03035102) and the Russian Foundation for Basic Research (RFBR No. 16-33-60229).Notes and references
- K. S. Novoselov, A. K. Geim, S. V. Morozov, D. Jiang, Y. Zhang, S. V. Dubonos, I. V. Grigorieva and A. A. Firsov, Science, 2004, 306, 666–669 CrossRef CAS PubMed.
- J. W. Jiang, J. S. Wang and B. W. Li, Phys. Rev. B: Condens. Matter Mater. Phys., 2009, 80, 113405–113408 CrossRef.
- R. Murali, Y. Yang, K. Brenner, T. Beck and J. D. Meindl, Appl. Phys. Lett., 2009, 94, 243114–243116 CrossRef.
- A. A. Balandin, S. Ghosh, W. Bao, I. Calizo, D. Teweldebrhan, F. Miao and C. N. Lau, Nano Lett., 2008, 8, 902–907 CrossRef CAS PubMed.
- D. E. Sheehy and J. Schmalian, Phys. Rev. B: Condens. Matter Mater. Phys., 2009, 80, 193411–193414 CrossRef.
- F. Schwierz, Nat. Nanotechnol., 2010, 5, 487–496 CrossRef CAS PubMed.
- C. R. Dean, A. F. Young, I. Meric, C. Lee, L. Wang, S. Sorgenfrei, K. Watanabe, T. Taniguchi, P. Kim, K. L. Shepard and J. Hone, Nat. Nanotechnol., 2010, 5, 722–726 CrossRef CAS PubMed.
- F. Bonaccorso, Z. Sun, T. Hasan and A. C. Ferrari, Graphene Photonics and Optoelectronics, Nat. Photonics, 2010, 4, 611–622 CrossRef CAS.
- N. M. Gabor, J. C. W. Song, Q. Ma, N. L. Nair, T. Taychatanapat, K. Watanabe, T. Taniguchi, L. S. Levitov and P. Jarillo-Herrero, Science, 2011, 334, 648–652 CrossRef CAS PubMed.
- Y. Zhu, S. Murali, M. D. Stoller, K. J. Ganesh, W. Cai, P. J. Ferreira, A. Pirkle, R. M. Wallace, K. A. Cychosz, M. Thommes, D. Su, E. A. Stach and R. S. Ruoff, Science, 2011, 332, 1537–1541 CrossRef CAS PubMed.
- Y. Sun, Q. Wu and G. Shi, Energy Environ. Sci., 2011, 4, 1113–1132 CAS.
- Q. Xiang, J. Yu and M. Jaroniec, Chem. Soc. Rev., 2012, 41, 782–796 RSC.
- J. D. Fowler, M. J. Allen, V. C. Tung, Y. Yang, R. B. Kaner and B. H. Weiller, ACS Nano, 2009, 3, 301–306 CrossRef CAS PubMed.
- Q. H. Wang, K. Kalantar-Zadeh, A. Kis, J. N. Coleman and M. S. Strano, Nat. Nanotechnol., 2012, 7, 699–712 CrossRef CAS PubMed.
- A. Castellanos-Gomez, M. Poot, G. A. Steele, H. S. J. van der Zant, N. Agraït and G. Rubio-Bollinger, Adv. Mater., 2012, 24, 772–775 CrossRef CAS PubMed.
- S. Bertolazzi, J. Brivio and A. Kis, ACS Nano, 2011, 5, 9703–9709 CrossRef CAS PubMed.
- J.-W. Jiang, Z. Qi, H. S. Park and T. Rabczuk, Nanotechnology, 2013, 24, 435705–43570711 CrossRef PubMed.
- A. M. Seayad and D. M. Antonelli, Adv. Mater., 2004, 16(910), 765–777 CrossRef CAS.
- J. Chen, N. Kuriyama, H. Yuan, H. T. Takeshita and T. Sakai, J. Am. Chem. Soc., 2001, 123, 11813–11814 CrossRef CAS PubMed.
- W. Zhou, Z. Yin, Y. Du, X. Huang, Z. Zeng, Z. Fan, H. Liu, J. Wang and H. Zhang, Small, 2013, 9, 140–147 CrossRef CAS PubMed.
- M.-L. Tsai, S.-H. Su, J.-K. Chang, D.-S. Tsai, C.-H. Chen, C.-I. Wu, L.-J. Li, L.-J. Chen and J.-H. He, ACS Nano, 2014, 8, 8317–8322 CrossRef CAS PubMed.
- K. Zhang, H.-J. Kim, X. Shi, J.-T. Lee, J.-M. Choi, M.-S. Song and J. H. Park, Inorg. Chem., 2013, 52, 9807–9812 CrossRef CAS PubMed.
- K. Chang and W. Chen, ACS Nano, 2011, 5, 4720–4728 CrossRef CAS PubMed.
- K. Chang and W. Chen, Chem. Commun., 2011, 47, 4252–4254 RSC.
- K. Chang, W. Chen, L. Ma, H. Li, H. Li, F. Huang, Z. Xu, Q. Zhang and J.-Y. Lee, J. Mater. Chem., 2011, 21, 6251–6257 RSC.
- A. K. Geim and I. V. Grigorieva, Nature, 2013, 499, 419–425 CrossRef CAS PubMed.
- H. Tao, K. Yanagisawa, C. Zhang, T. Ueda, A. Onda, N. Li, T. Shou, S. Kamiya and J. Tao, CrystEngComm, 2012, 14, 3027–3032 RSC.
- C. Altavilla, M. Sarno and P. Ciambelli, Chem. Mater., 2011, 23, 3879–3885 CrossRef CAS.
- D. C. Marcano, D. V. Kosynkin, J. M. Berlin, A. Sinitskii, Z. Sun, A. Slesarev, L. B. Alemany, W. Lu and J. M. Tour, ACS Nano, 2010, 4, 4806–4814 CrossRef CAS PubMed.
- G. N. Panin, O. O. Kapitanova, S. W. Lee, A. N. Baranov and T. W. Kang, Jpn. J. Appl. Phys., 2011, 50, 070110–070115 CrossRef.
- Z. Wang, T. Chen, W. Chen, K. Chang, L. Ma, G. Huang, D. Chen and J. Y. Lee, J. Mater. Chem. A, 2013, 1, 2202–2210 CAS.
- K.-K. Liu, W. Zhang, Y.-H. Lee, Y.-C. Lin, M.-T. Chang, C.-Y. Su, C.-S. Chang, H. Li, Y. Shi, H. Zhang, C.-S. Lai and L.-J. Li, Nano Lett., 2012, 12, 1538–1544 CrossRef CAS PubMed.
- I. Zafiropoulou, M. S. Katsiotis, N. Boukos, M. A. Karakassides, S. Stephen, V. Tzitzios, M. Fardis, R. V. Vladea, S. M. Alhassan and G. Papavassiliou, J. Phys. Chem. C, 2013, 117, 10135–10142 CAS.
- C. Lee, H. Yan, L. E. Brus, T. F. Heinz, J. Hone and S. Ryu, ACS Nano, 2010, 4, 2695–2700 CrossRef CAS PubMed.
- L. M. Malard, M. A. Pimenta, G. Dresselhaus and M. S. Dresselhaus, Phys. Rep., 2009, 473, 51–87 CrossRef CAS.
- A. C. Ferrari, J. C. Meyer, V. Scardaci, C. Casiraghi, M. Lazzeri, F. Mauri, S. Piscanec, D. Jiang, K. S. Novoselov, S. Roth and A. K. Geim, Phys. Rev. Lett., 2006, 97, 187401–187404 CrossRef CAS PubMed.
- M. A. Pimenta, G. Dresselhaus, M. S. Dresselhaus, L. G. Cançado, A. Jorio and R. Saito, Phys. Chem. Chem. Phys., 2007, 9, 1276–1290 RSC.
- X. C. Dong, X. W. Wang, J. Wang, H. Song, X. G. Li, L. H. Wang, M. B. Chan-Park, C. M. Li and P. Chen, Carbon, 2012, 50, 4865–4870 CrossRef CAS.
- X. Wang, Q. Wang, Q. Wang, F. Gao, F. Gao, Y. Yang and H. Guo, ACS Appl. Mater. Interfaces, 2014, 6, 11573–11580 CAS.
- R. Ortega-Amaya, Y. Matsumoto, A. Flores-Conde, M. A. Pérez-Guzmán and M. Ortega-López, Mater. Res. Express, 2016, 3, 105601–105608 CrossRef.
- J. Shang, L. Ma, J. Li, W. Ai, T. Yu and G. G. Gurzadyan, Sci. Rep., 2012, 2, 792–799 CrossRef PubMed.
- O. Akhavan, E. Ghaderi, S. Aghayee, Y. Fereydooni and A. Talebi, J. Mater. Chem., 2012, 22, 13773–13781 RSC.
- Y. Yao, L. Tolentino, Z. Yang, X. Song, W. Zhang, Y. Chen and C.-P. Wong, Adv. Funct. Mater., 2013, 23, 3577–3583 CrossRef CAS.
- G. Eda, H. Yamaguchi, D. Voiry, T. Fujita, M. Chen and M. Chhowalla, Nano Lett., 2011, 11, 5111–5116 CrossRef CAS PubMed.
- Z. X. Gan, L. Z. Liu, H. Y. Wu, Y. L. Hao, Y. Shan, X. L. Wu and P. K. Chu, Appl. Phys. Lett., 2015, 106, 233113–233117 CrossRef.
- X. Fu, P. IIlanchezhiyan, G. M. Kumar, H. D. Cho, L. Zhang, A. S. Chan, D. J. Lee, G. N. Panin and T. W. Kang, Nanoscale, 2017, 9, 1820–1826 RSC.
Footnote |
| † Electronic supplementary information (ESI) available. See DOI: 10.1039/c7ra12455d |
| This journal is © The Royal Society of Chemistry 2018 |

