 Open Access Article
Creative Commons Attribution 3.0 Unported Licence
Simultaneous removal of tetracycline and Cu(II) by adsorption and coadsorption using oxidized activated carbon
Qingdong Qina,
Xian Wua,
Liwei Chenb,
Zhongshuai Jianga and
Yan Xu *a
*a
aSchool of Civil Engineering, Southeast University, Nanjing 210096, China. E-mail: xuxucalmm@seu.edu.cn; Fax: +86 25 83790757; Tel: +86 25 83790757
bCollege of Biology and the Environment, Nanjing Forestry University, Nanjing 210037, China
First published on 8th January 2018
Abstract
Co-contamination of antibiotics and heavy metals prevails in the environment. To overcome the obstacle of low metal uptake on activated carbon and to achieve simultaneous removal of tetracycline (TC) and Cu(II) from water, coconut shell based granular activated carbon (GAC) treated with nitric acid was utilized. GAC property characterization showed that oxidation treatment distinctly decreased the surface area of GAC and significantly increased the content of oxygen containing functional groups. The oxidized GAC exhibited greater adsorption capacity for individual TC and Cu(II). Kinetics studies demonstrated that although the overall removal rate of coexisting TC and Cu(II) decreased, the ultimate removal efficiency was further enhanced in the binary system. The adsorption isotherms were well described by Langmuir and Freundlich models. Moreover, the maximum adsorption capacities of coexisting TC and Cu(II) with oxidized GAC kept increasing within a pH range of 3.0–6.0, indicating an electrostatic repulsion mechanism as well as a competition for adsorption sites. Fourier transform infrared spectroscopy (FTIR) and X-ray photoelectron spectroscopy (XPS) analysis revealed that the enhanced removal of TC and Cu(II) was very likely as a result of coadsorption by forming TC–Cu(II) complexes bridging between the adsorbate and the adsorbent.
1. Introduction
Tetracycline antibiotics (TCs), such as tetracycline (TC), oxytetracycline (OTC), and chlorotetracycline (CTC) are widely used in livestock feeding operations and in disease control for humans and animals.1 It is reported that only a small portion of TCs is used in metabolism, 50–80% of the parental compounds are excreted through the feces and urine. As a result, TC residues are frequently detected in aquatic environments.2 Moreover, heavy metals have been commonly used in various chemical industries such as plating, mining and smelting, electroplating industries and petroleum refining.3,4 Also, natural water is polluted by heavy metals along with the discharge of industrial wastewater. Therefore, the coexistence of TCs and heavy metals is observed in the environment.5–7 This has led to great concern due to their increased stability and toxicity.6,8–10 For example, a long-term exposure to antibiotics and/or heavy metals causes the occurrence and spread of resistance genes.8 Most recently, a significant increase in TC resistance was found in the presence of environmentally relevant levels of Cu.11 Thus, the treatment of polluted aqueous effluents for simultaneous removal of TCs and heavy metals is crucial for water pollution control and ecological risk management.To date, a variety of processes or methods have been widely employed for the removal of antibiotics or heavy metals from wastewater.2,3 Among the treatment options applied, considerable attentions have been paid to adsorption technology as an effective and simple separation process. Many materials are used as adsorbents, such as carbon adsorbents, clay and minerals, metal oxides and chitosan.2,3,12 As a most commonly used adsorbent, activated carbon is expected to have a high capacity for the removal of TCs due to its high specific surface area, abundant pore structures, and strong interactions. However, it has a relatively low adsorption capacity for the removal of heavy metals. The possible reason is the limited numbers of targeted functional groups such as –COOH, –OH, –NH2, –SH and –SO3H on the surface of activated carbon.13–15 Therefore, to improve the adsorption capacity for heavy metals, modification of activated carbon has been proposed.16
It has been shown that heavy metals adsorption by activated carbon greatly relies upon surface acidity and special surface functionality, where the removal mechanisms may comprise of electrostatic interaction, ion exchange and coordination to functional groups.17,18 A common technique to improve heavy metals adsorption is through chemical oxidation, which is able to introduce a variety of acidic surface functional groups on the surface of activated carbon.19 A variety of oxidizing agents such as HNO3, H2O2, (NH4)2S2O8, KMnO4, and NaOCl have been widely utilized.20,21 Among them, HNO3 is the most frequently used one, as its oxidizing specifications can be easily controlled by concentration and temperature. During oxidation, surface characteristics of activated carbon are altered due to the introduction of new functional groups such as carboxylic, phenolics, lactones and carbonyl, which can ultimately increase the adsorption capacity for heavy metal ions.22
So far not much is known about the interactions between TCs and heavy metals in binary system and the literature on adsorption process mainly focus on mono-component solutions.2,3 The presence of multiple pollutants in the same solution may significantly affect the removal performance of the adsorbent.6,23,24 The interaction between TCs and adsorbents may vary in the presence of heavy metals as well as the presence of TCs may change the behavior of heavy metals toward adsorbent. It has been reported that heavy metal ions and antibiotics could form ternary surface complexes, either through the adsorption of metal–ligand aqueous complexes by electrostatic forces (outer–sphere complexes), or through the formation of inner sphere structures.6,23,25 However, to the best knowledge of the authors, the shifts of the adsorption behaviors of TCs and heavy metals on granular activated carbon (GAC) remain unknown.
In this work, we chose TC and Cu(II) as common representatives of antibiotics and heavy metals, respectively. The ultimate goal of the present study was to simultaneously remove TC and Cu(II) from water. To achieve this objective, GAC was oxidized by nitric acid, and the influences of several operating parameters such as contact time, initial contaminant concentration and pH on the removal of TC and Cu(II) were comprehensively investigated. Fourier transform infrared spectroscopy (FTIR) and X-ray photoelectron spectroscopy (XPS) of oxidized GAC before and after adsorption were also performed to identify the possible adsorption mechanisms. The improved performance of GAC in uptaking TC and Cu(II) and the adsorption and coadsorption mechanisms can provide more insights of complex pollution treatment in aquatic systems.
2. Materials and methods
2.1. Materials
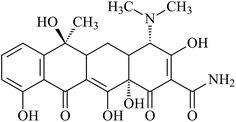
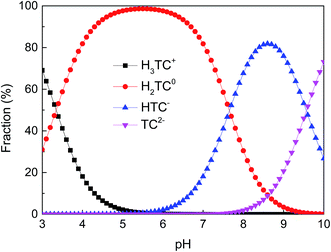
Tetracycline hydrochloride (TC, 95%, w/w) was purchased from Sigma-Aldrich and its molecular structure is shown in Fig. 1. It has multiple ionizable functional groups, including a dimethylammonium, a tricarbonylamide group and a phenolic diketone group, which exists three pKa values of 3.3, 7.7 and 9.7.26 Therefore, due to protonation or deprotonation reactions, it shows different ionic species in different pH values, as depicted in Fig. 2.All other chemicals (analytical grade) used in the study were purchased from Sigma-Aldrich and used without further purification. All solutions were prepared using 18 MΩ deionized H2O at neutral pH (Millipore, USA).
Coconut shell based granular activated carbon (GAC) kindly provided by Osaka Gas Chemicals Japan was used in this study. The particle size of GAC was 0.4–0.8 mm. The original GAC was washed by deionized water to an invariable pH value and desiccated at 378 K for 24 h. The oxidation of GAC was carried out as follows: 100 mL of a concentrated nitric acid solution (10 mol L−1) was introduced into a 250 mL flask and heated to 363 K using a constant temperature thermal bath device with condenser. Then 5 g of original GAC was immersed into the boiling nitric acid for 12 h. The modified GAC was washed with deionized water until to neutral pH and dried at 378 K for 24 h. Finally, it was designated as GACox.
2.2. Characterization
Prior to characterization, GAC and GACox were dried at 105 °C for 24 h to remove the adsorbed moisture and were kept sealed under dry air in a desiccator. The surface acidic functional groups and acidic/basic sites were determined by Boehm titrations as described previously.27 The pH of the point of zero charge (pHpzc) of samples was established using a method suggested by Noh and Schwarz.28 Nitrogen adsorption–desorption isotherms were measured at 77 K on a Micromeritics ASAP 2020 sorptometer following the manufacture's introduction. Prior to measurement, the samples were outgassed for 16 h at 110 °C and 10−6 Torr. FTIR spectra were performed on the Spectrum One spectrometer from 400 to 4000 cm−1 by dried KBr pellet. XPS of the above mentioned samples were recorded on a spectrometer (Perkin-Elmer PHI-5300/ESCA, USA) with an Al Kα X-ray source. All the binding energies were referenced to the neutral C 1s peak at 284.6 eV to compensate for the surface charging effects. The XPS results were collected as binding energy forms and fitted using a curve-fitting program following the data analysis guide of XPSPEAK41 software.2.3. Adsorption experiments
The effect of contact time on TC and Cu(II) adsorption onto adsorbent was examined at pH 4.0. The adsorption experiments were carried out by mixing 0.1 g of adsorbent with a 250 mL aqueous solution in a 500 mL stirred flask at a temperature of 25 °C. Samples were periodically withdrawn to determine the residual concentrations of TC and Cu(II) in the solution. The volume of each sample was 1 mL, and the total variation of the solution volume due to sampling was less than 6.0%.The adsorption percentages of TC and Cu(II) were calculated by the differences of initial and final concentrations using the equation expressed as follow:
 | (1) |
The adsorption isotherm experiments of TC and Cu(II) were performed using a batch experiment. In brief, 0.02 g of adsorbent was placed in a 100 mL flask, into which 50 mL of adsorbate solution with varying initial concentrations were added. The experiments were performed in a temperature-controlled water bath shaker for eight days (time to reach equilibrium) at a mixing speed of 180 rpm. When the equilibrium was thought to be established, the solutions were filtered and analyzed for the remaining concentration of adsorbate. Solid-phase adsorbate concentrations at equilibrium, qe (mg g−1), were calculated according to eqn (2):
 | (2) |
The effect of solution pH on adsorbate adsorption was investigated according to the following procedure. In brief, 0.02 g of GACox was added to a series of 100 mL flasks each containing 50 mL of adsorbate solution. The solution pH was adjusted to a pH range from 3.0 to 6.0 using 0.1 mol L−1 HCl or 0.1 mol L−1 NaOH solutions. NaNO3 (0.01 mol L−1) was used to keep constant ionic strength. The flasks were then sealed and placed in the shaker at 25 °C with a speed of 150 rpm for eight days. Unless stated otherwise, all experiments were performed in duplicate.
2.4. Analytical method
Aqueous TC concentration was determined by a reversed phase High Performance Liquid Chromatography (HPLC) (Waters, USA) equipped with UV-visible detection at the wavelength of 360 nm, using a symmetry C18 column (4.6 × 150 mm, 5 μm spheres, Waters). The injection volume was 20 μL and the mobile phase was a mixture of methanol–water containing 0.01 mol L−1 oxalic acid at a flow rate of 1 mL min−1. Due to the presence of relatively high concentration of oxalic acid, Cu(II) could not affect the UV absorption of TC. Moreover, it should be pointed out that no apparent peaks were detected in the HPLC spectra for potential degraded/transformed products of TC. The residual concentration of Cu(II) in the solution was determined by inductively coupled plasma mass spectrometry (ICP-MS) method.3. Results and discussion
3.1. Characterization of GAC and GACox
The textural and chemical characteristics of the carbon samples are given in Table 1. The oxidation treatment significantly decreased the specific surface area of the original GAC and almost completely destroyed the pore structure, which can be attributed to erosion and blockage of pores by degradation products produced during chemical reaction.16 Similar results were also found by other researchers using concentrated nitric acid to modify GAC.29 The elemental composition obtained from the XPS analysis showed a significant increase in oxygen content between the original and modified GAC. This is directly related to the increase in oxygen containing surface groups that was confirmed by acid/base titration. As a result, the pHpzc value of GAC changed from 7.4 to less than 5.8, which is favored for adsorption of heavy metals under neutral pH.| GACs | SBET (m2 g−1) | XPS (atom based) (%) | Acidic groups (mmol g−1) | Basic groups (mmol g−1) | pHpzc | Micropore area (m2 g−1) | External surface area (m2 g−1) | ||
|---|---|---|---|---|---|---|---|---|---|
| C | N | O | |||||||
| GAC | 1392 | 95.19 | 0.58 | 4.23 | 0.25 | 0.39 | 7.4 | 930 | 461 |
| GACox | 48 | 80.76 | 1.62 | 17.61 | 1.07 | 0.82 | 5.8 | 40 | 8 |
3.2. Adsorption study
Adsorption of individual TC and Cu(II) on GAC with and without oxidization is shown in Fig. 3. It is observed that the amount of the TC or Cu(II) adsorbed by GACox was much greater than that of the raw GAC. Notably, the amount of the Cu(II) adsorbed by GACox was approximately one order of magnitude higher than that of raw GAC, which was mainly due to the increased content of acidic surface functional groups on the surface of GAC after oxidization. It was proposed that more content of acidic surface functional groups could reduce the pHpzc (Table 1).16 At experimental pH 4.0, the surface of raw GAC was expected to be dominantly positive-charged, which was not conducive to Cu(II) adsorption due to electrostatic repulsion. Although the surface of GACox was also positive-charged, the content of acidic surface functional groups in GACox was significantly higher than that in GAC, which favored Cu(II) adsorption. Similar results were also observed by other researchers using oxidized activated carbon to remove heave metals.14 Therefore, GACox was used in the following adsorption experiment.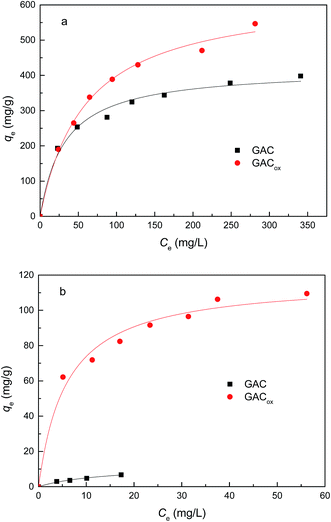 | ||
| Fig. 3 Adsorption of TC (a) and Cu(II) (b) by GACs (adsorbent dosage = 0.4 g L−1, T = 25 °C, pH = 4.0). | ||
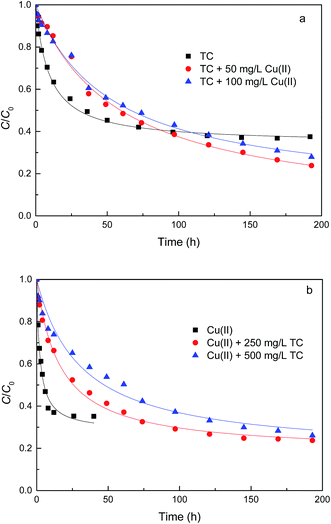 | ||
| Fig. 4 Effect of contact time on TC (a) and Cu(II) (b) removal by GACox (adsorbent dosage = 0.4 g L−1, T = 25 °C, pH = 4.0). | ||
In order to estimate the rate of TC and Cu(II) adsorption on GACox, adsorption rate constants were determined by fitting the experimental adsorption kinetics data to first-order and second-order kinetic models, respectively.30,31
The pseudo-first-order kinetic model is given as follows:
| qt = qe(1 − e−k1t) | (3) |
The above equation can also be expressed in terms of C by using the mass balance equation at time t as follows:
 | (4) |
 | (5) |
The pseudo-second-order kinetic model is expressed by the following equation:
 | (6) |
This equation can be also formulated in terms of C, yielding the following equation:
 | (7) |
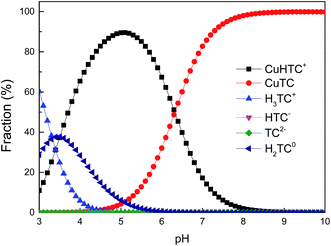
The results from fitting experimental data with pseudo-first and pseudo-second-order models are presented in Table 2. It is clear to see that adsorption rate could be fitted well using both two kinetic models (evidenced from the correlation coefficients, >0.970). The k1 and k2 values decreased significantly in the presence of TC or Cu(II), indicating the increase of resistance to mass transfer. The possible reason might be competition adsorption and steric effect. Given that TC and Cu(II) can be both adsorbed by GACox, they may compete with each other for space and/or sites on GACox, resulting in a decrease of adsorption rate. Moreover, TC and Cu(II) could form complexes in the binary system. The complexation constants (log![[thin space (1/6-em)]](https://www.rsc.org/images/entities/char_2009.gif) K) of TC with Cu(II) were −0.6 and −7.3 and the speciation distributions of TC complexation with Cu(II) are shown in Fig. 5.26 It can been seen that approximately 65.4% of the TC forms CuHTC+ with Cu(II) at pH 4.0, which leads to the increasing of molecular size and forms pore blockage and finally reduces the adsorption rate. These results provide more insights in the design of an adsorption column, as the adsorption rate in the binary system is significantly slower than that in the single system.
K) of TC with Cu(II) were −0.6 and −7.3 and the speciation distributions of TC complexation with Cu(II) are shown in Fig. 5.26 It can been seen that approximately 65.4% of the TC forms CuHTC+ with Cu(II) at pH 4.0, which leads to the increasing of molecular size and forms pore blockage and finally reduces the adsorption rate. These results provide more insights in the design of an adsorption column, as the adsorption rate in the binary system is significantly slower than that in the single system.
| Adsorbate | Coexisting compound | Pseudo-first-order model | Pseudo-second-order model | ||
|---|---|---|---|---|---|
| k1 (h−1) | R2 | k2 (g mg−1 × h) | R2 | ||
| TC | No | 0.058 | 0.979 | 0.065 | 0.994 |
| 50 mg L−1 Cu(II) | 0.018 | 0.994 | 0.007 | 0.993 | |
| 100 mg L−1 Cu(II) | 0.017 | 0.992 | 0.008 | 0.992 | |
| Cu(II) | No | 0.312 | 0.993 | 0.246 | 0.986 |
| 250 mg L−1 TC | 0.035 | 0.984 | 0.030 | 0.993 | |
| 500 mg L−1 TC | 0.019 | 0.980 | 0.016 | 0.974 | |
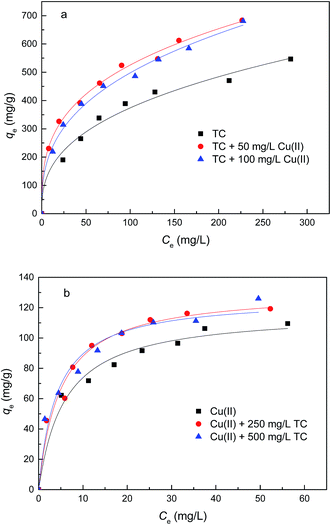 | ||
| Fig. 6 Adsorption isotherms of TC (a) and Cu(II) (b) on GACox (adsorbent dosage = 0.4 g L−1, T = 25 °C, pH = 4.0). | ||
In order to describe the adsorption isotherms, two most important isotherms were used in this study, the Langmuir and Freundlich isotherms:
 | (8) |
| qe = KFCe1/n | (9) |
| Adsorbate | Coexisting compound | Langmuir model | Freundlich model | ||||
|---|---|---|---|---|---|---|---|
| Q0 (mg g−1) | KL (L mg−1) | R2 | KF | 1/n | R2 | ||
| TC | No | 634.0 | 0.017 | 0.993 | 67.4 | 0.37 | 0.961 |
| 50 mg L−1 Cu(II) | 691.1 | 0.040 | 0.956 | 122.9 | 0.32 | 0.991 | |
| 100 mg L−1 Cu(II) | 714.8 | 0.028 | 0.970 | 97.0 | 0.36 | 0.988 | |
| Cu(II) | No | 117.4 | 0.169 | 0.980 | 40.4 | 0.25 | 0.971 |
| 250 mg L−1 TC | 131.4 | 0.203 | 0.977 | 43.9 | 0.27 | 0.906 | |
| 500 mg L−1 TC | 126.8 | 0.240 | 0.963 | 43.8 | 0.27 | 0.979 | |
To compare the performance of GACox with other adsorbents, the adsorption capacities for organic pollutants and heavy metals found in binary system are summarized in Table 4. Comparative values of Q0 clearly suggested that GACox exhibited excellent adsorption for TC and relatively high adsorption for Cu(II). These results indicate that GACox can serve as a potential adsorbent for the simultaneous removal of TC and Cu(II) from contaminated water.
| Adsorbents | pH | T (°C) | Q0 (mg g−1) | References | |
|---|---|---|---|---|---|
| Organic pollutants | Heavy metals | ||||
| a Abbreviations in this table: CIP, ciprofloxacin. | |||||
| GACox | 4.0 | 25 | 714.8 (TC) | 126.8 (Cu(II)) | This work |
| Chitosan | 5.0 | 25 | 41.4 (TC) | 95.1 (Cu(II)) | 32 |
| Chelating resin | 5.0 | 25 | 107.1 (TC) | 128.4 (Cu(II)) | 33 |
| Activated carbon | 6.0 | 25 | 442.5 (CIP) | 4.7 (Ni(II)) | 34 |
| Bifunctional resin | 5.0 | 20 | 230.1 (TC) | 38.2 (Cu(II)) | 25 |
| Fe–N,N-SBA15 | 5.5 | 25 | 49.9 (TC) | 36.0 (Cu(II)) | 24 |
| MMIC-Fe(III) | 8.0 | 25 | 516.3 (TC) | 194.3 (Cd(II)) | 12 |
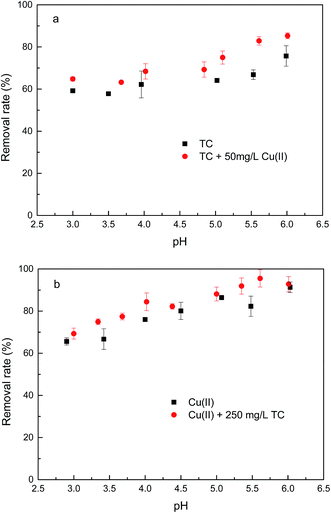
As seen in Fig. 7a, the removal of TC in the absence of Cu(II) went up with increasing pH up to 6.0. At pH 6.0, the removal of TC achieved 75.7%. At the pH below 6.0, the low removal efficiencies were mainly due to a repulsive force prevailing between the cationic species of TC in solution and the positively charged surface of GACox, and/or a competition between H+ ions and the cationic species of TC for binding sites on the surface of GACox. When the pH increased from 3.0 to 6.0, most of TC existed as zwitterionic species (Fig. 2). Thus, the adsorption of TC on GACox increased along with the decreased electrostatic repulsion between TC and the positively charged surface of GACox. When Cu(II) was coexisted in the solution, the removal of TC slightly increased in the pH range of 3.0–6.0. The removal of TC in the presence of Cu(II) reached 85.3% at pH 6.0. Seen in Fig. 5, the predominant TC species is CuHTC+ at pH values between 4.0 and 6.0. Meanwhile, the surface of GACox was positively charged at pH < 5.8. Therefore, it is expected that the removal of TC in the presence of Cu(II) should be lower than that in the absence of Cu(II) due to electrostatic repulsion. However, the observed removal of TC even slightly increased in the presence of Cu(II). This phenomenon was possibly due to the complexation of TC with the adsorbed Cu(II), that was, through formation of a GACox–Cu(II)–TC ternary complex.7
As seen in Fig. 7b, the removal of Cu(II) in the absence of TC with an increase of pH from 3.0 to 6.0 raised from 65.6% to 91.3%. At pH values below the onset of Cu(II) precipitation, the variations in adsorbed amount with pH could be explained on the basis of the number of negatively charged sites on the surface of GACox. As pH increased, more and more H+ ions tended to leave the GACox surface resulting in more negatively charged sites available, which favored Cu(II) adsorption due to the reduced electrostatic repulsion. Hence, positively charged Cu(II) ions will ion exchange and/or complex with oxygenated surface functional groups at pH values in the range 3.0–6.0. In the presence of TC, TC was found to favor Cu(II) adsorption at pH < 6.0. The role of TC on Cu(II) adsorption may incorporate several different mechanisms: (1) enhanced adsorption by forming ternary surface complexes, (2) reduced Cu(II) adsorption due to competition between the surface ligands and the TC ligands for Cu(II), and (3) competition between TC and Cu(II) for surface sites.6 Therefore, the reason for the enhanced Cu(II) adsorption was most likely due to Cu(II) adsorption onto GACox surface through complexation of Cu(II) with the adsorbed TC to form a GACox–TC–Cu(II) ternary complex. Additionally, in the pH range of 3.0–6.0, Cu(II) can complex with H2TC0 to form CuHTC+ species (Fig. 5), which helps to decrease the number of positively charged Cu(II) and reduce electrostatic repulsion between Cu(II) and the positively charged surface of GACox and ultimately enhances the Cu(II) adsorption on GACox.
3.3. FTIR and XPS analysis
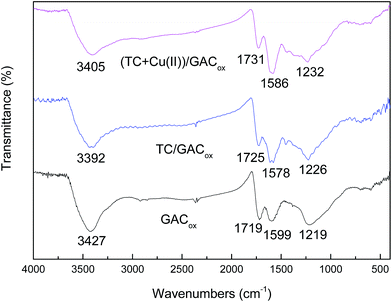
The FTIR spectra of GACox before and after adsorption are shown in Fig. 8. In the case of pure GACox, the spectrum exhibited the absorption bands at 3427, 1719, 1599 and 1219 cm−1. The broadened band around 3427 cm−1 can be assigned to the bending vibration of adsorbed molecular water and stretching vibration of hydroxyl group. The peak at 1719 cm−1 was attributed to the stretching vibration of C![[double bond, length as m-dash]](https://www.rsc.org/images/entities/char_e001.gif) O in ketones, lactones, and carboxyl groups.35,36 The peak at 1599 cm−1 was ascribed to aromatic ring stretching vibration.35,36 The broadened band around 1219 cm−1 was usually attributed to a C–O bond.35 It can be seen that the peaks at 1719, 1599 and 1219 cm−1 shifted after TC adsorption. This suggests that these groups participate in the formation of a coordination complex with TC. When TC and Cu(II) were adsorbed on GACox simultaneously, the observed FTIR spectra were different from those observed in the absence of Cu(II), indicating that Cu(II) adsorption can take place on the sites where TC was specifically adsorbed. It has been reported that the main mechanism of adsorption of TC by activated carbon including hydrogen bonding, electron donor–acceptor, and π–π dispersion interaction between the aromatic ring of three antibiotics and the delocalized π electrons present in GACox.2 The Cu(II) adsorption is mainly due to the formation of metal surface complex with hydroxyl and carboxylic groups on the surface of GACox.16,22 Seen in Fig. 8, when TC and TC/Cu(II) were adsorbed on GACox, the peak at 1599 cm−1 ascribed to aromatic ring stretching vibration was shifted to 1578 cm−1 and 1586 cm−1, respectively. These shifts indicate that TC–Cu(II) complexes can be coadsorbed by GACox.
O in ketones, lactones, and carboxyl groups.35,36 The peak at 1599 cm−1 was ascribed to aromatic ring stretching vibration.35,36 The broadened band around 1219 cm−1 was usually attributed to a C–O bond.35 It can be seen that the peaks at 1719, 1599 and 1219 cm−1 shifted after TC adsorption. This suggests that these groups participate in the formation of a coordination complex with TC. When TC and Cu(II) were adsorbed on GACox simultaneously, the observed FTIR spectra were different from those observed in the absence of Cu(II), indicating that Cu(II) adsorption can take place on the sites where TC was specifically adsorbed. It has been reported that the main mechanism of adsorption of TC by activated carbon including hydrogen bonding, electron donor–acceptor, and π–π dispersion interaction between the aromatic ring of three antibiotics and the delocalized π electrons present in GACox.2 The Cu(II) adsorption is mainly due to the formation of metal surface complex with hydroxyl and carboxylic groups on the surface of GACox.16,22 Seen in Fig. 8, when TC and TC/Cu(II) were adsorbed on GACox, the peak at 1599 cm−1 ascribed to aromatic ring stretching vibration was shifted to 1578 cm−1 and 1586 cm−1, respectively. These shifts indicate that TC–Cu(II) complexes can be coadsorbed by GACox.
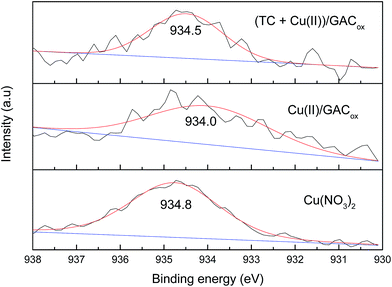
To gain further insight into the mechanism of adsorption and coadsorption onto GACox, high resolution XPS Cu 2p2/3 spectra were carefully analyzed (Fig. 9). The peak of binding energy for Cu(NO3)2 appeared at 934.8 eV (assigned to Cu 2p2/3). After adsorption by GACox, a remarkable shift to the low region (from 934.8 to 934.0 eV) was observed, indicating a specific interaction between Cu(II) and GACox. Furthermore, when TC was coexisted, the peak changed to 934.5 eV, suggesting that TC could directly affect the binding energy of Cu(II) due to complexation. These findings indicate that the enhanced adsorption of TC in the presence of Cu(II) and the enhanced adsorption of Cu(II) in the presence of TC both could be resulted from the formation of ternary complexes of GACox–Cu(II)–TC and GACox–TC–Cu(II) during adsorption.
4. Conclusions
The present study shows that the treatment by HNO3 significantly changed the physicochemical properties of GAC such as pHpzc, surface area and groups. Compared to raw GAC, GACox was able to adsorb significantly higher amounts of Cu(II) mainly due to the increased content of acidic surface functional groups on the surface of GACox. Kinetics studies demonstrated that the removal rate decreased by approximately 69% for TC and by 94% for Cu(II) in the binary system. The maximum adsorption capacity was 634.0 mg g−1 for TC and was 117.4 mg g−1 for Cu(II) in the single system. While, in binary system, the maximum adsorption capacity increased to 714.8 mg g−1 for TC and 131.4 mg g−1 for Cu(II). Moreover, overall adsorption of coexisting TC and Cu(II) by GACox went up within a pH range of 3.0–6.0. Batch experiments and FTIR and XPS analyses revealed that the enhanced adsorption of coexisting TC and Cu(II) might be due to the formation of TC–Cu(II) complex bridging between the adsorbate and the adsorbent. Compared to other adsorbents, GACox showed excellent adsorption for TC and relatively high adsorption for Cu(II) in binary system. These results suggest the considerable potential for the oxidized GAC as an adsorbent for the simultaneous removal of TC and Cu(II) from contaminated water.Conflicts of interest
There are no conflicts to declare.Acknowledgements
This work was supported by National Natural Science Foundation of China [51408119, 41671468 and 51408317], Key Programs of the Chinese Academy of Sciences [KFZD-SW-309], National Science Foundation of the Higher Education Institutions of Jiangsu Province of China [14KJB610006] and Priority Academic Program Development of Jiangsu Higher Education Institutions (PAPD). The authors would like to thank Analytical Center of NIGLAS for making this study possible by making laboratory facilities available.References
- A. K. Sarmah, M. T. Meyer and A. B. A. Boxall, Chemosphere, 2006, 65, 725–759 CrossRef CAS PubMed.
- M. B. Ahmed, J. L. Zhou, H. H. Ngo and W. S. Guo, Sci. Total Environ., 2015, 532, 112–126 CrossRef CAS PubMed.
- M. K. Uddin, Chem. Eng. J., 2017, 308, 438–462 CrossRef CAS.
- P. Z. Ray and H. J. Shipley, RSC Adv., 2015, 5, 29885–29907 RSC.
- Y. Vystavna, P. Le Coustumer and F. Huneau, Environ. Monit. Assess., 2013, 185, 3581–3601 CrossRef CAS PubMed.
- Y. J. Wang, D. A. Jia, R. J. Sun, H. W. Zhu and D. M. Zhou, Environ. Sci. Technol., 2008, 42, 3254–3259 CrossRef CAS PubMed.
- D. A. Jia, D. M. Zhou, Y. J. Wang, H. W. Zhu and J. L. Chen, Geoderma, 2008, 146, 224–230 CrossRef CAS.
- Y. Zhang, X. Y. Cai, X. M. Lang, X. L. Qiao, X. H. Li and J. W. Chen, Environ. Pollut., 2012, 166, 48–56 CrossRef CAS PubMed.
- R. C. Tuckfield and J. V. McArthur, Microb. Ecol., 2008, 55, 595–607 CrossRef CAS PubMed.
- J. Berg, M. K. Thorsen, P. E. Holm, J. Jensen, O. Nybroe and K. K. Brandt, Environ. Sci. Technol., 2010, 44, 8724–8728 CrossRef CAS PubMed.
- J. X. Song, C. Rensing, P. E. Holm, M. Virta and K. K. Brandt, Environ. Sci. Technol., 2017, 51, 3040–3047 CrossRef CAS PubMed.
- A. W. Chen, C. Shang, J. H. Shao, Y. Q. Lin, S. Luo, J. C. Zhang, H. L. Huang, M. Lei and Q. R. Zeng, Carbohydr. Polym., 2017, 155, 19–27 CrossRef CAS PubMed.
- N. Li, X. L. Ma, Q. F. Zha, K. Kim, Y. S. Chen and C. S. Song, Carbon, 2011, 49, 5002–5013 CrossRef CAS.
- H. H. Cho, K. Wepasnick, B. A. Smith, F. K. Bangash, D. H. Fairbrother and W. P. Ball, Langmuir, 2010, 26, 967–981 CrossRef CAS PubMed.
- L. J. Xu and J. L. Wang, Appl. Catal., B, 2012, 123, 117–126 CrossRef.
- J. Rivera-Utrilla, M. Sanchez-Polo, V. Gomez-Serrano, P. M. Alvarez, M. C. M. Alvim-Ferraz and J. M. Dias, J. Hazard. Mater., 2011, 187, 1–23 CrossRef CAS PubMed.
- J. Rivera-Utrilla and M. Sanchez-Polo, Water Res., 2003, 37, 3335–3340 CrossRef CAS PubMed.
- C. Y. Yin, M. K. Aroua and W. Daud, Sep. Purif. Technol., 2007, 52, 403–415 CrossRef CAS.
- V. Strelko and D. J. Malik, J. Colloid Interface Sci., 2002, 250, 213–220 CrossRef CAS PubMed.
- B. K. Pradhan and N. K. Sandle, Carbon, 1999, 37, 1323–1332 CrossRef CAS.
- W. Daud and A. H. Houshamnd, J. Nat. Gas Chem., 2010, 19, 267–279 CrossRef CAS.
- J. P. Chen and S. N. Wu, Langmuir, 2004, 20, 2233–2242 CrossRef CAS PubMed.
- Z. G. Pei, X. Q. Shan, J. J. Kong, B. Wen and G. Owens, Environ. Sci. Technol., 2010, 44, 915–920 CrossRef CAS PubMed.
- Z. Y. Zhang, H. J. Liu, L. Y. Wu, H. C. Lan and J. H. Qu, Chemosphere, 2015, 138, 625–632 CrossRef CAS PubMed.
- Y. Ma, Q. Zhou, S. C. Zhou, W. Wang, J. Jin, J. W. Xie, A. M. Li and C. D. Shuang, Chem. Eng. J., 2014, 258, 26–33 CrossRef CAS.
- Y. P. Zhao, Y. Y. Tan, Y. Guo, X. Y. Gu, X. R. Wang and Y. Zhang, Environ. Pollut., 2013, 180, 206–213 CrossRef CAS PubMed.
- S. L. Goertzen, K. D. Theriault, A. M. Oickle, A. C. Tarasuk and H. A. Andreas, Carbon, 2010, 48, 1252–1261 CrossRef CAS.
- J. S. Noh and J. A. Schwarz, J. Colloid Interface Sci., 1989, 130, 157–164 CrossRef CAS.
- G. F. Liu, J. Ma, X. C. Li and Q. D. Qin, J. Hazard. Mater., 2009, 164, 1275–1280 CrossRef CAS PubMed.
- G. Blanchard, M. Maunaye and G. Martin, Water Res., 1984, 18, 1501–1507 CrossRef CAS.
- R. Ocampo-Perez, R. Leyua-Ramos, J. Rivera-Utrilla, J. V. Flores-Cano and M. Sanchez-Polo, Chem. Eng. Res. Des., 2015, 104, 579–588 CrossRef CAS.
- J. Kang, H. J. Liu, Y. M. Zheng, J. H. Qu and J. P. Chen, J. Colloid Interface Sci., 2010, 344, 117–125 CrossRef CAS PubMed.
- C. Ling, F. Q. Liu, C. Xu, T. P. Chen and A. M. Li, ACS Appl. Mater. Interfaces, 2013, 5, 11808–11817 CAS.
- Y. Y. Sun, Q. Y. Yue, B. Y. Gao, Y. Gao, X. Xu, Q. Li and Y. Wang, J. Taiwan Inst. Chem. Eng., 2014, 45, 681–688 CrossRef CAS.
- Y. P. Guo and D. A. Rockstraw, Carbon, 2006, 44, 1464–1475 CrossRef CAS.
- H. Demiral and C. Gungor, J. Cleaner Prod., 2016, 124, 103–113 CrossRef CAS.
| This journal is © The Royal Society of Chemistry 2018 |

