 Open Access Article
Adhesion strength of the cathode in lithium-ion batteries under combined tension/shear loadings
Hailing Luoab,
Juner Zhub,
Elham Sahraei bc and
Yong Xia
 *a
*a
aState Key Laboratory of Automotive Safety and Energy, Department of Automotive Engineering, Tsinghua University, Beijing, 100084, China. E-mail: xiayong@tsinghua.edu.cn; Tel: +86-10-62789421
bDepartment of Mechanical Engineering, Massachusetts Institute of Technology, 77 Massachusetts Ave, Cambridge, MA 02139, USA
cElectric Vehicle Safety Lab, The George Mason University, Nguyen Engineering Building, 4400 University Dr, Fairfax, VA 22030, USA
First published on 23rd January 2018
Abstract
To understand the failure mechanism and establish reliable deformation tolerances for lithium-ion batteries under mechanical loading, accurate testing and modeling of individual components are indispensable. This paper is focused on one of the most common failure scenarios, which is the de-bonding between the coating material and the current collector. A new specimen is carefully designed to measure the failure strength of the coating-foil interface. The electrode is bonded to two acrylic substrates using liquid formula glue for one side and gel formula glue for the other. Compared with conventional peeling tests using double-sided tape, the major advantage of this new specimen is that it realizes conducting shear tests. Using this special specimen, the failure strength of the coating-foil interface is obtained under combined tension/shear loadings. The new method is less susceptible to the testing conditions such as loading rate. For the cathode studied in this paper, the shear strength of the coating-foil interface turns out to be almost twice its tensile strength, which emphasizes the necessity of carrying out combined tension/shear loading tests. Moreover, a combined adhesion and cohesion failure mode is observed at the failure interface, where with larger shear component, the adhesion failure becomes dominant.
1. Introduction
Lithium-ion batteries have been widely deployed in powering consumer electronics, and now their application has been extended to large-scale transportation. In the automotive industry, high energy density and long cycle life are always the two most essential design objectives, while the safety issue is of equal importance. During the charge–discharge cycles, the active coatings of electrodes have to endure pronounced volume change. This periodic volume change induces an alternating internal stress, which may lead to initiation of cracks inside the active material coating as well as a delamination between the coating and the current collector if the adhesion strength is unsatisfactory. Such damage is irreversible and can result in capacity loss.1 Therefore, to ensure a long cycle life for the batteries, achieving and maintaining good adhesion conditions between active coatings and their interface with current collectors is very important.On the other hand, the application to Electric Vehicles (EV) has put the lithium-ion batteries into a tougher situation – they may undergo large mechanical deformation that result in damage due to complicated external loads and intrusions during vehicle operations. It remains a big challenge to estimate the risk of failure of the batteries during a vehicle crash. Both experimental and numerical efforts have been made to investigate the fracture mechanisms of batteries under mechanical abuse loadings.2–9 Based on careful and precise characterizations of the properties of the components of the cells, developing a finite element (FE) model covering the details of the jellyroll can largely help analyze and predict the damage evolution inside the batteries. Among those characterizations at the component level, the mechanical properties of various interfaces inside the multi-layered structure of jellyroll, e.g. the interface adhesion strength, have not been studied so far. These forces are important as they can significantly affect the global and local mechanical responses of the batteries subjected to external loads. Therefore, for modeling, it is necessary to develop appropriate approaches to measure the adhesion strength of electrode and to predict adhesive failure at the interface between the coating and the current collector.
Peel test is a conventional method in battery industry for ranking the adhesion strength of electrodes, which separates the active material coating from the current collector using bond tapes. Park, et al.10 and Lee, et al.11 applied the peel test with bond tapes to evaluate the electrodes with various binders and constituents, and demonstrated that polyvinyl alcohol (PVA) binder or certain additives like poly (acrylic acid) (PAA) could enhance the adhesion strength of the anode. However, the measurement of such peel test is highly influenced by the additional adhesion introduced by the bond tapes. The strength of bond tape is determined by the surface quality of the active material coatings, unless a very strong bond tape such as the so-called VHB (Very High Bond) tape is used. Many other test procedures have been established for the purpose of measuring the adhesion strength of electrodes. Son, et al.12 managed to measure the peel strength at a specific depth to the surface of the active coating on a device named the Surface and Interfacial Cutting and Analysis System (SAICAS). Scratch tests were carried out to estimate the adhesion strength of different interfaces (binder/binder, particle/binder and current collector/binder) inside electrodes.13 In situ testing technique could also be adopted to study the crack evolution of the electrodes.14 To directly measure the tensile strength (adhesion strength in normal direction) of the electrode, Haselrieder, et al.15 customized a pull-off test to separate active material coatings from current collectors under tensile loading with double-sided bond tapes. However, the test results in the aforementioned studies are difficult to be utilized straightforwardly, and the analyses cannot cover the complicated loading states that the interface experiences in realities.
In the present paper, a new test method is proposed to realize direct measurement of the adhesion strength of the electrode under a combined tension/shear loading for different stress states. Detailed descriptions of the specimen preparation and the testing procedures are presented and thereafter, test results of cathode electrodes are presented to demonstrate reliability of the method.
2. Experiments
2.1 Specimen preparation
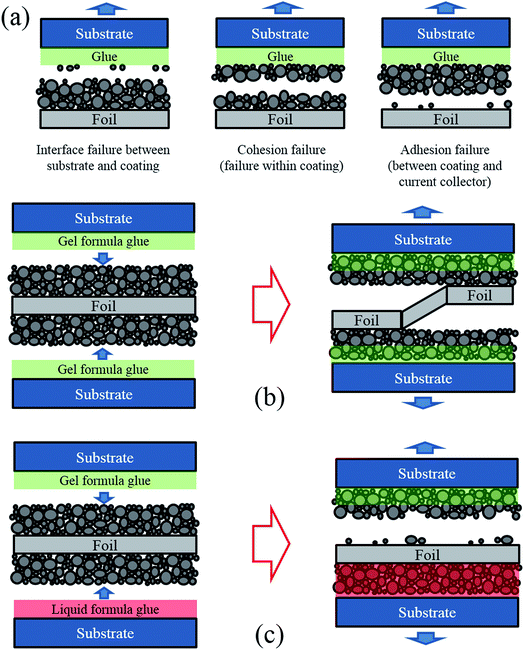
In this research a lithium–nickel–cobalt–oxide cathode from a commercial pouch cell without electrolyte (referred to as “dry cell”) was studied. From a mechanical point of view, it is a simple sandwich structure, consisting of two layers of porous active material coatings (the blend of active particles, binders and conductive additives) and one aluminum foil (the current collector) in between. Since the thickness of an electrode is less than 200 μm, it is difficult to directly apply boundary constraints or loads to such a thin layer in a mechanical test to measure its interface strength. Therefore, each side of the electrode was bonded to an acrylic substrate (see Fig. 1) for the convenience of clamping.In the multi-layered specimen, there are three critical cross-sections where fracture might happen, as shown in Fig. 1a. One is the interface between substrate and coating, second is the internal cross-section of coating, and the last one is the interface between coating and current collector. The failure scenarios that happen at the second and the third critical cross-sections are called “cohesion failure” and “adhesion failure”, respectively. The present work aims to investigate the adhesion strength between coating and current collector. Thus, fracture is expected to happen in the third cross-section, instead of the other two. The interface failure between substrate and electrode can be prevented by applying high bonding glue instead of conventional double-sided tape. For the other two cases, since the amount of binder decreases from the top surface of the coating to the bottom,16 the adhesion strength between the active material coating and the current collector is usually lower than the cohesion strength within the coating. Thus, the desired failure mode (fracture in the interface between coating and current collector) could be realized in experiments.
Moreover, the interface failure could randomly occur on either side of the electrode, or switch from one side to another, as shown in Fig. 1b. To control the failure only occurring at one side, we applied a liquid formula glue (Super Glue 15187, referred to as liquid glue in this paper) on one side of the electrode and a gel formula glue (Loctite Super Glue, referred to as gel glue in this paper) on the other side, to bond the electrode with the acrylic substrates, as shown in Fig. 1c. At the side with liquid glue, since the liquid glue permeates the entire thickness of the active material coating and enhances the original strength of both coating and coating-foil interface, both the coating material and the coating-foil interface were strengthened. At the other side with the gel glue, the gel formula glue only stays at the top of the porous coating material rather than permeating through the thickness. Thus, the original coating-foil interface remains intact. In this way, the coating-foil interface at the side with gel glue became the weakest location, making the failure occurrence and growth more controllable in the subsequent mechanical tests.
To validate the design of the specimen, dog-bone shaped cathode specimens were made using a razor blade and added glue, with two different strategies for comparison. The liquid glue and the gel glue were applied on one side of the cathode in Group A and Group B, respectively, while the other side of the cathode in each group were kept unstained. Then, tensile tests to fracture were performed on the specimens. Following the tests, the fracture cross sections were analyzed using SEM to identify the depth of the glue penetrating into the coating layer. As shown in Fig. 2a, for specimens of Group A, all the interspace between particles is filled with the liquid glue and delamination between coating and current collector is observed at the side where the liquid glue was applied. However, for specimens of Group B (Fig. 2b), less than half of the active material coating along the thickness direction is soaked with the gel glue. As shown with the morphology of Group B, the boundaries of the particles in the active material coating near the foil were kept as clear as those at the other side that were not subjected to any glue, while the boundaries of the particles close to the gel glue become blurry.
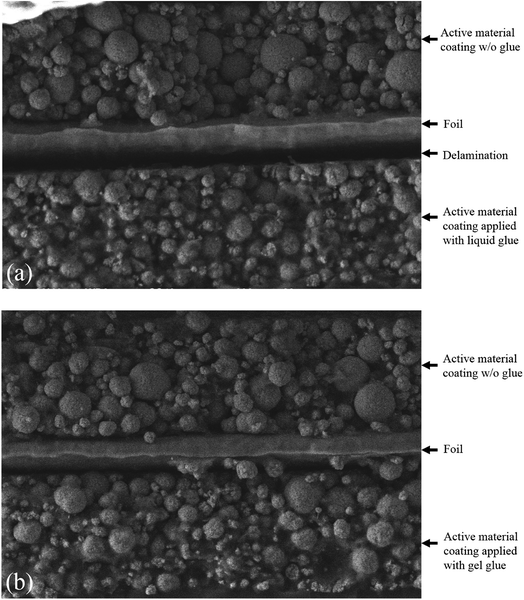 | ||
| Fig. 2 Cross-sectional view of cathode fractured in uniaxial tensile test: (a) electrode with liquid glue on one side, and (b) electrode with gel glue on one side. | ||
2.2 Setup of combined tensile and shear tests
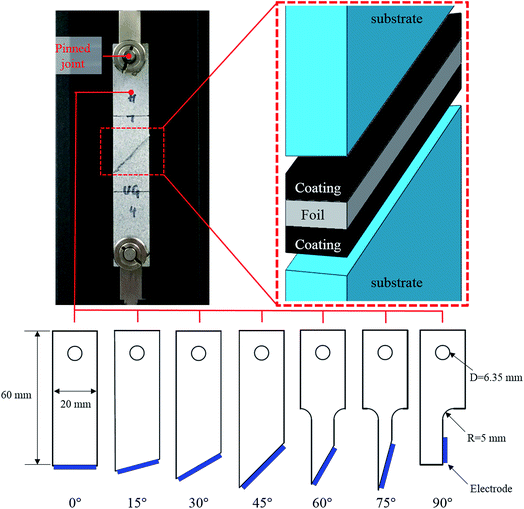
To explore the adhesion strength of electrode under different stress states, a series of combined tensile and shear tests were designed. Fig. 3 shows the test setup and the dimensions of the specimens. The clear cast acrylic sheet with a thickness of 4.45 mm was used as the substrate and the specimens were manufactured by laser cutting, following the designed shapes. For each specimen, the electrode was placed between two substrates (one on each side of the electrode) with a predefined angle to the axial direction, every 15° from 0° to 90°. For the 0° test, the electrode was loaded along the normal direction of the current collector, thus the tensile strength of the coating-foil interface was measured. As the tilt angle becomes larger, the shear component increases. For the 90° test, the loading direction is parallel to the current collector. Therefore, the strength value is determined by the shear strength of the failure interface. To minimize the bending moment that might exist on the electrode, the specimen is fixed by a pin–pin boundary. An Instron uniaxial tensile machine with 2 kN load cell was used to perform all the tests. The velocity of the cross head was 1.0 mm min−1 and each test was repeated 3 times.3. Results and discussion
3.1 Failure interface
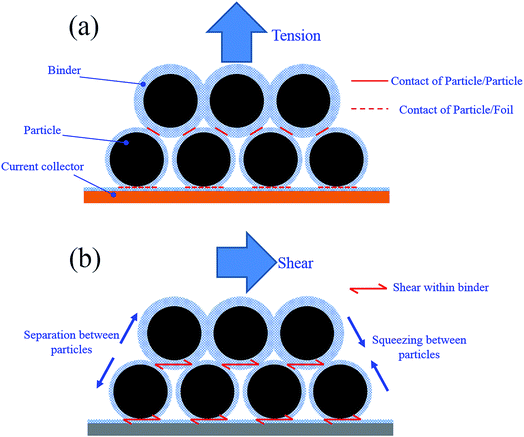
The failure interface of each specimen was examined using SEM. Fig. 4 shows the SEM images of failure surface (current collector side) of specimens from 0°, 45° and 90° tests. For all the specimens, failure occurred at the side with gel glue just as expected. However, a combined adhesion and cohesion failure mode is observed for all the specimens. From 0° to 90°, the percentage of adhesion failure mode increases. For 0° specimen, cohesion failure is the dominant failure mode that one layer of active particles still covers most part of the current collector and only a small portion of the current collector is visible. However, for 90° specimen, only a few particles remain bonded to the current collector and adhesion failure becomes dominant. According to ref. 16, there is less amount of binder on the surface of the particles close to the coating-foil interface. For all the specimens, adhesion failure on the coating-foil interface is supposed to be the dominant failure mode. However, in fact the feature of the particle stacking structure could lead to a certain difference between the results at different loading angles. As shown in Fig. 5a, the thickness of the binder coated on the particles on the bottom layer is thinner than other layers. However, the contact area between a particle and the surface of the current collector could be much larger than the contact area between a particle and the adjacent particles. Therefore, for 0° specimen, the effective adhesion strength of the coating-foil interface could be stronger than the cohesion strength between the bottom particle layer and the upper particle layer. That is why relatively large amount of particles remain on the surface of foil after 0° loading. When the specimen is loaded with larger proportion of shear component, the relative sliding between different particle layers leads to more squeezing between particles (shown in Fig. 5b). The resistant force caused by squeezing additionally contributes to the effective shear strength between particle layers. In the meantime, the shear strength of the coating-foil interface is only sustained by the binder itself. Therefore, the effective cohesion shear strength between particle layers could be larger than the adhesion shear strength of the coating-foil interface. That is why adhesion failure becomes dominant for 90° specimen.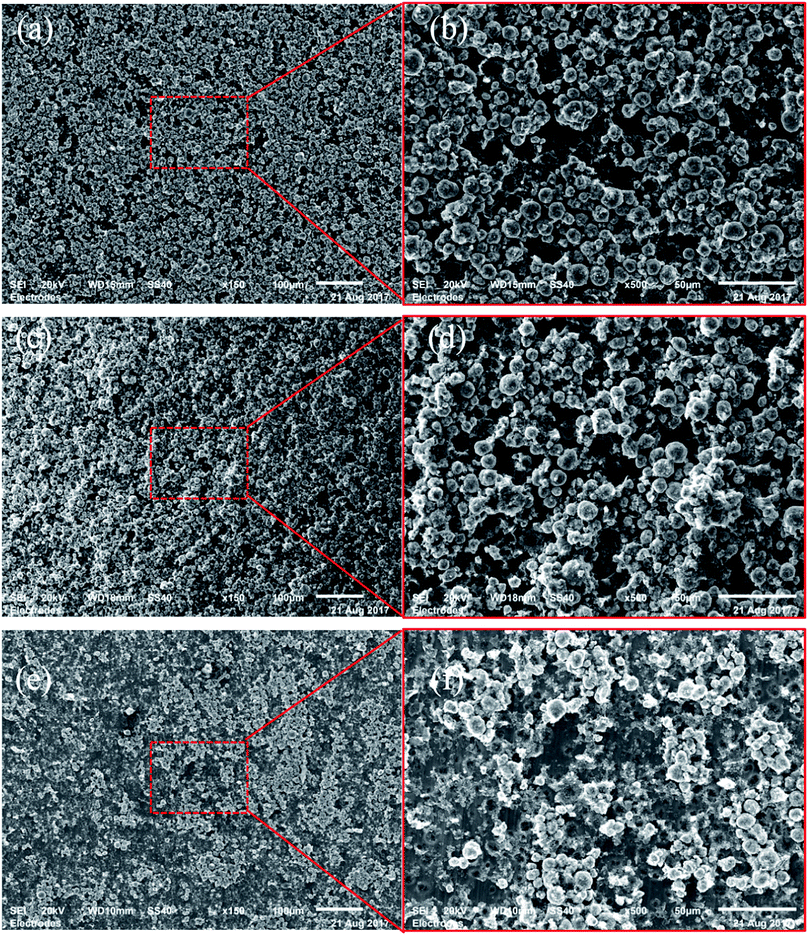 | ||
| Fig. 4 SEM images of the failure interface of specimens from (a), (b) 0°, (c), (d) 45° and (e), (f) 90° test. | ||
3.2 Adhesion strength under different stress state
For each type of the specimens, it is assumed that the stress distribution is uniform across the failure interface, so the effective adhesion strength could be calculated as following:| σμ = Ff/A | (1) |
σn = σμ![[thin space (1/6-em)]](https://www.rsc.org/images/entities/char_2009.gif) sin sin![[thin space (1/6-em)]](https://www.rsc.org/images/entities/char_2009.gif) θ θ
| (2) |
σS = σμ![[thin space (1/6-em)]](https://www.rsc.org/images/entities/char_2009.gif) cos cos![[thin space (1/6-em)]](https://www.rsc.org/images/entities/char_2009.gif) θ θ
| (3) |
 | (4) |
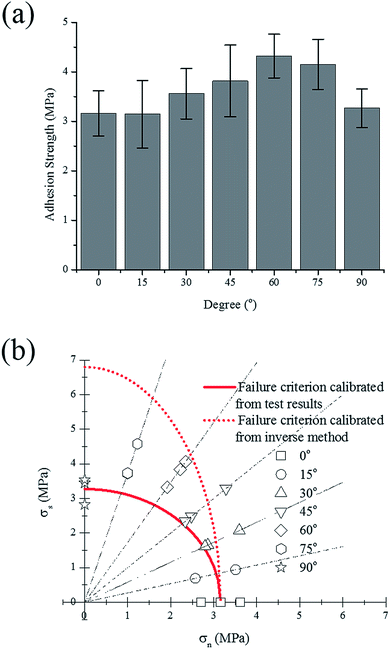 | ||
| Fig. 6 Test results of combined tensile-shear test, (a) adhesion strength and (b) tensile and shear component of each test. | ||
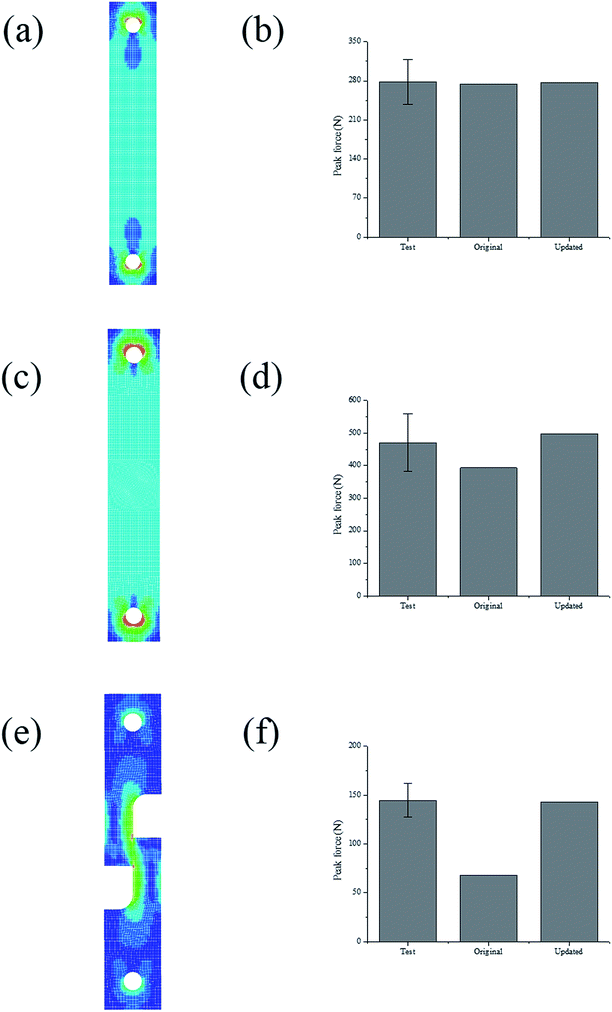
In order to refine the failure criterion of the coating-foil interface, explicit finite element (FE) models of the combined tensile and shear test (0°, 45°, and 90°) were established using LS-DYNA. Since the thickness of the electrodes is negligible compared with the sizes of the substrate, it is assumed that the neglecting the material property of the electrode would not change the stress distribution at the failure interface. For simplicity, only the substrate was modeled using elasto-plastic material model (MAT_Piecewise_Linear_Plasticity in LS-DYNA) with Young's modulus E = 3.1 GPa and Poisson's ratio ν = 0.3. The Young's modulus of the substrate was measured from uniaxial tensile test. A contact property (TIED_SURFACE_TO_SURFACE_FAILURE) was defined between two substrates to predict the adhesion failure, and failure occurs when the aforementioned quadratic failure criterion is met. First, the simulations were conducted with failure criterion calibrated from the test results. The peak forces from both simulation and test are plotted in Fig. 7(b), (d) and (f) for 0°, 45° and 90°, respectively. For 0°, the simulation result matches well with the test results. However, the simulation of 45° and 90° test underestimated the test results. The color-coded Von-Mises stress contours of each test at the moment right prior to fracture are also plotted in Fig. 7. The stress distribution across the failure interface is almost uniform for 0° and 45° test, while for 90° test, stress concentration could be identified at the edge of the failure interface. This stress concentration is mainly due to the asymmetry of the specimen. Since the assumption that stress distribution is uniform is no longer valid, the shear stress at failure should be recalibrated by inverse method. Thus, the shear strength (SFLS) in the failure criterion was tuned manually to match the peak force with test result in 90° test and the updated shear strength is 6.8 MPa. Again, the peak forces from simulations using the new set of parameters (NFLS = 3.16 MPa, SFLS = 6.8 MPa) are plotted in Fig. 7(b), (d) and (f), and a good agreement between simulation and test is achieved for each of the tests (0°, 45°, and 90° test). The failure criterion with the updated set of parameters is also plotted in Fig. 6b. The shear strength calibrated from inverse method is almost twice over the previous value. We also calculate the cohesion strength of the active material coating by subtracting the contribution of the current collector from the response of the entire electrode under uniaxial tensile test, this process has been described in ref. 3. The value calculated from this method is 8.0 MPa which is even larger than the shear strength obtained from the inverse method. Given the fact that the former one is mainly derived from the bulk material of the coating which usually has a higher failure strength than the foil-coating interface, this difference is still acceptable.
3.3 Comparison with double-sided tape
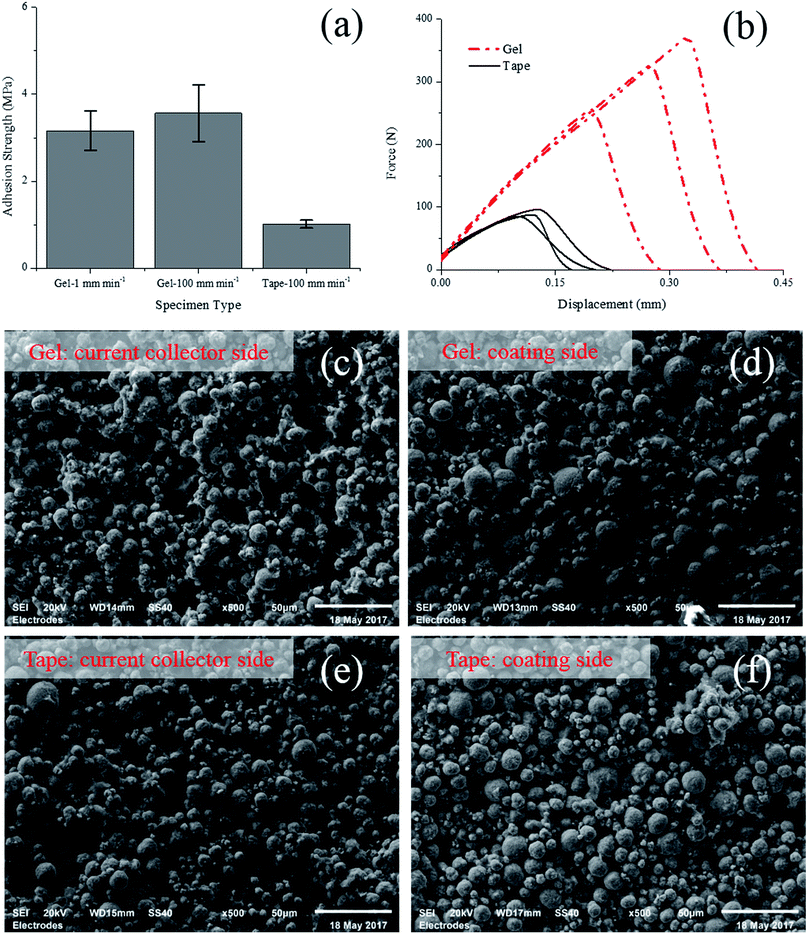
For comparison, a 0° test using double-sided adhesive tape (3M VHB 4950 foam tap) was also conducted. The gel formula glue was replaced with the tape, while the other side was still glued with the liquid formula glue. Besides 1 mm min−1, both specimens with gel glue and double-sided tape were also conducted under a higher rate (100 mm min−1) which is suggested by in ref. 15.As shown in Fig. 8a, under both 1 mm min−1 and 100 mm min−1, the tensile strengths derived from the specimens with gel formula glue are almost identical (3.16 MPa for 1 mm min−1 and 3.56 MPa for 100 mm min−1), showing no apparent strain rate effect. However, the results from the test with double-sided adhesive tape is significantly influenced by the test rate. For 1 mm min−1 test, the failure was progressive and no peak force could be identified on the force-displacement curves. For 100 mm min−1 test, the tensile strength determined from the peak force is roughly 1.0 MPa which is significantly lower than the value obtained from tests of specimen with gel formula glue. This difference is probably attributed to the deformation of the substrate which will largely affect the stress state inside the electrode. In particular, due to its larger thickness and lower stiffness compared with the electrode, the adhesive tape is subjected to large deformation during the test. The large deformation of substrate may result in a non-uniform stress distribution, i.e. significant stress concentration in the electrode. In contrast, the stiffness of the gel formula glue is quite high after curing, bringing less effect on the uniformity of stress distribution inside the electrode. As shown in Fig. 8b, the force versus displacement curves from tests of specimen with adhesive tape is always lower than those with gel formula glue. This difference in global response should be a direct result of the different stress distribution in the electrode. The SEM images of the fracture interface of specimens under 100 mm min−1 test are shown in Fig. 8, where a mixed failure mode is observed again and the cohesion failure is dominant. On the current collector side, most region of the foil is still covered by one layer of active particles, while most of the active particles remains staying on the coating side. In spite of the difference in test result of average strength, the morphology of the surfaces is almost identical, no matter the specimen was bonded with gel glue or double-sided tape.
4. Conclusion
A new test method has been specially designed to allow direct measurement of the adhesion strength of the electrodes. This new method has a major advantage over the conventional test methods with double-sided tape: the tests under large shear component could be conducted and the test results were less susceptible to the testing conditions such as loading rate. For the cathode studied in this paper, the strength results obtained from the inversed method indicated that the shear strength of the coating-foil interface is almost two times of its tensile strength. Moreover, a combined adhesion and cohesion failure mode was observed at the failure interface, where with larger shear component, the adhesion failure became dominant. While the tests were generally repeatable, a distribution of up to 25% was observed in the measured peak force. This will be improved in future extension of this research.Conflicts of interest
There are no conflicts of interest to declare.Acknowledgements
This study is supported by International Science & Technology Cooperation Program of China (contract No. 2016YFE0102200), National Natural Science Foundation of China (Grant No. 51675294 and No. U1564205), and the MIT Battery Modeling Consortium. A part of the technical work is also sponsored by Ford URP (University Research Program). Support of Altair Company with providing Hyperworks software for our research is greatly appreciated. H. L. thanks Mr Shaoting Lin of the MIT SAMs Lab for the help to cut the test samples. Dr Xiaowei Zhang is gratefully acknowledged for his constructive comments about the experimental work. Financial support provided by China Scholarship Council (CSC) during the visit of H. L. to MIT is acknowledged.References
- J. Vetter, P. Novák, M. Wagner, C. Veit, K.-C. Möller, J. Besenhard, M. Winter, M. Wohlfahrt-Mehrens, C. Vogler and A. Hammouche, J. Power Sources, 2005, 147, 269–281 CrossRef CAS
.
- E. Sahraei, M. Kahn, J. Meier and T. Wierzbicki, RSC Adv., 2015, 5, 80369–80380 RSC
.
- E. Sahraei, E. Bosco, B. Dixon and B. Lai, J. Power Sources, 2016, 319, 56–65 CrossRef CAS
.
- X. Zhang, E. Sahraei and K. Wang, Sci. Rep., 2016, 6, 32578 CrossRef CAS PubMed
.
- H. Wang, S. Simunovic, H. Maleki, J. N. Howard and J. A. Hallmark, J. Power Sources, 2016, 306, 424–430 CrossRef CAS
.
- H. Luo, Y. Xia and Q. Zhou, J. Power Sources, 2017, 357, 61–70 CrossRef CAS
.
- C. Zhang, J. Xu, L. Cao, Z. Wu and S. Santhanagopalan, J. Power Sources, 2017, 357, 126–137 CrossRef CAS
.
- J. Zhu, X. Zhang, E. Sahraei and T. Wierzbicki, J. Power Sources, 2016, 336, 332–340 CrossRef CAS
.
- J. Zhu, T. Wierzbicki and W. Li, J. Power Sources, 2018, 378, 153–168 CrossRef CAS
.
- H.-K. Park, B.-S. Kong and E.-S. Oh, Electrochem. Commun., 2011, 13, 1051–1053 CrossRef CAS
.
- J.-H. Lee, U. Paik, V. A. Hackley and Y.-M. Choi, J. Power Sources, 2006, 161, 612–616 CrossRef CAS
.
- B. Son, M.-H. Ryou, J. Choi, T. Lee, H. K. Yu, J. H. Kim and Y. M. Lee, ACS Appl. Mater. Interfaces, 2013, 6, 526–531 Search PubMed
.
- J. Chen, J. Liu, Y. Qi, T. Sun and X. Li, ACS Appl. Mater. Interfaces, 2013, 160, A1502–A1509 CAS
.
- M. B. Gorji and D. Mohr, Acta Mater., 2017, 131, 65–76 CrossRef CAS
.
- W. Haselrieder, B. Westphal, H. Bockholt, A. Diener, S. Höft and A. Kwade, Int. J. Adhes. Adhes., 2015, 60, 1–8 CrossRef CAS
.
- M. Müller, L. Pfaffmann, S. Jaiser, M. Baunach, V. Trouillet, F. Scheiba, P. Scharfer, W. Schabel and W. Bauer, J. Power Sources, 2017, 340, 1–5 CrossRef
.
- J. O. Hallquist, LS-DYNA theory manual, Livermore Software Technology Corporation, 2006 Search PubMed
.
| This journal is © The Royal Society of Chemistry 2018 |

