 Open Access Article
Creative Commons Attribution 3.0 Unported Licence
Thermal decomposition behavior and kinetics for pyrolysis and catalytic pyrolysis of Douglas fir
Lu Wang *ab,
Hanwu Lei*b,
Jian Liua and
Quan Buc
aSchool of Biological and Medical Engineering, Hefei University of Technology, Hefei 230009, China. E-mail: wanglu@hfut.edu.cn; Tel: +86-551-62901331
bBioproducts, Sciences and Engineering Laboratory, Department of Biological Systems Engineering, Washington State University, Richland, WA 99354-1671, USA. E-mail: hlei@tricity.wsu.edu; Fax: +1-509-372-7690; Tel: +1-509-372-7628
cInstitute of Agricultural Engineering, Jiangsu University, Zhenjiang 212013, China
First published on 9th January 2018
Abstract
In this study, the thermal decomposition behavior and kinetics of pyrolysis and catalytic pyrolysis of Douglas fir (DF) were investigated using thermogravimetric (TG) analysis. It was found that the heating rate was an important factor during the biomass pyrolysis process, it affected the pyrolysis though heat transfer and mass transfer through the biomass particles. The differential thermogravimetric (DTG) curves demonstrated that the role of the catalyst was to slightly reduce the temperature of biomass thermal degradation. We obtained the thermal data including the activation energy, frequency factor and reaction order by Coats–Redfern and Friedman methods. For the Coats–Redfern method, we found that the activation energy of the catalytic pyrolysis was lower than that of the non-catalytic pyrolysis. It means that the ZSM-5 catalyst increased the rate of reaction and reduced the energy required for the decomposition process. Meanwhile, the result from the Friedman method demonstrated that the reaction could be divided into two steps, which were reaction rate between 0.2 and 0.7 and a reaction rate of 0.8 based on parallelism. Addition of the ZSM-5 catalyst reduced the activation energy in the first region then increased it in the second region due to the secondary cracking of intermediate compounds which was highly affected by shape-selective catalysis. Simulation of pyrolysis and catalytic pyrolysis of DF using the obtained kinetic parameters was in good agreement with the experimental data. Py-GC/MS analysis was also carried out and indicated that the ZSM-5 catalyst had a highly positive effect on aromatic hydrocarbon production by significantly reducing oxygen-containing compounds (i.e. acids, esters, ketones/aldehydes and guaiacols) during the catalytic pyrolysis of DF.
1. Introduction
Due to its abundance and low cost, biomass has been realized as one of the most significant sustainable alternatives to petroleum fuels. Pyrolysis conversion is one of the most promising methods that can directly convert biomass into liquid fuels called bio-oils, which runs at 350–600 °C in the absence of oxygen.1 It draws much attention because of its short residence time,2 easy separation of products,2 and wide range of feedstock3,4 compared to other methods. Bio-oil is a complex mixture of sugars, esters, furans, acids, ketones, alcohols, phenols, guaiacols, and so on.5 It has high oxygen content and is acidic, viscous, reactive, and thermally unstable, and thus cannot be directly used in engines or traditional refineries. It has been found that the oxygen content of bio-oils is usually 35–40%, which is one of the most significant differences between bio-oils and petroleum fuels.6,7 The high oxygen content therefore makes the bio-oils incompatible with the existing petroleum-derived oils.8In order to use bio-oil for transport fuel application, upgrading technologies by using cracking catalyst on pyrolysis vapors are of interest to reduce the oxygen contents via dehydration and decarboxylation reactions and also obtain higher hydrocarbon in bio-oil.9 Catalytic fast pyrolysis is a modified fast pyrolysis method to produce aromatic hydrocarbons such as benzene, toluene, and xylenes by pyrolyzing biomass in the presence of catalyst.10,11 The influence of the catalyst was to convert the oxygen in the pyrolysis oil to H2O, CO and CO2. For example, the bio-oil yield was markedly reduced in the presence of ZSM-5 zeolite catalyst, while the oxygen content of the bio-oil reduced when the rice husks were pyrolyzed with the catalyst.12 This process has several advantages over the traditional method such as using a single reactor, inexpensive catalysts and gasoline miscible products.
Understanding the kinetics of pyrolysis and catalytic pyrolysis is vital to design, optimize, and scale up industrial biomass conversion applications. TGA is the most commonly applied thermo analytical technique for thermal study of biomass pyrolysis.12 TGA measures the decrease in substrate mass caused by the release of volatiles during thermal decomposition as a function of time13 and the pyrolysis kinetics of many kinds of biomass12,14–16 have been studied using TGA method. There are also several studies have been done on kinetics of catalytic pyrolysis such as tobacco rob mixed with catalyst (dolomite and NiO),17 corn stalk with sodium carbonate or potassium carbonate as catalyst,18 wheat straws with three kinds of catalyst (i.e. solid acid catalyst, bifunctional catalyst, and industrial catalyst).19
Douglas fir (DF) used as feedstock in our previous work is one of the most widespread and abundant species in western North America, which contains 44% cellulose, 21% hemicelluloses and 32% lignin20 and is regarded as an important biomass resource. However, very few works has been reported on the kinetics of catalytic pyrolysis of DF. Therefore, the aim of this study was to investigate both the pyrolysis and catalytic pyrolysis behavior of DF through TGA and to develop their kinetic models using Coats–Redfern and Friedman methods.
2. Materials and methods
2.1 Materials
The feedstock used in this study was DF pellet (Bear Mountain Forest Products Inc., USA), which were approximately 5 mm in diameter and 20 mm in length with moisture content of 8%. The DF pellet was grinded into small particle size (1–2 mm) before using. Catalyst ZSM-5 (Zeolyst International, USA; SiO2/Al2O3 mole ratio: 50) was dried at 105 °C for 12 h and calcined in a muffle furnace at 550 °C for 5 h. The treated catalyst was pelletized and sieved to 100 mesh.2.2 Thermogravimetric analysis (TGA)
The thermal degrading behavior of DF pyrolysis was analyzed by a TG analyzer (Mettler Toledo 188 TGA/SDTA 851, Switzerland). For each test, about 8 mg sample was loaded into an alumina crucible and heated from 25 to 600 °C at selected heating rates (10, 20, 30, and 40 °C min−1) with a nitrogen flow rate of 20 mL min−1.The same TG analyzer was used to perform the TGA for catalysis pyrolysis of DF with ZSM-5 as catalyst. For each test, about 8 mg (DF and ZSM-5 was blended with the mass ratio of 1![[thin space (1/6-em)]](https://www.rsc.org/images/entities/char_2009.gif) :
:![[thin space (1/6-em)]](https://www.rsc.org/images/entities/char_2009.gif) 3) sample was loaded into an alumina crucible and heated from 25 to 600 °C at selected heating rates (10, 20, 30, and 40 °C min−1) with a nitrogen flow rate of 20 mL min−1.
3) sample was loaded into an alumina crucible and heated from 25 to 600 °C at selected heating rates (10, 20, 30, and 40 °C min−1) with a nitrogen flow rate of 20 mL min−1.
2.3 Kinetic study
Under isothermal conditions, the reaction rate is commonly described by the following equation as:| dα/dt = kf(α) | (1) |
| α = (x0 − x)/(x0 − xf) | (2) |
The reaction rate of decomposition is a function of temperature, usually given by the Arrhenius equation:
k = A![[thin space (1/6-em)]](https://www.rsc.org/images/entities/char_2009.gif) exp(−E/RT) exp(−E/RT)
| (3) |
Substituting the reaction rate (eqn (3)) into eqn (1) gives the following equation:
dα/dt = A![[thin space (1/6-em)]](https://www.rsc.org/images/entities/char_2009.gif) exp(−E/RT)f(α) exp(−E/RT)f(α)
| (4) |
For a constant heating rate, β (K s−1) may be defined as:
| β = dT/dt | (5) |
Finally, inserting heating rate (eqn (5)) into eqn (4) gives the final equation:
dα/dt = β(dα/dT) = A![[thin space (1/6-em)]](https://www.rsc.org/images/entities/char_2009.gif) exp(−E/RT)f(α) exp(−E/RT)f(α)
| (6) |
Since numbers of simultaneous reactions were involved in the biomass decomposition process, in order to solve eqn (6) for the activation energy (E) and the frequency factor (log![[thin space (1/6-em)]](https://www.rsc.org/images/entities/char_2009.gif) A), two methods were adopted in this study, one is a model-free method and the other one is a model-fitting method.
A), two methods were adopted in this study, one is a model-free method and the other one is a model-fitting method.
| dα/f(α) = dα/(1 − α)n = (A/β) × exp(−E/RT)dT | (7) |
Integrating between the limits: α = 0 at T = T0 and α = α at T = Tα gives:
 | (8) |
Integrating (1 − α)n and exp(−E/RT) in eqn (8), the following expression can be obtained:
 | (9) |
Transforming eqn (9) into a logarithmic expression:
 | (10) |
Assuming (1 − 2RT/E) ≈ 1, eqn (10) becomes:
 | (11) |
 | (12) |
Therefore, a straight line with slope = E/R and intercept = ln(AR/βE) can be figured out.
| ln(dα/dt) = ln[(Af(α))] − E/RT | (13) |
According to Friedman's kinetic method, conversion function is assumed to be constant, which means that it only depends on the mass loss rate. Therefore, for the given value of conversion rate, the plot ln(dα/dt) versus 1/T gives a straight line with the slope of −E/R.
2.4 Pyrolysis-GC/MS
Py-GC/MS analyses were carried out on a CDS pyroprobe 5000 series (CDS Analytical, Inc.), which is connected to a GC/MS system (6890N Network GC System, 5975B inert XL MSD, Agilent Technologies). Approximately 500 μg of the feedstock (DF and DF + ZSM-5) were used. As for the catalytic pyrolysis, DF and ZSM-5 was mixed with the mass ratio of 1![[thin space (1/6-em)]](https://www.rsc.org/images/entities/char_2009.gif) :
:![[thin space (1/6-em)]](https://www.rsc.org/images/entities/char_2009.gif) 3. The oven temperature was set to 270 °C and the filament was heated to 500 °C. The GC inlet temperature was set up at 250 °C. The GC oven temperature was set at 40 °C, held for 1 min and then heated at a rate of 6 °C min−1 to 280 °C. The oven was held at the final temperature for 15 min. Helium was used as carrier gas at a flow rate of 1 mL min−1 in split mode with split ratio of 50
3. The oven temperature was set to 270 °C and the filament was heated to 500 °C. The GC inlet temperature was set up at 250 °C. The GC oven temperature was set at 40 °C, held for 1 min and then heated at a rate of 6 °C min−1 to 280 °C. The oven was held at the final temperature for 15 min. Helium was used as carrier gas at a flow rate of 1 mL min−1 in split mode with split ratio of 50![[thin space (1/6-em)]](https://www.rsc.org/images/entities/char_2009.gif) :
:![[thin space (1/6-em)]](https://www.rsc.org/images/entities/char_2009.gif) 1.
1.
3. Results and discussion
3.1 Pyrolysis and catalytic pyrolysis behavior of DF
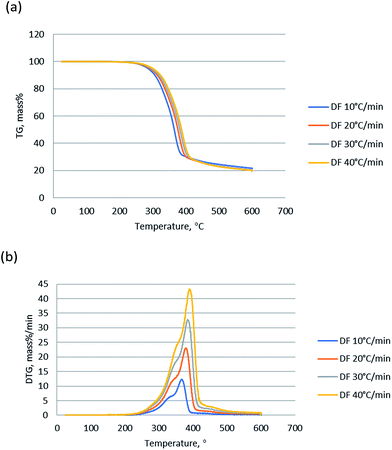
Thermogravimetric analysis showed the relationship between the weight change of a sample and temperature, playing a significant role in understanding of the thermal decomposition and reaction mechanism during the pyrolysis. TG curves indicates the mass loss of the sample versus temperature change of the thermal degradation, and DTG presents the corresponding rate of mass loss of TG curves. Fig. 1 shows the TG and DTG curves of DF pyrolysis at four different heating rates (10, 20, 30, and 40 °C min−1). The changes (5% mass%) at the temperature lower than 150 °C was not counted since it was attributed to vaporization of moisture.27 TG curves show that the main weight loss of DF was between 250 and 430 °C, which was a result of the primary decomposition reaction.28 Meanwhile, there are two peaks around 340 °C and 380 °C and a long tail at high temperature in the DTG curves. The 340 °C peak was mainly contributed by hemicellulose devolatilization, and the second 380 °C was mainly attributed to cellulose devolatilization.29,30 The long tail at high temperatures was corresponding to the thermal decomposition of lignin, due to the very board decomposition range.31The heating rate is an important factor during biomass pyrolysis process, since it affects the pyrolysis though heat transfer and mass transfer through the biomass particles. As shown in Fig. 1, the shape of TG and DTG curves at various rates is almost the same and there is no significant difference in pyrolysis residues. Nevertheless, the peaks of DTG curve became sharper as the heating rate increased, and the weight loss rates were significantly enhanced by higher heating rates compared to those by the lower heating rates. And the recoded peak weight loss rates were 12.2, 23.1, 32.9 and 42.5 mass% per min, for 10, 20, 30 and 40 °C min−1 respectively. The Fig. 1 shows that the peaks of DTG curves slightly shifted to the right as the heating rate increased, due to the fact that gradient of temperature of a particle and distribution of temperature was smaller at low heating rates.
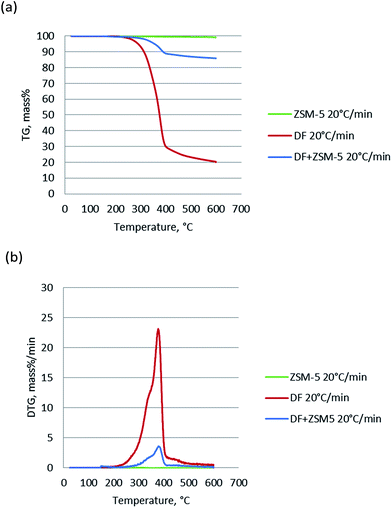
The TG and DTG of pure ZSM-5 catalyst, DF, and DF + ZSM-5 (DF and ZSM-5 blended with the mass ratio of 1![[thin space (1/6-em)]](https://www.rsc.org/images/entities/char_2009.gif) :
:![[thin space (1/6-em)]](https://www.rsc.org/images/entities/char_2009.gif) 3) were performed and the results are shown in Fig. 2. For the pure ZSM-5 catalyst, the 1.4% weight loss below 150 °C due to vaporization of moisture was not counted and hence the total weight loss from 150 °C to 600 °C was only 0.8%, negligible when compared with the weight loss of DF (∼80%). Comparing the TG and DTG curves of the DF and DF + ZSM-5, it can be seen that in the presence of the catalyst, the peaks of DTG curves slightly shifted to the left. This means the addition of the catalyst tends to slightly lower the temperature of thermal degrading process, in agreement with the results reported by Yang17 from the pyrolysis of tobacco rob using dolomite and NiO as catalyst.
3) were performed and the results are shown in Fig. 2. For the pure ZSM-5 catalyst, the 1.4% weight loss below 150 °C due to vaporization of moisture was not counted and hence the total weight loss from 150 °C to 600 °C was only 0.8%, negligible when compared with the weight loss of DF (∼80%). Comparing the TG and DTG curves of the DF and DF + ZSM-5, it can be seen that in the presence of the catalyst, the peaks of DTG curves slightly shifted to the left. This means the addition of the catalyst tends to slightly lower the temperature of thermal degrading process, in agreement with the results reported by Yang17 from the pyrolysis of tobacco rob using dolomite and NiO as catalyst.
3.2 Decomposition kinetics
![[thin space (1/6-em)]](https://www.rsc.org/images/entities/char_2009.gif) A and R2 for DF pyrolysis by Coats–Redfern method
A and R2 for DF pyrolysis by Coats–Redfern method
| Feedstock | Reaction order | Activation energy (kJ mol−1) | R2 |
|---|---|---|---|
| DF | n = 1 | 78.153 | 0.976 |
| n = 2 | 116.72 | 0.973 | |
| n = 3 | 164.72 | 0.945 | |
| n = 4 | 218.75 | 0.917 | |
| n = 5 | 276.41 | 0.898 | |
| n = 6 | 336.30 | 0.885 | |
| DF + ZSM-5 | n = 1 | 65.113 | 0.986 |
| n = 2 | 75.723 | 0.964 | |
| n = 3 | 111.19 | 0.957 | |
| n = 4 | 159.44 | 0.950 | |
| n = 5 | 193.63 | 0.941 | |
| n = 6 | 237.66 | 0.934 |
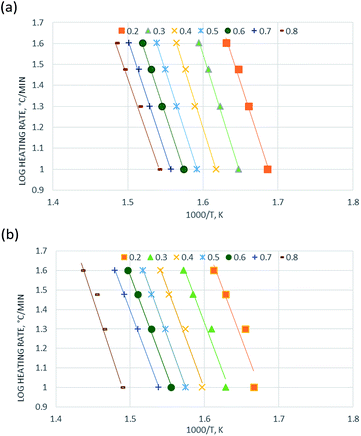 | ||
| Fig. 3 Kinetics analysis of (a) non-catalytic and (b) catalytic pyrolysis of DF by the Friedman method. | ||
| α | DF | DF + ZSM-5 | ||
|---|---|---|---|---|
| E (kJ mol−1) | R2 | E (kJ mol−1) | R2 | |
| 0.2 | 206.16 | 0.992 | 186.33 | 0.908 |
| 0.3 | 213.25 | 0.997 | 186.67 | 0.964 |
| 0.4 | 211.60 | 0.997 | 191.46 | 0.988 |
| 0.5 | 207.60 | 0.999 | 192.06 | 0.998 |
| 0.6 | 202.74 | 0.999 | 190.79 | 0.997 |
| 0.7 | 200.55 | 0.998 | 187.75 | 0.999 |
| 0.8 | 191.03 | 0.996 | 214.33 | 0.976 |
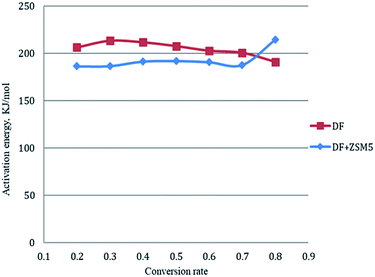
The activation energy for each conversion rate for non-catalytic pyrolysis and catalytic pyrolysis was showed in Fig. 4. The apparent activation energy of pyrolysis decreased in the second reaction progress (α = 0.8), indicating that the energy required for the final stages of the non-catalytic pyrolysis was lower than that required for the first part. This behavior was in consistent with the results reported in the previous study.23 In contrast with the non-catalytic pyrolysis process, the apparent activation energy of the catalytic pyrolysis increased significantly to 214.33 kJ mol−1 in the last reaction progress. The reduction of the activation energy in the first region and then the increase of it in the second region could be explained by that at the last stage of the catalytic pyrolysis, the reaction probably included secondary cracking of intermediate compounds, producing small molecules34 that were highly affected by shape-selective catalyst used in this study (ZSM-5) and in turn resulted in higher activation energy in the final stage than that in the first stage.
3.3 Validation
Since the activation energy calculated by the Friedman method was very close to that by the FWO and KAS methods and considered to be more accurate, the mean value of activation energies obtained from the Friedman method was used for in Coats–Redfern equations for calculation of frequency factor (log![[thin space (1/6-em)]](https://www.rsc.org/images/entities/char_2009.gif) A). The plots for n = 1, Coats–Redfern model was lack of accuracy for representing experimental results, for n ≠ 1, as claimed in these two literatures,35,36 the pseudo-order n had no physical meaning but played an important role as a correlation parameter to fit parameter of pyrolysis model. In order to validate kinetic parameters, the simulation was carried out for the heating rate at 20 °C min−1 and the results were presented in Fig. 5. The calculated data agree with the experimental data very well when n = 3.7 for non-catalytic pyrolysis and n = 4.8 for catalytic pyrolysis of DF.
A). The plots for n = 1, Coats–Redfern model was lack of accuracy for representing experimental results, for n ≠ 1, as claimed in these two literatures,35,36 the pseudo-order n had no physical meaning but played an important role as a correlation parameter to fit parameter of pyrolysis model. In order to validate kinetic parameters, the simulation was carried out for the heating rate at 20 °C min−1 and the results were presented in Fig. 5. The calculated data agree with the experimental data very well when n = 3.7 for non-catalytic pyrolysis and n = 4.8 for catalytic pyrolysis of DF.
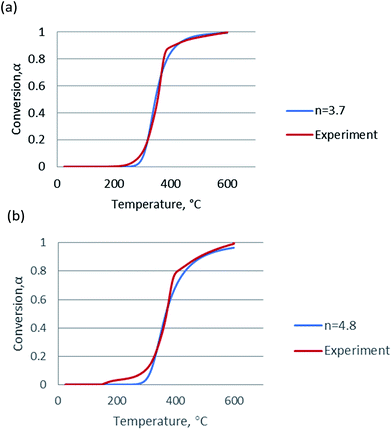 | ||
| Fig. 5 Simulation of (a) non-catalytic and (b) catalytic pyrolysis using the kinetic data calculated from the Friedman method. | ||
3.4 Py-GC/MS analysis and mechanism analysis
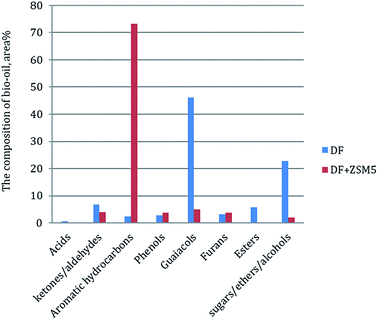
In order to further understand the effect of the ZSM-5 catalyst on chemical composition of bio-oil product from catalytic pyrolysis of DF, we performed Py-GC/MS to characterize the bio-oil compounds. The results were summarized to several categories based on chemical functional groups (Fig. 6). We found out that aromatic hydrocarbons, phenols and furans increased with the addition of the ZSM-5 catalyst to the pyrolysis of DF, while acids, esters, ketones/aldehydes and guaiacols exhibited the opposite tendencies. Among all the components, aromatic hydrocarbons increased significantly from 2.3 to 73.3 area% while guaiacols greatly decreased from 46.1 to 4.9 area%. The composite change of the bio-oil product showed that the catalyst had highly positive effect on aromatic hydrocarbon production by reducing oxygen-containing compounds (i.e. acids, esters, ketones/aldehydes and guaiacols) during DF pyrolysis. These changes of bio-oil composition were attributed to secondary cracking occurring on the surface of the ZSM-5 catalyst during the catalytic pyrolysis process.17 During the secondary cracking process, propenyl-guaiacols generated through the depolymerization and dehydration of DF lignin could enter the small pore-size of ZSM-5 catalyst and then converted into compounds with aromatic rings and C–H bonds (i.e. aromatic hydrocarbons).374. Conclusions
In this study, we report the thermal decomposition behavior and kinetics of pyrolysis and catalytic pyrolysis of DF through TG. According to TG and DTG curves, it was observed that the addition of the ZSM-5 catalyst tended to slightly reduce the biomass thermal degrading temperature. We found that the ZSM-5 catalyst increased the rate of reaction and reduced the energy required for decomposition process. Simulation of DF pyrolysis and catalytic pyrolysis using the obtained kinetic parameters and comparison with experimental data are in good agreement with experimental data. We further characterized the chemical composition of the bio-oil product via Py-GC/MS. The results showed that the ZSM-5 catalyst had a highly positive effect on aromatic hydrocarbon production by greatly reducing oxygen-containing compounds during DF pyrolysis. Therefore, in conclusion, we believe that catalytic pyrolysis of DF using ZSM-5 catalyst may be regarded as a promising method for production of high quality bio-oil.Conflicts of interest
There are no conflicts to declare.Acknowledgements
This study was supported by The Agriculture and Food Research Initiative of National Institute of Food and Agriculture, United States Department of Agriculture (award number: 2016-67021-24533; award number: 2016-33610-25904), Washington State University Office of Commercialization, the Offices of the President and Provost in conjunction with the Vice President of Research, the Washington Research Foundation, Anhui Provincial Natural Science Foundation of China (1708085QC66), and The Fundamental Research Funds for the Central Universities, China (JZ2016HGBZ0788).Notes and references
- B. Digman, H. S. Joo and D. S. Kim, Environ. Prog. Sustainable Energy, 2009, 28, 47–51 CrossRef CAS.
- F. Talebnia, D. Karakashev and I. Angelidaki, Bioresour. Technol., 2010, 101, 4744–4753 CrossRef CAS PubMed.
- R. Hilten, R. Speir, J. Kastner and K. C. Das, J. Anal. Appl. Pyrolysis, 2010, 88, 30–38 CrossRef CAS.
- H.-T. Lin, M.-S. Huang, J.-W. Luo, L.-H. Lin, C.-M. Lee and K.-L. Ou, Fuel Process. Technol., 2010, 91, 1355–1363 CrossRef CAS.
- Z. Luo, S. Wang, Y. Liao, J. Zhou, Y. Gu and K. Cen, Biomass Bioenergy, 2004, 26, 455–462 CrossRef CAS.
- A. Oasmaa and S. Czernik, Energy Fuels, 1999, 13, 914–921 CrossRef CAS.
- Q. Zhang, J. Chang, T. J. Wang and Y. Xu, Energy Convers. Manage., 2007, 48, 87–92 CrossRef CAS.
- D. Mohan, C. U. Pittman and P. H. Steele, Energy Fuels, 2006, 20, 848–889 CrossRef CAS.
- S. Vichaphund, D. Aht-ong, V. Sricharoenchaikul and D. Atong, Renewable Energy, 2014, 65, 70–77 CrossRef CAS.
- L. Wang, H. Lei, S. Ren, Q. Bu, J. Liang, Y. Wei, Y. Liu, G.-S. J. Lee, S. Chen, J. Tang, Q. Zhang and R. Ruan, J. Anal. Appl. Pyrolysis, 2012, 98, 194–200 CrossRef CAS.
- A. J. Foster, J. Jae, Y.-T. Cheng, G. W. Huber and R. F. Lobo, Appl. Catal., A, 2012, 423–424, 154–161 CrossRef CAS.
- P. T. Williams and N. Nugranad, Energy, 2000, 25, 493–513 CrossRef CAS.
- N. Al-Otaibi and G. Hutchings, Catal. Lett., 2010, 134, 191–195 CrossRef CAS.
- E. Pütün, B. a. B. Uzun and A. e. E. Pütün, Energy Fuels, 2009, 23, 2248–2258 CrossRef.
- P. A. Horne and P. T. Williams, Renewable Energy, 1994, 5, 810–812 CrossRef CAS.
- E. Taarning, C. M. Osmundsen, X. Yang, B. Voss, S. I. Andersen and C. H. Christensen, Energy Environ. Sci., 2011, 4, 793–804 CAS.
- Y. Yang, T. Li, S. Jin, Y. Lin and H. Yang, Bioresour. Technol., 2011, 102, 11027–11033 CrossRef CAS PubMed.
- A. G. Gayubo, A. T. Aguayo, A. Atutxa, R. Aguado, M. Olazar and J. Bilbao, Ind. Eng. Chem. Res., 2004, 43, 2619–2626 CrossRef CAS.
- E. F. Iliopoulou, S. D. Stefanidis, K. G. Kalogiannis, A. Delimitis, A. A. Lappas and K. S. Triantafyllidis, Appl. Catal., B, 2012, 127, 281–290 CrossRef CAS.
- R. C. Pettersen, The Chemical Composition of Wood, in The Chemistry of Solid Wood, ed. R. Rowell, Madison, WI, 1984 Search PubMed.
- J. E. White, W. J. Catallo and B. L. Legendre, J. Anal. Appl. Pyrolysis, 2011, 91, 1–33 CrossRef CAS.
- A. W. Coats and J. P. Redfern, Nature, 1964, 201, 68–69 CrossRef CAS.
- Ö. Çepelioğullar, H. Haykırı-Açma and S. Yaman, Waste Manag., 2016, 48, 275–284 CrossRef PubMed.
- H. L. Friedman, J. Polym. Sci., Part C: Polym. Symp., 1964, 6, 183–195 CrossRef.
- T. Ozawa, Bull. Chem. Soc. Jpn., 1965, 38, 1881–1886 CrossRef CAS.
- H. E. Kissinger, J. Res. Natl. Bur. Stand., 1956, 57, 5 Search PubMed.
- Y. Gao, X. Chen, J. Zhang and N. Yan, ChemPlusChem, 2015, 80, 1556–1564 CrossRef CAS.
- S. R. Naqvi, Y. Uemura, N. Osman and S. Yusup, Res. Chem. Intermed., 2015, 41, 9743–9755 CrossRef CAS.
- H. P. Yang, R. Yan, H. P. Chen, D. H. Lee and C. G. Zheng, Fuel, 2007, 86, 1781–1788 CrossRef CAS.
- M. Amutio, G. Lopez, R. Aguado, M. Artetxe, J. Bilbao and M. Olazar, Fuel, 2012, 95, 305–311 CrossRef CAS.
- J. Huang, W. Long, P. K. Agrawal and C. W. Jones, J. Phys. Chem. C, 2009, 113, 16702–16710 CAS.
- M. S. Masnadi, R. Habibi, J. Kopyscinski, J. M. Hill, X. Bi, C. J. Lim, N. Ellis and J. R. Grace, Fuel, 2014, 117, 1204–1214 CrossRef CAS.
- L. M. Alvarenga, T. P. Xavier, M. A. S. Barrozo, M. S. Bacelos and T. S. Lira, Procedia Eng., 2012, 42, 113–122 CrossRef.
- S. R. Naqvi, Y. Uemura, N. Osman and S. Yusup, Res. Chem. Intermed., 2015, 41, 9743–9755 CrossRef CAS.
- S. Ceylan and Y. Topçu, Bioresour. Technol., 2014, 156, 182–188 CrossRef CAS PubMed.
- X. Huang, J.-P. Cao, X.-Y. Zhao, J.-X. Wang, X. Fan, Y.-P. Zhao and X.-Y. Wei, Fuel, 2016, 169, 93–98 CrossRef CAS.
- E. B. Hassan, I. Elsayed and A. Eseyin, Fuel, 2016, 174, 317–324 CrossRef CAS.
| This journal is © The Royal Society of Chemistry 2018 |

