 Open Access Article
Manganese(II) enhanced fluorescent nitrogen-doped graphene quantum dots: a facile and efficient synthesis and their applications for bioimaging and detection of Hg2+ ions†
Li Yanga,
Aimiao Qin *a,
Shuoping Chena,
Lei Liaoa,
Jiangke Qinb and
Kaiyou Zhanga
aKey Lab New Processing Technology for Nonferrous Metals & Materials, Ministry of Education, Guangxi Key Laboratory in Universities of Clean Metallurgy and Comprehensive Utilization for Non-ferrous Metals Resources, College of Materials Science & Engineering, Guilin University of Technology, Guilin, China. E-mail: 592491245@qq.com
bCollege of Chemistry and Pharmaceutical Science, Guangxi Normal University, Guilin, China
First published on 6th February 2018
Abstract
Manganese ion (Mn2+) bonded nitrogen-doped graphene quantum dots (Mn(II)-NGQDs) with water solubility have been successfully synthesized by a simple, one-pot hydrothermal carbonization, using sodium citrate, glycine and manganese chloride as raw materials. The photoluminescence (PL) characteristics of Mn(II)-NGQDs were studied in detail. The resulting Mn(II)-NGQDs show a remarkably enhanced PL intensity and quantum yield (QY = 42.16%) compared with the product without Mn(II)-doped (named as NG, QY = 27.06%) and the product doped with other metal ions. The Mn(II)-NGQDs not only display low toxicity and high cellular uptake efficiency for fluorescence live cell imaging in biological evaluations but also exhibit a fast, highly selective and sensitive fluorescence quenching effect toward Hg2+ ions, with a detection limit of 3.4 × 10⁻⁸ mol L−1.
Introduction
Graphene quantum dots (GQDs) have drawn much attention in the wide fields of catalysis, energy conversion, optoelectronics, bioimaging probes and biosensors.1–5 Very recently, GQDs have been intensively studied as new fluorescent materials in bioimaging and biosensors, because of their unique optical properties, low toxicity, water solubility and excellent biocompatibility.6 GQDs bearing oxygen functionalities such as carboxyl, epoxyl and hydroxyl groups indicate obvious advantages in water solubility, optical and electronic properties.7–10 GQDs possess high crystallinity and their crystal structure resemble regular hexagonal lattice for the layered graphene.11 GQDs can flexibly combine with target drug molecules due to the unique two-dimensional (2D) structure and abundant surface functional groups, thus they have been attracted much attention as a kind of novel light-emitting nanomaterial for versatile theranostic biomedical applications, including diagnostic imaging-guided therapy, fluorescence biosensing-based tumor detection, drug delivery, and synergistic cancer therapy.12,13To date, a myriad of strategies for fabricating GQDs and graphene derivatives have been explored, such as pyrolysis synthesis,14 electrochemical synthesis,15 microwave-assisted solid-phase synthesis,16 hydrothermal synthesis17 and etc. Among these synthesis approaches, the carbonization of citric acid to prepare GQDs were considered to be one of promising method, since it can provide stable quantum dots with high yields.18,19 However, there are a series of problems for the direct carbonization of citric acid to face, such as complicated preparation process, harsh reaction conditions (such as strong acid/alkali using), accurate pH control and tedious postprocessing, which may lead to great restrictions for the further biomedical applications of QDs.20–22
To extend and improve the physical and chemical properties of GQDs, different modification methods have been applied, including surface functional groups modification,23 heteroatoms doping24,25 and formation of composite.26,27 For example, the ways of functionalization with surface groups and heteroatoms doping (such as N,S) may significantly transform the optical properties, quantum yields, chemical activities and electronics structure of GQDs,28,29 which would provide interesting luminescent properties, such as pH-dependent and excitation-dependent photoluminescence (PL) behaviors.30,31 The interaction of GQDs and metal ions or rare earth elements32,33 in solution may lead to the excitation/emission spectrum suppression, amplification or shift, which has been used for high selectivity and sensitivity detection of different ions and specificity molecules. Han et al. reported the magnetic-fluorescent imaging behavior based on manganese(II)-carbon dots, indicating that the metal bonded GQDs could be good fluorescent probes for bioimaging.34
In this paper, in order to explore the doping effect of different metal ions on the PL behaviors of GQDs, we chose sodium citrate and glycine as carbon and nitrogen sources respectively to synthesize multifunctional GQDs for the first time. By using the facile and efficient hydrothermal method, Mn2+ bonded nitrogen-doped graphene quantum dots (Mn(II)-NGQDs) with water solubility and multifunction were successfully produced, which is the first case of Mn(II)-NGQDs with Mn2+ enhanced fluorescence via a confinement effect between Mn2+ and functional groups. The Mn(II)-NGQDs exhibit a strong emission with high quantum yield, and display a highly selective and sensitive fluorescence quenching response to Hg2+. Moreover, the Mn(II)-NGQDs show low cytotoxicity and are suitable for fluorescence live cell imaging, which would be used for bio-imaging application.
Experimental
Reagents and chemicals
Glycine, sodium citrate, MnCl2·4H2O, MnSO4, Mn(NO3)2, Mn(CH3COO)2, Ni(NO3)2·6H2O, Pb(NO3)2, AgNO3, Zn(NO3)2·6H2O, CuCl2·2H2O, FeSO4·7H2O, FeCl3·6H2O, Co(NO3)2·6H2O, CaCl2, CdCl2, hexamethylenetetramine (HMTA) and other chemicals were of analytical grade and used as received without further purification. Milli-Q water (18.2 MΩ) was used for all of the experiments. Stock solutions of Hg2+, Ag+, Al3+, Ba2+, Cr3+, Ca2+, Cd2+, Co2+, Cu2+, Fe2+, Fe3+, Mg2+, Mn2+, Zn2+, Ni2+ and Pb2+ ions were prepared by dissolving corresponding metal salts in Milli-Q water.Characterization
Transmission electron microscopy (TEM) was carried out on a JEOL-2010 TEM at 200 kV. Fourier transform infrared (FTIR) spectra were recorded using a FTIR2500 spectrometer (KBr disk). Raman spectra were collected on a LabRam-1B Raman spectroscope equipped with a 632.8 nm laser source. X-ray diffraction spectra (XRD) were determined on a Holland PANalytical X'Pert PRO X-ray diffractometer with Cu Kα (λ = 1.54056 Å) as radiation source in the 2θ range of 5–80°. X-ray photoelectron spectroscopy (XPS) measurements were made on Kratos AXIS UltraDLD (Kratos Analytical Ltd.) with mono Al Kα radiation (hν = 1487.71 eV) at a power of 75 W. Emission spectra were collected using a Varian Cary 100 spectrometer. Fluorescence life time of the products were determined using a FLS980 fluorometer (Edinburgh Instruments Ltd.). Absorption spectra were recorded on a UV-3600 UV-vis-NIR spectrophotometer (Shimadzu). Fluorescence quantum yield (QY) was detected using quinine sulfate as the standard (QY = 54% in 0.1 M H2SO4). Confocal laser-scanning microscopy (CLSM) images were recorded on a Zeiss LSM 710 CLSM (Zeiss LSM710, Germany). The zeta potential of Mn(II)-NGQDs and NG were measured by a Zetasizer Nano ZS90 (Malvern Instruments).Synthesis of Mn(II)-NGQDs and NG
In typically synthesis, a mixture of glycine (0.0451 g), sodium citrate solution (12 mL, 0.1 mol L−1), MnCl2 solution (1 mL, 0.1 mol L−1) and Milli-Q water (37 mL) was added into a flask with stirring, to form a clear reaction solution. The solution was then transferred into a 100 mL Teflon-lined autoclave, and then heated to 180 °C for 10 h. After that, the autoclave was cooled down naturally to room temperature. The obtained bright transparent solution was centrifuged at 10![[thin space (1/6-em)]](https://www.rsc.org/images/entities/char_2009.gif) 000 rpm for 10 min to remove the deposit. Subsequently, the supernatant of Mn(II)-NGQDs solution (6.52 mg mL−1, ESI†) was dialyzed (molecular weight cut off, 1000 Da) against water for 48 h. Afterwards, the pure and solid-state Mn(II)-NGQDs white powder was obtained by vacuum freeze drying. Finally, the resulted Mn(II)-NGQDs were dispersed in water as a stock solution for further characterization and detection.
000 rpm for 10 min to remove the deposit. Subsequently, the supernatant of Mn(II)-NGQDs solution (6.52 mg mL−1, ESI†) was dialyzed (molecular weight cut off, 1000 Da) against water for 48 h. Afterwards, the pure and solid-state Mn(II)-NGQDs white powder was obtained by vacuum freeze drying. Finally, the resulted Mn(II)-NGQDs were dispersed in water as a stock solution for further characterization and detection.
As a contrast, other common metal ions doped in NG (M-NG, M = Ag+, Al3+, Ba2+, Cr3+, Ca2+, Cd2+, Co2+, Cu2+, Fe2+, Fe3+, K+, Mg2+, Zn2+, Ni2+ or Pb2+), were also prepared using the similar method as Mn(II)-NGQDs, except for using different metal salts. In addition, the NG without metal doping was also prepared using the above experimental procedure.
Fluorescence detection of Hg2+ ion
In a typical process, 200 μL of Hg2+ solution with various concentrations (0–5 × 10⁻⁶ mol L−1) and 200 μL of Mn(II)-NGQDs (6.52 mg mL−1) solution were mixed together and diluted to 5 mL with the HMTA buffer solution (pH = 7.35). After kept at room temperature for 10 min, the fluorescence emission spectra of the solution were collected under an excitation wavelength of 370 nm. As a contrast, the sensing capability of NG toward Hg2+ have been investigated by a same detection procedure. The procedure of Mn(II)-NGQDs detection of Hg2+ in Milli-Q water were also carried out.Cellular toxicity test
The cytotoxicity of Mn(II)-NGQDs was evaluated by the MTT assay. HepG2 human liver cancer cells were harvested (obtained from Shanghai Institute of Organic Chemistry, Chinese Academy of Sciences; the cell density was adjusted to 105 cells per mL) and seeded in a 96-well plate overnight for 24 h. Then, the Mn(II)-NGQDs solution was added into each well with increasing concentrations from 0 to 300 μg mL−1. After that, the cells were cultivated for 4 and 24 h, respectively. And then, 10 μL of 5 mg mL−1 MTT (3-(4,5-dimethylthiazol-2-yl)-2,5-diphenyltetra-zolium bromide) solution was added to each cell well. After incubation for 4 h, the culture medium was discarded, and 100 μL of dimethyl sulfoxide (DMSO) was added. The obtained mixture was shaken for 15 min in the dark at room temperature, and the absorbance of each well was measured at wavelength of 570 nm using an enzyme linked immunosorbent assay (Tecan Infinite M1000) reader with pure DMSO as a blank. In addition, HepG2 human liver cancer cells without Mn(II)-NGQDs treating were used as a control to test their relative cell viability.Live cell imaging
HepG2 human liver cancer cells and Raw264.7 mouse macrophages (obtained Shanghai, China) were cultured in Dul-becco's modified eagle medium (DMEM) supplemented with PBS (pH = 7.4) in 10% and 100 mg mL−1 streptomycin and 100 units per mL penicillin solution in 5% CO2 at 37 °C. The cells were grown on the bottom of 35 mm glass culture dishes to the density of 80% confluence and then incubated with Mn(II)-NGQDs at 37 °C for 3 h. Then, the cells were washed three times with PBS. Images of the cells were immediately captured at ambient temperature on a laser scanning confocal microscopy using a digital camera.Results and discussion
Characterization of Mn(II)-NGQDs
The synthetic procedure for the fabrication of fluorescent Mn(II)-NGQDs is illustrated in Fig. 1. The morphology and microstructure of the Mn(II)-NGQDs were confirmed by the typical TEM image. As shown in Fig. 2a, the Mn(II)-NGQDs were well dispersed and uniform in size and shape. The corresponding size distribution histogram was obtained by random counting 100 particles (Fig. S1, ESI†), indicating that the size of Mn(II)-NGQDs was about 1.0–5.5 nm with an average diameter of approximately 4.5 nm. By contrast, the NG consisted of a large amounts of irregular nanosheets and a small amount of QDs (Fig. 2b, ESI†). Obviously, the bonding of Mn2+ can change the morphology of NG effectively. The HRTEM image of the Mn(II)-NGQDs shows their well-resolved lattice fringes, which indicates that they possess relatively good crystallinities. The lattice spacings of Mn(II)-NGQDs (the inset in Fig. 2a) and NG (the inset in Fig. 2b) are 0.24 and 0.26 nm respectively, which are assigned to the (100) and (020) plane of graphitic carbon, respectively.35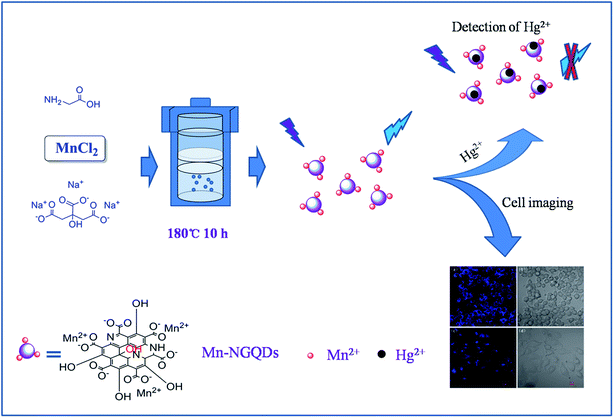 | ||
| Fig. 1 Schematic illustration of the synthesis of Mn(II)-NGQDs and cells imaging and Hg2+ detection. | ||
According to the XRD patterns of Mn(II)-NGQDs and NG (Fig. S2, ESI†), both of Mn(II)-NGQDs and NG exhibit two broad peaks centered at 9.2° (2θ) and 31.5° (2θ), corresponding to the (001) and (002) plane of graphitic nitride carbon,36,37 respectively. Compared with NG, the board peak at 31.5° (2θ) of Mn(II)-NGQDs is weakened obviously, indicating that in Mn(II)-NGQDs, the Mn2+ ions bond with the functional groups at the edge of NG, and may help to divide the large graphene sheets to small graphene domains.
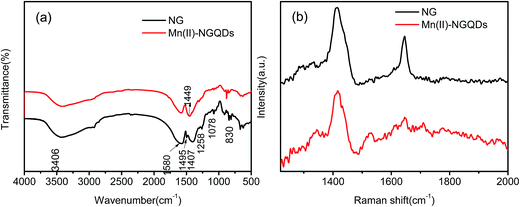
Fig. 3a shows the FTIR spectra of Mn(II)-NGQDs and NG. The broad band at 3406 cm−1 corresponds to the stretching vibration of O–H and N–H. The strong and broad absorption band ranging from 1500 cm−1 to 1750 cm−1 with a center at 1580 cm−1 corresponded to the stretching vibrations of C![[double bond, length as m-dash]](https://www.rsc.org/images/entities/char_e001.gif) O and C
O and C![[double bond, length as m-dash]](https://www.rsc.org/images/entities/char_e001.gif) C in the aromatic ring. The bands at 1407 cm−1 and 830 cm−1 were assigned to the C–H bending and C–H stretching, respectively. The bands at 1258 cm−1 and 1078 cm−1 were attributed to the stretching vibrations of O–H and C–O–C, respectively.16,38,39 The small peaks at 1495 cm−1 and 1449 cm−1 corresponded to the NH3+ symmetric bending and C–N stretching vibration, respectively,39,40 which confirmed that nitrogen atoms have been successfully doped into the Mn(II)-NGQDs and NG. However, compared to NG, the C–O stretching vibration at 1078 cm−1 and NH3+ symmetric bending at 1495 cm−1 in Mn(II)-NGQDs disappear, indicating the existence of Mn2+ ions which have bonded to the NG. Moreover, the C–N stretching vibration of Mn(II)-NGQDs at 1449 cm−1 increases obviously, indicates that more nitrogen elements are preserved after the coordination effect of Mn2+ ions. Fig. 3b shows the Raman spectra of Mn(II)-NGQDs and NG. Both of Mn(II)-NGQDs and NG demonstrate a G band at 1645 cm−1, which relates to the vibration of the sp2 hybridization of graphitic carbon, and a D band at 1411 cm−1, which corresponds to the carbon lattice distortion. Compared to NG, Mn(II)-NGQDs show a more weak G band at 1645 cm−1 and a larger intensity ratio ID/IG increase from 1.29 to 2.23. Similar to the previous analysis,41–43 more structural defects, larger sp2 domains and smaller sp2 fragments are expected to be present in the Mn(II)-NGQDs. It is indicated that the bonding of Mn2+ can change the morphology of NG.
C in the aromatic ring. The bands at 1407 cm−1 and 830 cm−1 were assigned to the C–H bending and C–H stretching, respectively. The bands at 1258 cm−1 and 1078 cm−1 were attributed to the stretching vibrations of O–H and C–O–C, respectively.16,38,39 The small peaks at 1495 cm−1 and 1449 cm−1 corresponded to the NH3+ symmetric bending and C–N stretching vibration, respectively,39,40 which confirmed that nitrogen atoms have been successfully doped into the Mn(II)-NGQDs and NG. However, compared to NG, the C–O stretching vibration at 1078 cm−1 and NH3+ symmetric bending at 1495 cm−1 in Mn(II)-NGQDs disappear, indicating the existence of Mn2+ ions which have bonded to the NG. Moreover, the C–N stretching vibration of Mn(II)-NGQDs at 1449 cm−1 increases obviously, indicates that more nitrogen elements are preserved after the coordination effect of Mn2+ ions. Fig. 3b shows the Raman spectra of Mn(II)-NGQDs and NG. Both of Mn(II)-NGQDs and NG demonstrate a G band at 1645 cm−1, which relates to the vibration of the sp2 hybridization of graphitic carbon, and a D band at 1411 cm−1, which corresponds to the carbon lattice distortion. Compared to NG, Mn(II)-NGQDs show a more weak G band at 1645 cm−1 and a larger intensity ratio ID/IG increase from 1.29 to 2.23. Similar to the previous analysis,41–43 more structural defects, larger sp2 domains and smaller sp2 fragments are expected to be present in the Mn(II)-NGQDs. It is indicated that the bonding of Mn2+ can change the morphology of NG.
Furthermore, more information of the surface functional groups of Mn(II)-NGQDs and NG is further provided by XPS analysis (Fig. 4). The full-range spectra (Fig. 4a) show that, both of Mn(II)-NGQDs and NG contain C, N and O elements, and there is about 0.21% Mn (atomic fraction) in Mn(II)-NGQDs (Table S1, ESI†). Fig. 4b shows the C 1s XPS spectrum of the Mn(II)-NGQDs, which ranged from 280 to 292 eV. There are four adjacent peaks at 284.3 eV, 284.9 eV, 285.9 eV and 288.1 eV, which can be attributed to C–C/C![[double bond, length as m-dash]](https://www.rsc.org/images/entities/char_e001.gif) C, C–N, C–O and C
C, C–N, C–O and C![[double bond, length as m-dash]](https://www.rsc.org/images/entities/char_e001.gif) O bonding respectively.9 The N 1s spectrum of Mn(II)-NGQDs (Fig. 4d) exhibits three peaks at 398.9 eV, 399.2 eV and 400.9 eV, which are associated with C–N–C, N–(C)3 and N–H groups.11,39,40 The O 1s spectra of Mn(II)-NGQDs (see Fig. S3a, ESI†) and NG (see Fig. S3b, ESI†) show two peaks at 531.0 eV and 531.8 eV, which are associated with O–H and C–O–C groups, respectively.17 These spectra reveals that nitrogen element has successfully introduced into the Mn(II)-NGQDs and NG, and Mn(II)-NGQDs and NG has been functioned with some groups, such as –COOH, –OH and N–H group. The high resolution XPS spectrum of Mn 2p (Fig. 4b) shows a dominant peak at 641 eV assigned to Mn2+, indicating that the oxidation state of Mn on the surface of Mn(II)-NGQDs remains unchanged.34 Compared to the XPS spectrum of NG, the C 1s (Fig. 4e) and N 1s (Fig. 4f) spectra of Mn(II)-NGQDs in the peak shape are very similar to those of NG, which means that the introduction of Mn2+ ions cannot affect the carbon-based species. However, the atomic fraction (Table S1, ESI†) of N in Mn(II)-NGQDs (4.24%) is dramatically increasing compared with that of NG (2.2%), which may indicate that more N–H groups are preserved by the coordination effect of Mn2+ ion. The above results clearly reveal that Mn(II)-NGQDs and NG have been successfully produced.
O bonding respectively.9 The N 1s spectrum of Mn(II)-NGQDs (Fig. 4d) exhibits three peaks at 398.9 eV, 399.2 eV and 400.9 eV, which are associated with C–N–C, N–(C)3 and N–H groups.11,39,40 The O 1s spectra of Mn(II)-NGQDs (see Fig. S3a, ESI†) and NG (see Fig. S3b, ESI†) show two peaks at 531.0 eV and 531.8 eV, which are associated with O–H and C–O–C groups, respectively.17 These spectra reveals that nitrogen element has successfully introduced into the Mn(II)-NGQDs and NG, and Mn(II)-NGQDs and NG has been functioned with some groups, such as –COOH, –OH and N–H group. The high resolution XPS spectrum of Mn 2p (Fig. 4b) shows a dominant peak at 641 eV assigned to Mn2+, indicating that the oxidation state of Mn on the surface of Mn(II)-NGQDs remains unchanged.34 Compared to the XPS spectrum of NG, the C 1s (Fig. 4e) and N 1s (Fig. 4f) spectra of Mn(II)-NGQDs in the peak shape are very similar to those of NG, which means that the introduction of Mn2+ ions cannot affect the carbon-based species. However, the atomic fraction (Table S1, ESI†) of N in Mn(II)-NGQDs (4.24%) is dramatically increasing compared with that of NG (2.2%), which may indicate that more N–H groups are preserved by the coordination effect of Mn2+ ion. The above results clearly reveal that Mn(II)-NGQDs and NG have been successfully produced.
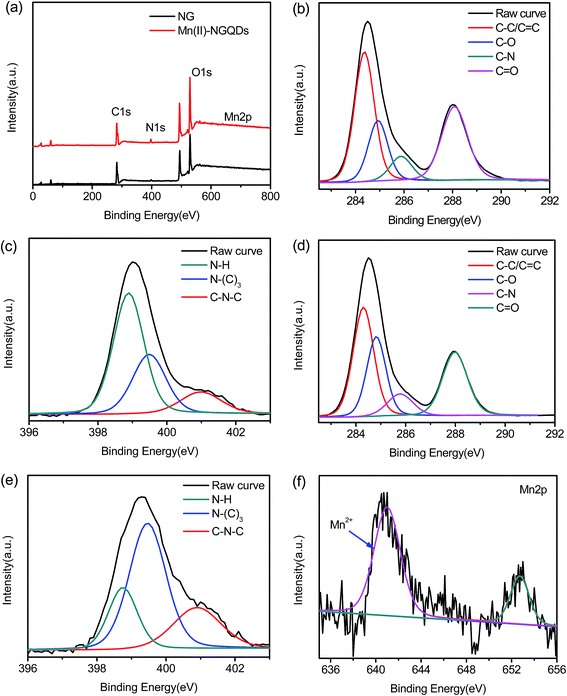 | ||
| Fig. 4 (a) XPS survey spectra of Mn(II)-NGQDs and NG; (b) C 1s and (c) N 1s region of Mn(II)-NGQDs, (d) C 1s and (e) N 1s region of NG; XPS high resolution of (f) Mn 2p. | ||
Optical properties
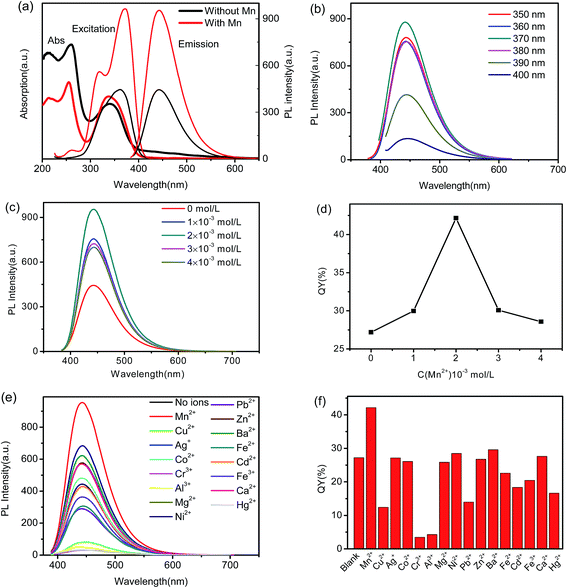
In order to investigate the optical properties of the as-prepared Mn(II)-NGQDs, the excitation, emission and UV-vis absorption spectra were studied and the results are given in Fig. 5a. The UV-vis absorption spectrum of Mn(II)-NGQDs shows two main absorption peaks: one peak centered at 260 nm is attributed to π–π* transition of C–C band, and the other centered at 340 nm can be ascribed to the n–π* transition of C–N and C![[double bond, length as m-dash]](https://www.rsc.org/images/entities/char_e001.gif) O groups.44 NG and other M–NG also display the two peaks which are similar to Mn(II)-NGQDs (Fig. S4, ESI†). As shown in Fig. 5a, the maximum excitation wavelength (370 nm) of Mn(II)-NGQDs gets a red shift than the UV-vis absorption band (340 nm), which can be ascribed to a distribution of the deferent surface energy traps of the carbon dots. The emission wavelength (λem = 443) of Mn(II)-NGQDs has no obvious change, compared with NG, but the fluorescence intensity of Mn(II)-NGQDs shows much stronger than that of NG. Fig. 5b shows that the emission spectra of Mn(II)-NGQDs have an excitation independent feature as the excitation wavelength gradually increases from 350–400 nm, with the maximum excitation wavelength and the maximum emission wavelength at 370 and 443 nm, respectively. The excitation independent phenomenon were also observed in previous reported,19,22 which may be due to the uniform size of Mn(II)-NGQDs and the unitary PL process of n–π* transition of the aromatic N in Mn(II)-NGQDs. Fig. 5c and d show the emission spectra and QY of Mn(II)-NGQDs with different concentrations of Mn2+ ion in reaction system under the excitation wavelength of 370 nm. The results indicate that the strongest synergistic effect with functional groups in reaction systems appears at the concentration Mn2+ ion of 2 × 10⁻³ mol L−1. The highest fluorescence QY of the obtained Mn(II)-NGQDs was determined to be 42.16%, which is much higher than that of NG (27.06%) and the previous report of N-GQDs (28.10%).39 This implied that the induced Mn2+ into NG significantly enhanced the fluorescence QY of NG.
O groups.44 NG and other M–NG also display the two peaks which are similar to Mn(II)-NGQDs (Fig. S4, ESI†). As shown in Fig. 5a, the maximum excitation wavelength (370 nm) of Mn(II)-NGQDs gets a red shift than the UV-vis absorption band (340 nm), which can be ascribed to a distribution of the deferent surface energy traps of the carbon dots. The emission wavelength (λem = 443) of Mn(II)-NGQDs has no obvious change, compared with NG, but the fluorescence intensity of Mn(II)-NGQDs shows much stronger than that of NG. Fig. 5b shows that the emission spectra of Mn(II)-NGQDs have an excitation independent feature as the excitation wavelength gradually increases from 350–400 nm, with the maximum excitation wavelength and the maximum emission wavelength at 370 and 443 nm, respectively. The excitation independent phenomenon were also observed in previous reported,19,22 which may be due to the uniform size of Mn(II)-NGQDs and the unitary PL process of n–π* transition of the aromatic N in Mn(II)-NGQDs. Fig. 5c and d show the emission spectra and QY of Mn(II)-NGQDs with different concentrations of Mn2+ ion in reaction system under the excitation wavelength of 370 nm. The results indicate that the strongest synergistic effect with functional groups in reaction systems appears at the concentration Mn2+ ion of 2 × 10⁻³ mol L−1. The highest fluorescence QY of the obtained Mn(II)-NGQDs was determined to be 42.16%, which is much higher than that of NG (27.06%) and the previous report of N-GQDs (28.10%).39 This implied that the induced Mn2+ into NG significantly enhanced the fluorescence QY of NG.
To further confirm that the enhanced PL indeed arises from the Mn2+-assisted process, the control experiments were carried out by utilizing other Mn salts to replace manganese chloride, including manganese acetate, manganese sulfate and manganese nitrate, the results show that they can still enhance the fluorescence (Fig. S5a, ESI†), indicating that Mn2+ plays a key role in the enhanced PL from the Mn(II)-NGQDs. Furthermore, holding any other factors constant, citric acid was chosen to replace citric sodium as carbon precursor to prepare Mn(II)-NGQDs and NG for comparison. The comparison experiment results show that, choosing citric acid as precursor for high quality fluorescent quantum dots is unsuitable (Fig. S5b, ESI†). This indicates that citric sodium precursor also plays an important role in the improved PL of Mn(II)-NGQDs.
The as-synthesized Mn(II)-NGQDs also exhibit a good stability (Fig. S5c, ESI†). The PL spectra of the Mn(II)-NGQDs are almost the same with the fresh Mn(II)-NGQDs after 7 days of storage under ambient conditions. In addition, the synergy process of Mn2+ ion with functional groups would also be influenced by the reaction temperature (Fig. S5d, ESI†) and time, the optimum hydrothermal temperature and time were considered as 180 °C and 10 hours, respectively.
Fig. 5e and f show the PL spectra and QYs of various M–NG. All of the other M–NG display a weaker emission behavior compared to Mn(II)-NGQDs (Fig. 5e). Fig. 5f indicates that the QYs of seven kinds of M′–NG (M′ = Ni2+, Mg2+, Zn2+, Ba2+, Co2+, Ag+ and Ca2+) are similar to that of NG, while other seven kinds of M′′–NG (M′′ = Cu2+, Cr2+, Cd2+, Fe2+, Fe3+, Al3+ and Pb2+) have much lower QYs than that of NG.
Why only the introduction of Mn2+ ion into NG can obviously enhance their fluorescence? The mechanism is conjectured as the follows: in the hydrothermal reaction of glycine and sodium citrate, parts of carboxyl groups of sodium citrate may not be carbonized and retain on the surface of NG. These carboxyl groups have high reactivity for further condensation and carbonization, that is why a large amount of irregular graphene nanosheets and some agglomeration were observed in NG samples without Mn2+ doping. These irregular graphene nanosheets and large particles would reduce the fluorescent emission behavior. However, in the reaction process of Mn(II)-NGQDs, Mn2+ ions can bond with functional groups such as carboxyl groups on the surface of NG. These bonded Mn2+ ions not only make NG lose reactivity for further condensation and carbonization, but also prevent the grain growth and agglomeration of the particles of NG. Therefore, the Mn(II)-NGQDs show well dispersed QDs with uniform size and shape, and exhibit a high QY than that of NG. It is notable that, compared to Mn2+, other metal ions (such as Fe2+, Co2+, Ni2+, Mg2+, Zn2+, Ba2+, Ag+ and Ca2+) do not display such confinement effect to control the shape and grain growth of NG. TEM images of NG doping with other metal ions display similar morphology to pure NG, some large irregular sheets and small QDs can be observed (Fig. S6, ESI†). All of these M–NG display weaker fluorescent emission than Mn(II)-NGQDs. This confirms our conjecture and indicates that Mn2+ plays a key role in the synthesis of Mn(II)-NGQDs with enhanced fluorescent properties.
Detection of Hg2+ ion
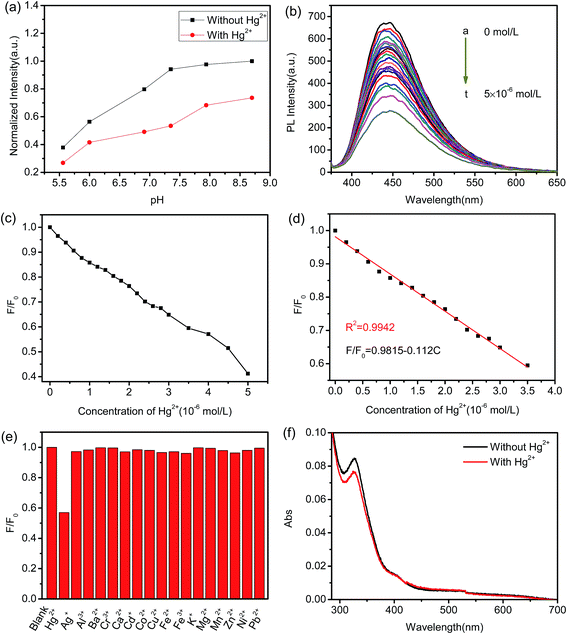
The surface characterization of Mn(II)-NGQDs clearly shows the feasibility of application as a fluorescent probe for metal ions detection, due to the homogeneous size distribution and excellent stable fluorescence properties. In this work, HMTA solution was chosen as the buffer to detect Hg(II) since it has been widely used in literature.45 Fig. 6a shows the fluorescence response of Mn(II)-NGQDs in the presence and absence of 4 × 10⁻⁶ mol L−1 Hg2+ in different pH values. From Fig. 6a, it can be observed that the fluorescence intensity of Mn(II)-NGQDs displays a remarkably quenching effect with the addition of Hg2+ in a pH range of 5.5 to 8.7. Moreover, the pH value of the solution affects not only the fluorescence intensity of Mn(II)-NGQDs but also the quenching efficiency. The fluorescence intensity of Mn(II)-NGQDs and quenching efficiency increase rapidly when the pH value increase from 5.5 to 8.0, and reach the maximum at the pH = 7.35 (Fig. 6a). However, an obvious decrease in quenching efficiency is observed when the pH value is higher than 7.35. Thus, it is clear that the quenching efficiency will decay in the acidic or alkaline conditions, and it is easier for Hg2+ ions to combine with Mn(II)-NGQDs and form a stable complex in neutral solution, which may be due to the weak protonated process of functional groups in the Mn(II)-NGQDs. Considering the highest quenching efficiency, the following experimental conditions are all set in a pH of 7.35.To discuss the sensitivity of Mn(II)-NGQDs as fluorescent probe for Hg2+ detection, the emission spectra of Mn(II)-NGQDs (λex = 370 nm) in the presence of different concentrations of Hg2+ ion (in the range of 0 to 5.0 × 10⁻⁶ mol L−1) were recorded and shown in Fig. 6b. A gradually decrease emission intensity at 443 nm is observed with the increase concentration of Hg2+ ion, implying that the fluorescence of Mn(II)-NGQDs solution is sensitive to Hg2+. As shown in Fig. 6c, the quenching efficiency (F/F0) displays a good linear response to the concentration of Hg2+ in the range of 0 to 3.5 × 10⁻⁶ mol L−1 (Fig. 6d). The linear equation is calculated to be F0/F = 0.9815–0.112 [Hg2+] (R2 = 0.9942), where F0 and F are emission intensities at 443 nm in the absence and presence of Hg2+ ion, respectively. Under this experiment condition, the limit of detection (LOD) for Hg2+ is calculated to be 3.4 × 10⁻⁸ mol L−1 by the 3δ/S (δ is the standard deviation of the lowest signal and S is the slope of linear calibration plot), which is much lower than most of other reported of common fluorescent probes (see Table S2, ESI†).46–50
The selectivity of the Mn(II)-NGQDs toward Hg2+ was also explored. Different metal ions such as Cu2+, Mn2+, Ag+, Pb2+, K+, Ba2+, Zn2+, Co2+, Hg2+, Al3+, Fe2+, Fe3+, Ni2+, Mg2+, Cd2+ and Hg2+ ions were added into the probe solution respectively, and the solution was analyzed after incubation of 10 min. The results in Fig. 6e manifest that these metal ions except Hg2+ ion have almost no interference on the fluorescence intensity of Mn(II)-NGQDs, the fluorescence intensity is apparently quenched only by Hg2+ ion. Therefore, the fluorescence sensor based on Mn(II)-NGQDs shows a higher selectivity for Hg2+ detection over the other metal ions. Similarly, the effects of non buffer (Milli-Q water) on the detection of Hg2+ were performed, the results show that Mn(II)-NGQDs also exhibit a highly selective and sensitive capability to Hg2+ in Milli-Q water (Fig. S7, ESI†), which is similar to that in the HMTA buffer.
To clarify whether the fluorescence quenching is a static or dynamic quenching process, the fluorescence decay characterization was conducted. Fig. S8 (ESI†) show the fluorescence decay profile of Mn(II)-NGQDs in the absence and presence of Hg2+ ions, respectively. The fluorescence decay profile of Mn(II)-NGQDs follows a single exponential fitting that indicated the presence of only one emitting species with lifetimes. However, the fluorescence decay profile of NG follows a tri-exponential fitting (Fig. S8, Table S3, ESI†), which indicates the presence of three emitting species with different lifetimes. It is possible due to the mixture of NG with nanosheets and QDs, which resulting a complex different lifetimes emission.51 The average lifetime of Mn(II)-NGQDs is 7.58 ns, which is shorter than that of NG (8.88 ns) and also support our point that the doping with Mn2+ can influence the morphology of NG. The lifetime data in Table S3 (ESI†) shows that the average lifetime of Mn(II)-NGQDs have not significantly change with the concentration increase of Hg2+ ions. It is indicated that the static quenching takes place during complex formation between Hg2+ ions and Mn(II)-NGQDs.52,53
The quenching effect can be attributed to the chelating reaction between the functional groups (such as carboxyl, hydroxyl and amino groups) on the surface of Mn(II)-NGQDs and Hg2+ ion, which can decelerate the radiative recombination of the exciton of n → π* transition through an effective electron transfer process, leading to the fluorescent quenching.54 In order to further understand the binding between Mn(II)-NGQDs and Hg2+, the UV absorption spectra of Mn(II)-NGQDs without Hg2+ and in the presence of Hg2+ (4.0 × 10⁻⁶ mol L−1) were recorded (Fig. 6f). The absorption peaks at 340 nm (due to the n → π* transition) for Mn(II)-NGQDs is remarkably declined in the presence of Hg2+, demonstrating the surface states of the quantum dots can be influenced by the binding of Mn(II)-NGQDs with Hg2+. This means that compared to other metal ions, Hg2+ ion shows a more powerful affinity and faster chelating toward the functional groups on the surface of the Mn(II)-NGQDs. In addition, the photoinduced electron transfer from conduction band to the state of Hg2+ would be located between the conduction band and valence band of Mn(II)-NGQDs, causing the fluorescence quenching. These results also indicate that the fluorescence quenching of Mn(II)-NGQDs by Hg2+ is a static quenching process.
Cellular toxicity and cell fluorescent imaging
In order to evaluate the potential biological imaging application of Mn(II)-NGQDs, the biocompatibility of Mn(II)-NGQDs was evaluated via incubating HepG2 cells with different concentrations of Mn(II)-NGQDs for 4 and 24 h, respectively. The survival quantity of HepG2 cells was calculated based on MTT cell-viability assay. As show in Fig. 7, the cell viabilities of HepG2 cells are all close to 100% in the tested period with the concentration of Mn(II)-NGQDs from 0 to 300 μg mL−1, and there are almost no changes of the cells viability values of HepG2 cells incubated by Mn(II)-NGQDs with various concentrations for 4 and 24 h. It is obvious that the Mn(II)-NGQDs have no cytotoxicity to HepG2 cells. In addition, the zeta potential of Mn(II)-NGQDs and NG was also explored (Fig. S9, ESI†). Compared with NG (−15.2 eV), Mn(II)-NGQDs exhibit a more negative potential value (−19.7 eV), which indicates that Mn(II)-NGQDs will be more stable and efficiently internalized by cells.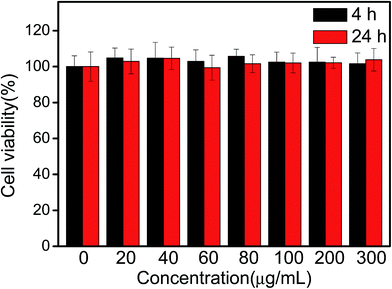 | ||
| Fig. 7 Cell viability of HepG2 cells after incubation with Mn(II)-NGQDs (0–300 μg mL−1) for 4 and 24 h, respectively. | ||
The utilization of Mn(II)-NGQDs in cellular imaging was also investigated by confocal laser scanning microscopy (CLSM) observation. As shown in Fig. 8, the obvious blue fluorescent signal can be observed in the cytoplasm of Raw264.7 (Fig. 8a1) and HepG2 cells (Fig. 8b1) incubated with Mn(II)-NGQDs at a concentration of 40 μg mL−1 for 3 h, indicating that the Mn(II)-NGQDs can be efficiently internalized by Raw264.7 and HepG2 cells and facilely enter into the cells for efficiency cell imaging.55,56 Moreover, both the Raw264.7 (Fig. 8a2) and HepG2 cells (Fig. 8b2) incubated with Mn(II)-NGQDs still kept their normal morphology and strongly adhered onto cell plates, revealing the good biocompatibility of Mn(II)-NGQDs. Thus, the Mn(II)-NGQDs can be served as an efficient and non-toxic and fluorescence bioimaging probe for various biomedical applications.
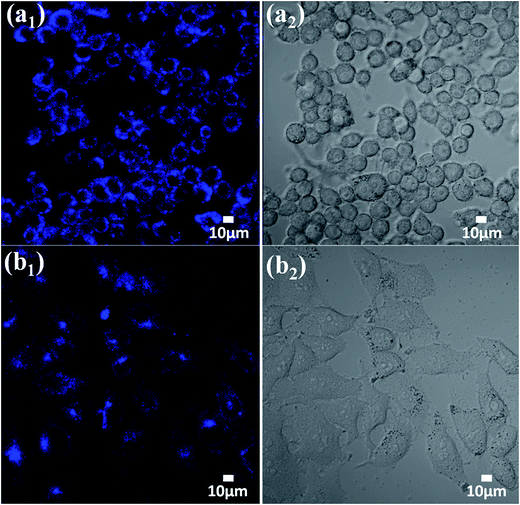 | ||
| Fig. 8 CLSM images and bright field of Raw264.7 mouse macrophages (a1; a2) and HepG2 human liver cancer cells (b1; b2) incubated with Mn(II)-NGQDs (40 μg mL−1) for 3 h by excitation at 405 nm. | ||
Conclusion
In conclusion, we have demonstrated a simple and feasible synthesis strategy to prepare fluorescent Mn(II)-NGQDs through hydrothermal carbonization of glycine and sodium citrate with Mn2+ as modifier. The resulted Mn(II)-NGQDs display the morphology with uniform size and good dispersion, and show enhanced fluorescent compared with NG and NG doped with other common metal ions. The Mn(II)-NGQDs can be utilized directly as a fluorescent probe for highly sensitive and selective detection of Hg2+ ions. Confinement effect and radiative recombination mechanism were used to explained the fluorescence enhancement and quenching, respectively. The water-soluble Mn(II)-NGQDs also show low cytotoxicity, superior brightness and high photostability for fluorescence live cell imaging. This work may provide a strategic approach for preparing high-quality fluorescent GQDs to meet the requirement of multifunctional application.Conflicts of interest
There are no conflicts to declare.Acknowledgements
This work was financially supported by the National Natural Science Foundation of China (No. 51564009, 51468011) and the Natural Science Foundation of Guangxi Province (No. 2015GXNSFDA139035).References
- J. Liu, H. Xu, Y. Xu, Y. Song, J. Lian, Y. Zhao, L. Wang, L. Huang, H. Ji and H. Li, Appl. Catal., B, 2017, 207, 429–437 CrossRef CAS.
- A. Subramanian, Z. Pan, G. Rong, H. Li, L. Zhou, W. Li, Y. Qiu, Y. Xu, Y. Hou, Z. Zheng and Y. Zhang, J. Power Sources, 2017, 343, 39–46 CrossRef CAS.
- D. H. Kim and T. W. Kim, Nano Energy, 2017, 32, 441–447 CrossRef CAS.
- L. Wang, W. Li, B. Wu, Z. Li, D. Pan and M. Wu, Chem. Eng. J., 2017, 309, 374–380 CrossRef CAS.
- L. Chen, G. Yang, P. Wu and C. Cai, Biosens. Bioelectron., 2017, 96, 294–299 CrossRef CAS PubMed.
- L. Li, G. Wu, G. Yang, J. Peng, J. Zhao and J. J. Zhu, Nanoscale, 2013, 5, 4015–4039 RSC.
- T. F. Yeh, W. L. Huang, C. J. Chung, I. T. Chiang, L. C. Chen, H. Y. Chang, W. C. Su, C. Cheng, S. J. Chen and H. Teng, J. Phys. Chem. Lett., 2016, 7, 2087–2092 CrossRef CAS PubMed.
- Y. Zhang, H. Gao, J. Niu and B. Liu, New J. Chem., 2014, 38, 4970–4974 RSC.
- T. F. Yeh, C. Y. Teng, S. J. Chen and H. Teng, Adv. Mater., 2014, 26, 3297–3303 CrossRef CAS PubMed.
- M. Zhang, L. Bai, W. Shang, W. Xie, H. Ma, Y. Fu, D. Fang, H. Sun, L. Fan, M. Han, C. Liu and S. Yang, J. Mater. Chem., 2012, 22, 7461 RSC.
- A. H. Castro Neto, F. Guinea, N. M. R. Peres, K. S. Novoselov and A. K. Geim, Rev. Mod. Phys., 2009, 81, 109–162 CrossRef CAS.
- Z. Fan, S. Li, F. Yuan and L. Fan, RSC Adv., 2015, 5, 19773–19789 RSC.
- Y. Zhou, X. Jing and Y. Chen, J. Mater. Chem. B, 2017, 5, 6451–6470 RSC.
- B. Shi, Y. Su, L. Zhang, M. Huang, X. Li and S. Zhao, Nanoscale, 2016, 8, 10814–10822 RSC.
- A. Muthurasu, P. Dhandapani and V. Ganesh, New J. Chem., 2016, 40, 9111–9124 RSC.
- Q. Zhuang, Y. Wang and Y. Ni, Luminescence, 2016, 31, 746–753 CrossRef CAS PubMed.
- T. V. Tam, N. B. Trung, H. R. Kim, J. S. Chung and W. M. Choi, Sens. Actuators, B, 2014, 202, 568–573 CrossRef CAS.
- T. Alizadeh and M. Shokri, Sens. Actuators, B, 2016, 222, 728–734 CrossRef CAS.
- Y. Dong, J. Shao, C. Chen, H. Li, R. Wang, Y. Chi, X. Lin and G. Chen, Carbon, 2012, 50, 4738–4743 CrossRef CAS.
- W. Zhang and J. Gan, Appl. Surf. Sci., 2016, 372, 145–151 CrossRef CAS.
- H. X. Zhao, Y. C. Wang, L. Y. Zhang and M. Wang, New J. Chem., 2015, 39, 98–101 RSC.
- S. Yang, J. Sun, C. Zhu, P. He, Z. Peng and G. Ding, Analyst, 2016, 141, 1052–1059 RSC.
- U. Baruah and D. Chowdhury, Nanotechnology, 2016, 27, 145501 CrossRef PubMed.
- S. Kundu, R. M. Yadav, T. N. Narayanan, M. V. Shelke, R. Vajtai, P. M. Ajayan and V. K. Pillai, Nanoscale, 2015, 7, 11515–11519 RSC.
- H. Xu, S. Zhou, L. Xiao, Q. Yuan and W. Gan, RSC Adv., 2016, 6, 36554–36560 RSC.
- X. Zhu, G. Wu, N. Lu, X. Yuan and B. Li, J. Hazard. Mater., 2017, 324, 272–280 CrossRef CAS PubMed.
- S. Vempati, A. Celebioglu and T. Uyar, Nanoscale, 2015, 7, 16110–16118 RSC.
- G. S. Kumar, R. Roy, D. Sen, U. K. Ghorai, R. Thapa, N. Mazumder, S. Saha and K. K. Chattopadhyay, Nanoscale, 2014, 6, 3384–3391 RSC.
- S. H. Jin, D. H. Kim, G. H. Jun, S. H. Hong and S. Jeon, ACS Nano, 2013, 7, 1239–1245 CrossRef CAS PubMed.
- K. Paek, H. Yang, J. Lee, J. Park and B. J. Kim, ACS Nano, 2014, 8, 2848–2856 CrossRef CAS PubMed.
- Z. Gan, H. Xu and Y. Hao, Nanoscale, 2016, 8, 7794–7807 RSC.
- C. A. T. Toloza, S. Khan, R. L. D. Silva, E. C. Romani, D. G. Larrude, S. R. W. Louro, F. L. Freire and R. Q. Aucélio, Microchem. J., 2017, 133, 448–459 CrossRef CAS.
- D. Yu, X. Zhang, Y. Qi, S. Ding, S. Cao, A. Zhu and G. Shi, Sens. Actuators, B, 2016, 235, 394–400 CrossRef CAS.
- C. Han, H. Xu, R. Wang, K. Wang, Y. Dai, Q. Liu, M. Guo, J. Li and K. Xu, J. Mater. Chem. B, 2016, 4, 5798–5802 RSC.
- X. Guo, C. F. Wang, Z. Y. Yu, L. Chen and S. Chen, Chem. Commun., 2012, 48, 2692–2694 RSC.
- T. F. Yeh, F. F. Chan, C. T. Hsieh and H. Teng, J. Phys. Chem. C, 2011, 115, 22587–22597 CAS.
- H. Abdolmohammad-Zadeh and E. Rahimpour, Sens. Actuators, B, 2016, 225, 258–266 CrossRef CAS.
- B. Karimi and B. Ramezanzadeh, J. Colloid Interface Sci., 2017, 493, 62–76 CrossRef CAS PubMed.
- Z. Yan, X. Qu, Q. Niu, C. Tian, C. Fan and B. Ye, Anal. Methods, 2016, 8, 1565–1571 RSC.
- L. Li, L. Li, C. Wang, K. Liu, R. Zhu, H. Qiang and Y. Lin, Microchim. Acta, 2014, 182, 763–770 CrossRef.
- J. Gliniak, J. H. Lin, Y. T. Chen, C. R. Li, E. Jokar, C. H. Chang, C. S. Peng, J. N. Lin, W. H. Lien, H. M. Tsai and T. K. Wu, ChemSusChem, 2017, 10, 3260–3267 CrossRef CAS PubMed.
- E. Yazici, S. Yanik and M. B. Yilmaz, Carbon, 2017, 111, 822–827 CrossRef CAS.
- Z. X. Gan, S. J. Xiong, X. L. Wu, C. Y. He, J. C. Shen and P. K. Chu, Nano Lett., 2011, 11, 3951–3956 CrossRef CAS PubMed.
- Y. Liu, C. Y. Liu and Y. Liu, Appl. Surf. Sci., 2011, 257, 5513–5518 CrossRef CAS.
- P. Hou, Y. Long, J. Zhao, J. Wang and F. Zhou, Spectrochim. Acta, Part A, 2012, 86, 76–79 CrossRef CAS PubMed.
- Z. Xiaoyan, L. Zhangyi and L. Zaijun, Spectrochim. Acta, Part A, 2017, 171, 415–424 CrossRef CAS PubMed.
- X. Zuo, H. Zhang, Q. Zhu, W. Wang, J. Feng and X. Chen, Biosens. Bioelectron., 2016, 85, 464–470 CrossRef CAS PubMed.
- Z. Wu, M. Feng, X. Chen and X. Tang, J. Mater. Chem. B, 2016, 4, 2086–2089 RSC.
- R. Zhang and W. Chen, Biosens. Bioelectron., 2014, 55, 83–90 CrossRef CAS PubMed.
- J. He, H. Zhang, J. Zou, Y. Liu, J. Zhuang, Y. Xiao and B. Lei, Biosens. Bioelectron., 2016, 79, 531–535 CrossRef CAS PubMed.
- S. Barman and M. Sadhukhan, J. Mater. Chem. C, 2012, 22, 21832 RSC.
- Y. Zhang, P. Cui, F. Zhang, X. Feng, Y. Wang, Y. Yang and X. Liu, Talanta, 2016, 152, 288–300 CrossRef CAS PubMed.
- Y. Wang, Q. Chang and S. Hu, Sens. Actuators, B, 2017, 253, 928–933 CrossRef CAS.
- X. Mao, H. Su, D. Tian, H. Li and R. Yang, ACS Appl. Mater. Interfaces, 2013, 5, 592–597 CAS.
- Z. Fan, Y. Li, X. Li, L. Fan, S. Zhou, D. Fang and S. Yang, Carbon, 2014, 70, 149–156 CrossRef CAS.
- F. Yuan, L. Ding, Y. Li, X. Li, L. Fan, S. Zhou, D. Fang and S. Yang, Nanoscale, 2015, 7, 11727–11733 RSC.
Footnote |
| † Electronic supplementary information (ESI) available. See DOI: 10.1039/c7ra12133d |
| This journal is © The Royal Society of Chemistry 2018 |


