DOI:
10.1039/C7RA11427C
(Paper)
RSC Adv., 2018,
8, 22-27
A copper–manganese composite oxide as QCM sensing layers for detection of formaldehyde gas
Received
16th October 2017
, Accepted 12th December 2017
First published on 19th December 2017
Abstract
A copper–manganese composite oxide was synthesized by controlling the molar ratio of Cu to Mn and calcination temperature. Scanning electron microscopy, transmission electron microscopy, X-ray diffraction, and nitrogen adsorption–desorption measurements were employed to characterize the obtained products. The as-prepared copper–manganese composite oxide functionalized QCM resonators were fabricated and explored for HCHO sensing. The copper–manganese composite oxide functionalized QCM resonators had a significant response to HCHO, and the sensitivity of the resonators reached 6.35 Hz (μg ppm)−1. Neither the response nor the sensing profile observed significant changes after 60 days. The linear equation between the response of the QCM resonator and HCHO concentration endows the copper–manganese composite oxide functionalized QCM resonators with a capability of HCHO quantitative analysis. The adsorption–desorption process via hydrogen bonding between the oxygen of the copper–manganese composite oxide and HCHO molecules may be a plausible sensing mechanism for HCHO sensing.
1. Introduction
Formaldehyde (HCHO) emits from widely used building and decorative materials, oil paints and textiles. It is one of the most dominant and best-known air pollutants in an indoor environment. HCHO can cause irritation to the eyes, nose, and throat, even at low levels for short periods. Longer exposure or a higher dose can cause coughing, choking, nasopharyngeal cancer and leukemia. Severe exposure can cause death from throat swelling or from chemical burns to the lungs.1,2 Therefore, it is important and highly desired to detect any possible presence of HCHO. Actually, many techniques have been utilized to detect HCHO gas, such as UV-VIS spectrophotometry, gas chromatography-mass spectrometry and high-performance liquid chromatography. However, these instrumental analysis methods are generally costly, time-consuming and cannot be used for on-site detection. Some chemical sensors, potentiometric sensors, electrochemical sensors and piezoelectric sensors have also been used to detect HCHO gas.3–10 Until now, it has still been challenging to determine HCHO on-site in a real time manner with high sensing properties, such as fast response, high sensitivity, good reproducibility and stability.
Quartz crystal microbalance (QCM) could measure nanogram-order changes in mass loading on the quartz crystal surface by observation of frequency shift based on the Sauerbrey equation. QCM has attracted considerable interest in the area of chemical sensing because of its many advantages such as low cost, easy installation and inherent ability to monitor analytes in situ and real time.11–18 Thus far, how to modify resonator surface properties becomes an essential issue for enhancing the range of application of QCM sensors. Recently, nanostructured composite metal oxides, which have different constituent parts, oxidation states and coordination numbers, are especially interesting due to their unique thermal, optical, electronic, photonic, catalytic and sensing properties.19–24 Among them, copper–manganese composite oxide is interesting and was exploited for application as catalyst (Hopcalite) for the conversion of carbon monoxide to carbon dioxide. Hopcalite catalysts are also used to remove ethylene oxide and other VOCs. The active sites of copper–manganese composite oxide could adsorb and catalyze vaporized molecules at room temperature. In fact, copper–manganese composite oxide has been extensively studied as catalyst. There are very limited studies using copper–manganese composite oxide as sensing material. To our best knowledge, however, copper–manganese composite oxide has not yet been explored so far as sensing media on QCM for detection of HCHO. In the current work, we synthesized copper–manganese composite oxide, from which copper–manganese composite oxide functionalized QCM resonators were fabricated and explored for HCHO sensing.
2. Experimental
2.1 Materials
Copper nitrate, manganese acetate and absolute ethanol were purchased from Beijing Chemical Works. All chemicals were analytic grade, and were used without further purification. Ultrapure water with a resistivity higher than 18.2 MΩ cm was used in all experiments and obtained from a three-stage Millipore Mill-Q purification system.
2.2 Preparation and characterization of copper–manganese composite oxide
In a typical preparation, 0.49 g of Mn(CH3COO)2·4H2O, 0.32 g of KMnO4 and 0.24 g of Cu(NO3)2·3H2O were first dissolved in three volumes of pure water (20 mL), respectively. Then the aqueous KMnO4 was slowly added into the aqueous Mn(CH3COO)2 under vigorous stirring at room temperature, followed by addition of the aqueous Cu(NO3)2 into the above solution. The molar ratio of Cu2+ to Mn2+ was controlled at 1![[thin space (1/6-em)]](https://www.rsc.org/images/entities/char_2009.gif) :2. The mixture was continually stirred for 24 h, and then incubated for 2 h. The precipitate was isolated by centrifugation, and washed many times with pure water and absolute ethanol. Then the obtained sample was dried at 60 °C for 24 h. Finally, the sample was calcinated at 300 °C for 3 h, and a black powder product was collected.
:2. The mixture was continually stirred for 24 h, and then incubated for 2 h. The precipitate was isolated by centrifugation, and washed many times with pure water and absolute ethanol. Then the obtained sample was dried at 60 °C for 24 h. Finally, the sample was calcinated at 300 °C for 3 h, and a black powder product was collected.
X-ray diffraction (XRD) patterns of copper–manganese composite oxide powders were recorded on a Bruker D8 Focus X-ray diffractometer (Germany) using Cu Kα radiation (λ = 0.1542 nm) operated at 40 kV and 40 mA. The specific surface areas of copper–manganese composite oxide products were determined by nitrogen adsorption–desorption measurements on a QuadraSorb SI automated surface area and pore size analyzer (Quantachrome Instruments, USA). Scanning electron microscopy (SEM) observations were carried out on a Hitachi S-4800 field emission scanning electron microscope (Japan). Transmission electron microscopy (TEM) observations were performed on a JEOL 2100 transmission electron microscope at an acceleration voltage of 200 kV (Japan).
2.3 Fabrication and measurement of QCM resonators
A drop-coating method was used to coat both sides (5 mm in diameter) of a silver-coated QCM resonator (9 MHz, AT-cut piezoelectric quartz crystal, Beijing Chenjing Electronics Co., China). In a typical procedure, 4 mg of the as-prepared copper–manganese composite oxide was dispersed homogeneously in 2 mL pure water, and 7 μL of the obtained suspension was dropped onto the surface of silver electrode by using a micro-syringe. The QCM resonators with copper–manganese composite oxide thin films were quickly dried at 60 °C.
Sensing properties were examined by placing copper–manganese composite oxide functionalized QCM resonators in a glass chamber inside of an incubator where temperature (20 °C) and relative humidity were accurately controlled by drying tower (activated carbons and molecular sieves). A dynamic gas-mixing apparatus was used to steadily generate gas containing HCHO of low concentration. The gas concentration was controlled by regulating the gas flow through mass flow controllers. A four-way valve was applied to switch between air flow and diluted HCHO flow. Frequency shifts were recorded by an Agilent 53131A universal counter linked to a computer.
3. Results and discussion
3.1 Characterization of copper–manganese composite oxide
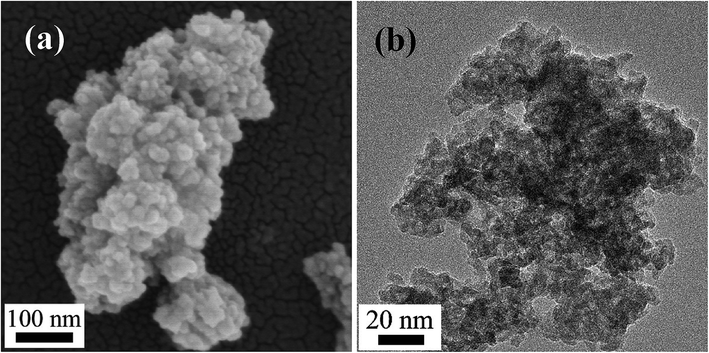
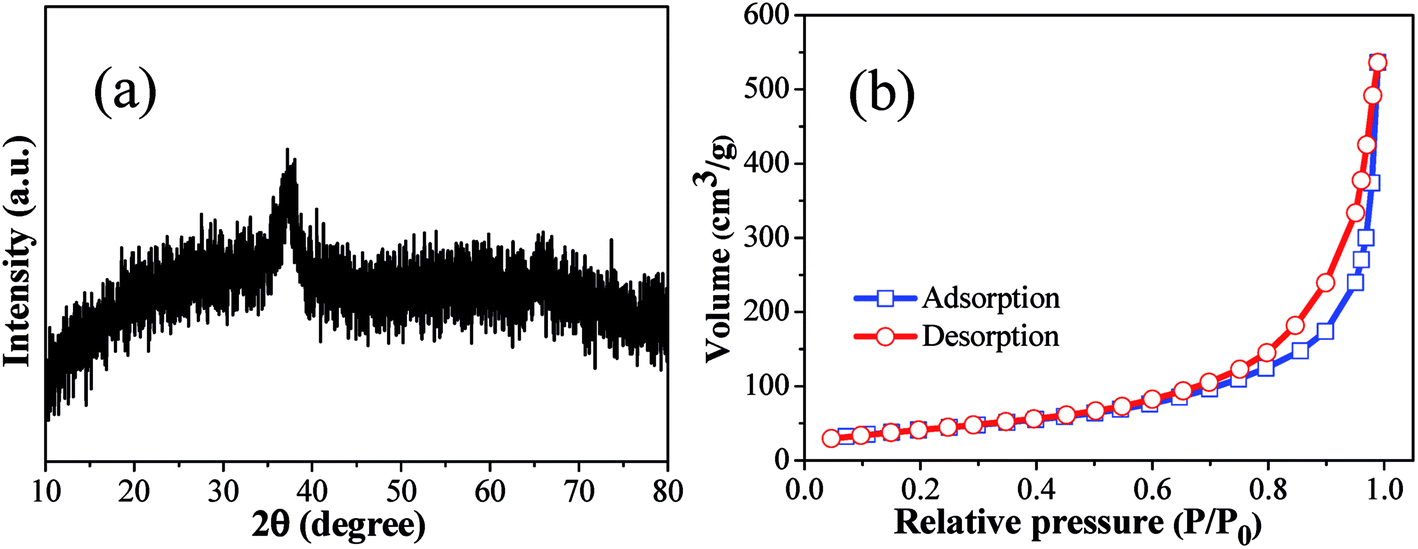
The morphological structures of as-prepared products were investigated by using SEM and TEM (Fig. 1). Clearly, the as-prepared copper–manganese composite oxide consists of aggregates of nanoparticles. The phase analysis of as-prepared product was carried out by XRD. As shown in Fig. 2a, the as-prepared copper–manganese composite oxide was amorphous. Nitrogen physisorption represents the most widely used technique to measure catalyst surface area. By nitrogen adsorption–desorption measurement (Fig. 2b), the specific surface areas of as-prepared copper–manganese composite oxide was measured to be 150 m2 g−1.
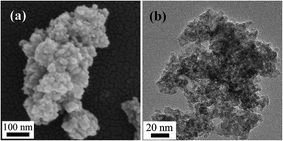 |
| | Fig. 1 SEM (a) and TEM (b) images of as-prepared copper–manganese composite oxide. | |
 |
| | Fig. 2 XRD patterns (a) and N2 adsorption–desorption isotherm (b) of as-prepared copper–manganese composite oxide. | |
3.2 Sensing properties of copper–manganese composite oxide functionalized QCM resonators
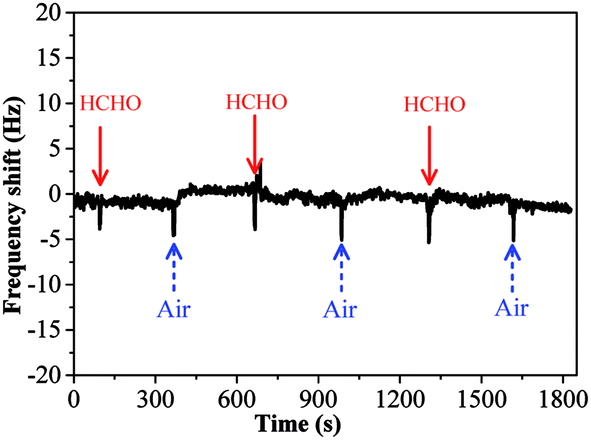
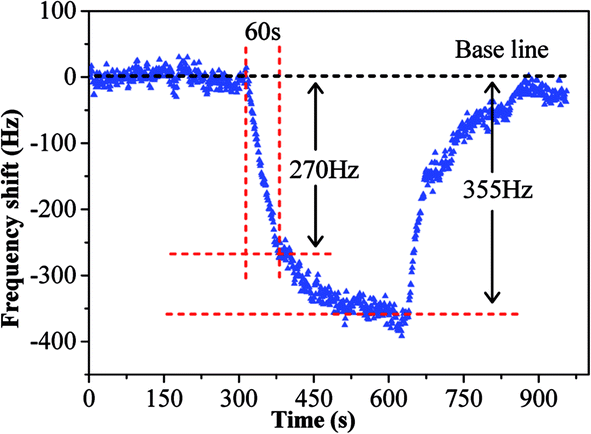
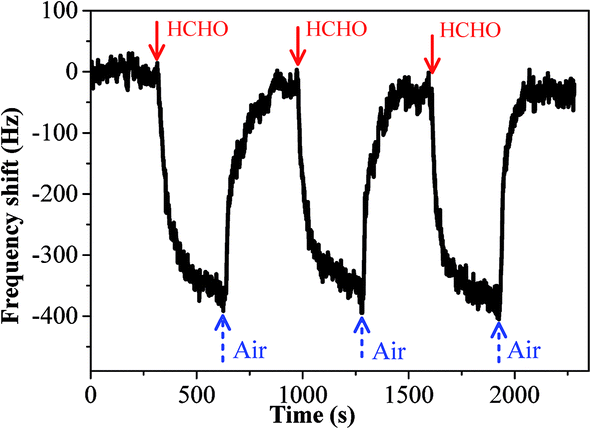
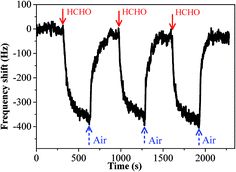
The sensing performance of copper–manganese composite oxide functionalized QCM resonators were examined by placing them in a glass chamber, and the concentration of HCHO was controlled at 0.3–1.7 ppm. An unmodified silver-coated QCM resonator was also tested as control for comparison (Fig. 3). While the red solid arrow indicates the time at which air containing 1.7 ppm HCHO was introduced into the testing chamber, the blue dashed arrow indicates the time at which air started to flush the testing chamber. Clearly, the unmodified silver-coated QCM resonator had no response to HCHO. Fig. 4 shows a response curve of a copper–manganese composite oxide functionalized QCM resonator under otherwise identical conditions. The coating amount on QCM resonator was 25 μg according to the Sauerbrey equation. Compared with the unmodified silver-coated QCM resonator, the copper–manganese composite oxide functionalized QCM resonator had a significant response to HCHO of 1.7 ppm. When air containing 1.7 ppm HCHO was introduced into the testing chamber, the QCM frequency began to decrease. The frequency shift initially decreased rapidly, reaching −270 Hz in 60 s. Then, the frequency shift decreased less rapidly, reaching −355 Hz at equilibrium state. The sensitivity of sensing film functionalized QCM resonator is assessed by the ratio of (frequency shift at 60 s of HCHO exposure)/(coating amount)/(HCHO concentration). And the sensitivity of copper–manganese composite oxide functionalized QCM resonator is 6.35 Hz (μg ppm)−1, which is ca. 3 times as high as that of graphene oxide functionalized QCM resonator (2.09 Hz (μg ppm)−1).18 When the testing chamber was flushed by air, the frequency shift was basically recovered. Fig. 5 shows profiles of frequency shift of as-prepared copper–manganese composite oxide functionalized QCM resonator upon exposure to air containing 1.7 ppm HCHO at 20 °C in three continuous cycles. The response curves are similar for these three continuous cycles with nearly no changes in response, response time and recovery time, indicating good reproducibility of the copper–manganese composite oxide functionalized QCM resonator.
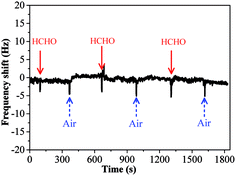 |
| | Fig. 3 Profiles of frequency shift of unmodified silver-coated QCM resonator upon exposure to air containing 1.7 ppm HCHO at 20 °C. | |
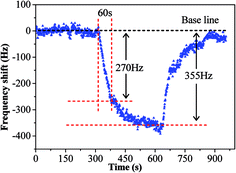 |
| | Fig. 4 Profile of frequency shift of as-prepared copper–manganese composite oxide functionalized QCM resonator upon exposure to air containing 1.7 ppm HCHO at 20 °C (coating amount: 25 μg). | |
 |
| | Fig. 5 Profiles of frequency shift of as-prepared copper–manganese composite oxide functionalized QCM resonator upon exposure to air containing 1.7 ppm HCHO at 20 °C in three continuous cycles (coating amount: 25 μg). | |
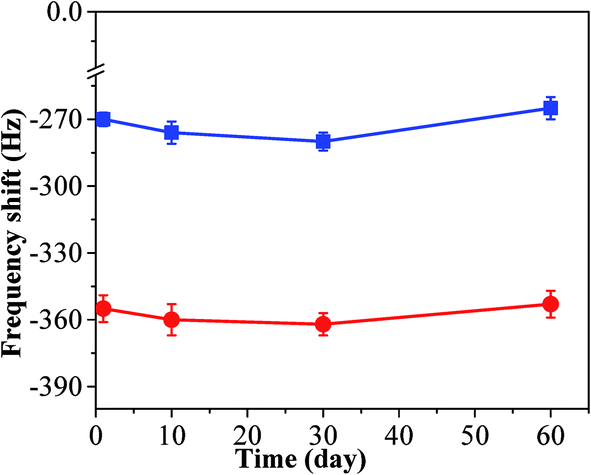
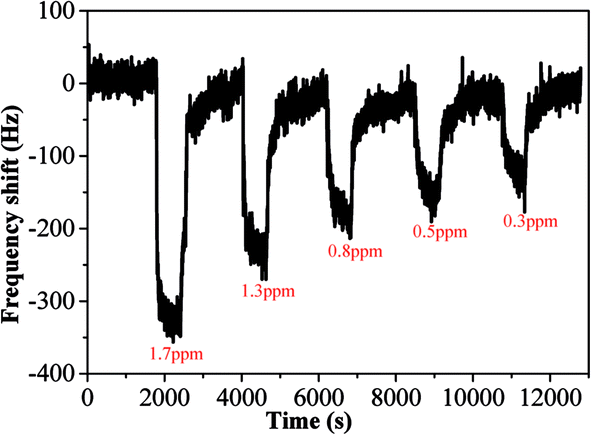
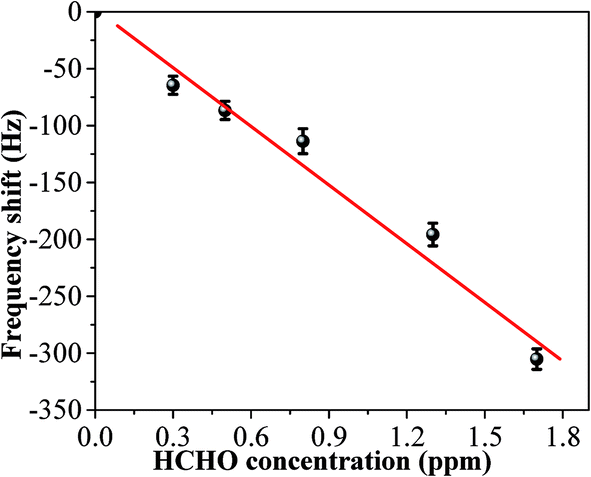
In order to test its long time stability, the copper–manganese composite oxide functionalized QCM was also tested 10 days, 30 days and 60 days, respectively, after fabrication (coating amount: 25 μg). As shown in Fig. 6, the frequency shifts taken at 60 s after exposure to HCHO were −276 ± 5 Hz (10 days), −280 ± 4 Hz (30 days) and −265 ± 5 Hz (60 days), respectively, and the frequency shifts taken at equilibrium state after exposure to HCHO were −360 ± 7 Hz (10 days), −362 ± 5 Hz (30 days) and −353 ± 6 Hz (60 days), respectively. No significant changes were observed either for the sensing profile, indicating that the sensing characteristics of copper–manganese composite oxide functionalized QCM resonator is quite stable in an extended period of time. Fig. 7 displays the response curves of copper–manganese composite oxide functionalized QCM resonator (coating amount: 25 μg) upon exposure to HCHO of varied concentrations. When HCHO of 1.7 ppm, 1.3 ppm, 0.8 ppm, 0.5 ppm and 0.3 ppm, respectively, were introduced into the testing chamber, the frequency shifts of copper–manganese composite oxide functionalized QCM resonator was recorded, and all responses were similar in shape, and the response of QCM resonator decreases in proportion to the decrease of HCHO concentration. The frequency shifts 60 s after exposure to HCHO were plotted against the corresponding HCHO concentrations, giving a linear relationship in the concentration range of 0–1.7 ppm. A linear equation was derived as follows (Fig. 8):
where ΔF is the frequency shift 60 s after exposure to HCHO (Hz),
c is the HCHO concentration (ppm),
r is regression coefficient. The liner equation could be used for quantitative analysis of HCHO based on the copper–manganese composite oxide functionalized QCM resonator. Selectivity is an important factor for sensors in practical applications. It was investigated by exposing the copper–manganese composite oxide functionalized QCM resonator to a variety of common volatile chemicals (ethanol, toluene,
para-xylene and acetone) under otherwise identical conditions for formaldehyde.
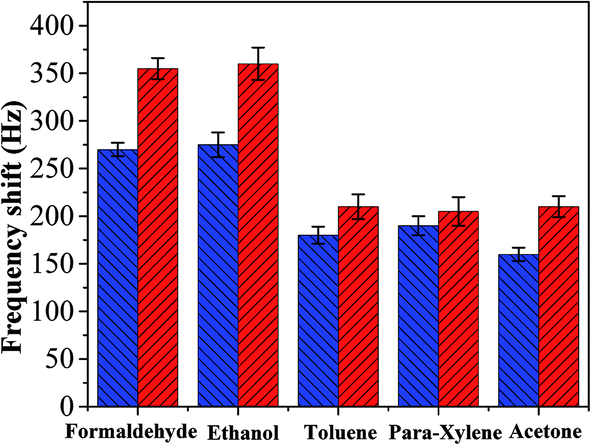
Fig. 9 shows the frequency shifts of copper–manganese composite oxide functionalized QCM resonator upon exposure to HCHO (1.7 ppm), ethanol (0.3 ppm), toluene (0.2 ppm),
para-xylene (0.5 ppm) and acetone (1.4 ppm) at 60 s (blue column) and equilibrium state (red column), respectively. The copper–manganese composite oxide functionalized QCM resonator shows very near responses to formaldehyde and ethanol. Thus, ethanol may be an interference factor in the detection of formaldehyde for the copper–manganese composite oxide functionalized QCM resonator.
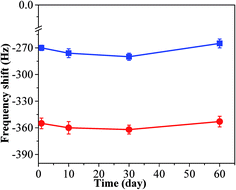 |
| | Fig. 6 Frequency shifts taken at 60 s (blue square) and saturation state (red dot) after exposure to air containing 1.7 ppm HCHO at 20 °C (coating amount: 25 μg) 0, 10, 30 and 60 days, respectively, after fabrication. | |
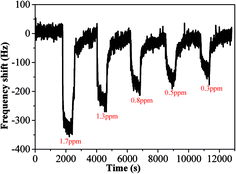 |
| | Fig. 7 Profiles of frequency shift of as-prepared copper–manganese composite oxide functionalized QCM resonator upon exposure to HCHO gas of varied concentrations at 20 °C (coating amount: 25 μg). | |
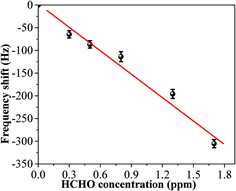 |
| | Fig. 8 Linear relationship between response and HCHO concentration at 20 °C (coating amount: 25 μg). Frequency shifts taken 60 s after exposure to HCHO were used as responses. | |
 |
| | Fig. 9 Frequency shifts of as-prepared copper–manganese composite oxide functionalized QCM resonator upon exposure to HCHO, ethanol, toluene, para-xylene and acetone (frequency shifts at 60 s: blue column; frequency shifts at equilibrium state: red column). | |
The interaction that occurred between the mass sensitive chemical sensor surface and vaporized analyte molecules can be attributed to the sorption mechanism of gas molecules on the surface.25,26 The sorption corresponds to condensation of vaporized molecules on the surface by intermolecular forces, such as hydrogen bonding and van-der-Waals interactions. On the basis of analyses of our experimental results, the sensing mechanism of copper–manganese composite oxide functionalized QCM resonator to HCHO belongs to the sorption process. There are many oxygen atoms on the surface of copper–manganese composite oxide.27,28 As shown in Scheme 1, when HCHO was introduced into the testing chamber, it was adsorbed on the oxygen of copper–manganese composite oxide via hydrogen bonding, the total mass on QCM resonator increased, and thus a negative frequency shift was observed according to the Sauerbrey equation. When the testing chamber was flushed by air, the adsorbed HCHO was desorbed from the copper–manganese composite oxide, and thus the frequency shift recovered. These processes are reversible, which brings the excellent reproducibility of copper–manganese composite oxide functionalized QCM resonator. Similar interactions occur between copper–manganese composite oxide and ethanol or acetone, and van-der-Waals interactions with toluene or para-xylene. The copper–manganese composite oxide functionalized QCM resonator also showed similar responses to these analytes. Thus, these analytes could be an interference factor in the detection of formaldehyde for the copper–manganese composite oxide functionalized QCM resonator in real sample analysis. Even so, the copper–manganese composite oxide functionalized QCM resonator could be used for quantitative analysis or concentration monitoring of HCHO in a formaldehyde environment in real time because of the linear equation between the response of QCM resonator and HCHO concentration.
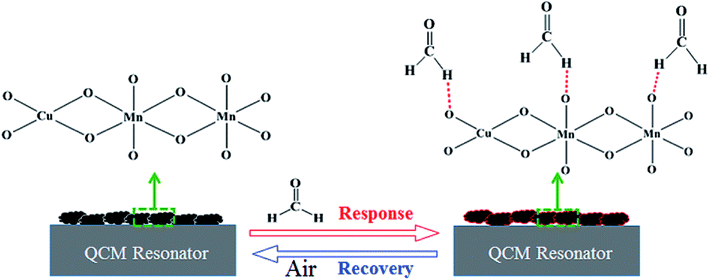 |
| | Scheme 1 Schematic illustration of the process on as-prepared copper–manganese composite oxide functionalized QCM resonator. | |
4. Conclusion
Copper–manganese composite oxide functionalized QCM resonators were fabricated and explored for HCHO sensing. The copper–manganese composite oxide functionalized QCM resonators had a significant response to HCHO. The frequency shift of copper–manganese composite oxide functionalized QCM resonator with 25 μg coating amount reached −270 Hz in 60 s. Neither for the response nor for the sensing profile were observed significant changes after 60 days, indicating that the sensing characteristics of copper–manganese composite oxide functionalized QCM resonator is stable. In addition, the copper–manganese composite oxide functionalized QCM resonator could be used for quantitative analysis or concentration monitoring of HCHO in a formaldehyde environment in real time because of the linear equation between the response of QCM resonator and HCHO concentration.
Conflicts of interest
There are no conflicts of interest to declare.
Acknowledgements
The work described here was supported by the National Natural Science Foundation of China (Grant No. 21607158, 21271177, 21571182), the National Key Research and Development Program of China (Grant No. 2017YFA0207102) and Technical Institute of Physics and Chemistry, CAS.
References
- T. Salthammer, S. Mentese and R. Marutzky, Chem. Rev., 2010, 110, 2536–2572 CrossRef CAS PubMed.
- C. Zhang, F. Liu, Y. Zhai, H. Ariga, N. Yi, Y. Liu, K. Asakura, M. Flytzani and H. He, Angew. Chem., Int. Ed., 2012, 51, 9628–9632 CrossRef CAS PubMed.
- L. Feng, C. J. Musto and K. S. Suslick, J. Am. Chem. Soc., 2010, 132, 4046–4047 CrossRef CAS PubMed.
- R. Xing, L. Xu, Y. Zhu, J. Song, W. Qin, Q. Dai, D. Liu and H. Song, Sens. Actuators, B, 2013, 188, 235–241 CrossRef CAS.
- L. Han, D. Wang, Y. Lu, T. Jiang, B. Liu and Y. Lin, J. Phys. Chem. C, 2011, 115, 22939–22944 CAS.
- C. Zhang, X. Wang, J. Lin, B. Ding, J. Yu and N. Pan, Sens. Actuators, B, 2011, 152, 316–323 CrossRef CAS.
- H. Tian, H. Fan, M. Li and L. Ma, ACS Sens., 2016, 1, 243–250 CrossRef CAS.
- D. Yan, P. Xu, Q. Xiang, H. Mou, J. Xu, W. Wen, X. Li and Y. Zhang, J. Mater. Chem. A, 2016, 4, 3487–3493 CAS.
- Z. Ye, H. Tai, T. Xie, Z. Yuan, C. Liu and Y. Jiang, Sens. Actuators, B, 2016, 223, 149–156 CrossRef CAS.
- M. Hussain, K. Kotova and P. Lieberzeit, Sensors, 2016, 16, 1011 CrossRef PubMed.
- K. A. Marx, Biomacromolecules, 2003, 4, 1099–1120 CrossRef CAS PubMed.
- J. Wang, Z. Zhu and H. Ma, Anal. Chem., 2013, 85, 2096–2101 CrossRef CAS PubMed.
- Y. Yao and Y. Xue, Sens. Actuators, B, 2015, 211, 52–58 CrossRef CAS.
- H. Tai, Y. Zhen, C. Liu, Z. Ye, G. Xie, X. Du and Y. Jiang, Sens. Actuators, B, 2016, 230, 501–509 CrossRef CAS.
- Z. Yuan, H. Tai, Z. Ye, C. Liu, G. Xie, X. Du and Y. Jiang, Sens. Actuators, B, 2016, 234, 145–154 CrossRef CAS.
- M. Yang and J. He, J. Colloid Interface Sci., 2012, 368, 41–48 CrossRef CAS PubMed.
- M. Yang, J. He, M. Hu, X. Hu, C. Yan and Z. Cheng, Sens. Actuators, B, 2015, 213, 59–64 CrossRef CAS.
- M. Yang and J. He, Sens. Actuators, B, 2016, 228, 486–490 CrossRef CAS.
- Z. Liu, J. Zhu, J. Li, L. Ma and S. I. Woo, ACS Appl. Mater. Interfaces, 2014, 6, 14500–14508 CAS.
- J. A. Pérez-Omil, J. J. Delgado, W. Ouahbi, A. B. Hungría, N. Browning, M. A. Cauqui, J. M. Rodríguez-Izquierdo and J. J. Calvino, J. Phys. Chem. C, 2010, 114, 8981–8991 Search PubMed.
- G. Zhang, J. Qu, H. Liu, R. Liu and G. Li, Environ. Sci. Technol., 2007, 41, 4613–4619 CrossRef CAS PubMed.
- G. K. Reddy, J. He, S. W. Thiel, N. G. Pinto and P. G. Smirniotis, J. Phys. Chem. C, 2015, 119, 8634–8644 CAS.
- S. M. Vickers, R. Gholami, K. J. Smith and M. J. MacLachlan, ACS Appl. Mater. Interfaces, 2015, 7, 11460–11466 CAS.
- S. Ding, F. Liu, X. Shi, K. Liu, Z. Lian, L. Xie and H. He, ACS Appl. Mater. Interfaces, 2015, 7, 9497–9506 CAS.
- S. Öztürk, A. Kösemen, Z. A. Kösemen, N. Kılınç, Z. Z. Öztürk and M. Penza, Sens. Actuators, B, 2016, 222, 280–289 CrossRef.
- S. Lee, N. Takahara, S. Korposh, D. Yang, K. Toko and T. Kunitake, Anal. Chem., 2010, 82, 2228–2236 CrossRef CAS PubMed.
- T. Liu, Y. Yao, L. Wei, Z. Shi, L. Han, H. Yuan, B. Li, L. Dong, F. Wang and C. Sun, J. Phys. Chem. C, 2017, 121, 12757–12770 CAS.
- J. Li, P. Zhang, J. Wang and M. Wang, J. Phys. Chem. C, 2016, 120, 24121–24129 CAS.
|
| This journal is © The Royal Society of Chemistry 2018 |
Click here to see how this site uses Cookies. View our privacy policy here. 
 Open Access Article
 This Open Access Article is licensed under a
  *
*