
 Open Access Article
 This Open Access Article is licensed under a Creative Commons Attribution-Non Commercial 3.0 Unported Licence
Mid-infrared spectroscopy and microscopy of subcellular structures in eukaryotic cells with atomic force microscopy – infrared spectroscopy†
Luca Quaroni *ab,
Katarzyna Pogodaa,
Joanna Wiltowska-Zubera and
Wojciech M. Kwiateka
*ab,
Katarzyna Pogodaa,
Joanna Wiltowska-Zubera and
Wojciech M. Kwiateka
aDepartment of Experimental Physics of Complex Systems, Institute of Nuclear Physics, Polish Academy of Sciences, PL-31342, Kraków, Poland. E-mail: luca.quaroni@uj.edu.pl
bDepartment of Physical Chemistry and Electrochemistry, Faculty of Chemistry, Jagiellonian University, PL-30387, Kraków, Poland
First published on 12th January 2018
Abstract
Atomic force microscopy – infrared (AFM-IR) spectroscopy allows spectroscopic studies in the mid-infrared (mid-IR) spectral region with a spatial resolution better than is allowed by the diffraction limit. We show that the high spatial resolution can be used to perform spectroscopic and imaging studies at the subcellular level in fixed eukaryotic cells. We collect AFM-IR images of subcellular structures that include lipid droplets, vesicles and cytoskeletal filaments, by relying on the intrinsic contrast from IR light absorption. We also obtain AFM-IR absorption spectra of individual subcellular structures. Most spectra show features that are recognizable in the IR absorption spectra of cells and tissue obtained with FTIR technology, including absorption bands characteristic of phospholipids and polypeptides. The quality of the spectra and of the images opens the way to structure and composition studies at the subcellular level using mid-IR absorption spectroscopy.
Introduction
Infrared absorption spectroscopy in the mid-infrared (mid-IR) spectral region, about 400–4000 cm−1 (25–2.5 μm), is frequently used for the characterization of biological matter at the molecular level. Most molecular species strongly absorb mid-IR radiation, meaning that the technique is generally applicable to a large variety of samples, ranging from purified biomolecules to cells and tissue, including living cells.1 Mid-IR light absorption provides information on composition and structural properties of the samples, making it valuable in the study of structure–function relationships, reaction mechanisms and dynamics,2 and in medical diagnostic applications.3 The technique can be implemented in a microscopy configuration4 and allows spectromicroscopy and imaging experiments to be performed on samples as small as individual eukaryotic cells.5A major limitation of mid-IR microscopy is imposed by far-field optics, which constrain the spatial resolution to the limits set by diffraction, of the order of the wavelength of light. This corresponds to a few micrometers in the mid-IR region, comparable to the size of most eukaryotic cells.1 Because of these constraints, mid-IR imaging can provide only limited information about subcellular structure. In most eukaryotic cells, the largest structures that can be resolved are the nucleus and larger vacuoles. In smaller eukaryotic cells, such as some neuronal cells, subcellular imaging is not viable in this spectral region. Spectromicroscopy mid-IR experiments on eukaryotic cells are mostly performed at the cellular level, averaging the information over the whole cell. Most organelles, such as mitochondria, chloroplasts or lysosomes, or the membranes of the endoplasmic reticulum and the Golgi apparatus, are too small to be probed selectively with far-field optics. Despite the novel, rich and sometimes unique information potentially available on cellular biochemistry, limits in spatial resolution have been a major obstacle to the implementation of cellular studies by mid-IR absorption spectroscopy.
In recent years, efforts have been under way to circumvent the resolution constraints set by diffraction by performing mid-IR absorption spectroscopy with near-field optics. Several optical configurations have been demonstrated.6 Some of them rely on optical detection of absorption, such as transmission-mode and scattering mode Scanning Near-field Optical Microscopy (SNOM and s-SNOM respectively, also SNIM for the latter).7,8 Others rely on the photothermal effect and its detection by a temperature probe9 or by mechanical deflection of a cantilever for atomic force microscopy (AFM-IR).6
An AFM-IR experiment uses the deflection of an AFM tip to detect local photothermal sample expansion following absorption of light.10 In the most sensitive implementation of the technique, the expansion is used to excite contact resonances of the AFM cantilever. The oscillation is measured by the movement of the AFM laser on the same four-quadrant detector used to monitor AFM experiments. The amplitude of the oscillation is an indirect measure of the amount of light absorbed by the sample and scanning the wavelength of the laser source provides an absorption spectrum of the sample in the contact location of the AFM tip. Imaging is possible by scanning the sample surface as in a standard AFM experiment, while keeping the exciting wavelength fixed, thus providing a map of the absorption at that wavelength throughout the sample. As an alternative, extended absorption spectra can be collected in an array of positions, thus providing a hyperspectral cube from which images are extracted by sectioning at specific wavelengths.11
The performance of AFM-IR is characterized by three concomitant features. First, under appropriate conditions the accessible spatial resolution is limited by the size of the AFM tip. Second, absorption spectra obtained by AFM-IR measurements are a function of the imaginary part of the refractive index of the sample, with no contribution from the real part. Therefore, an AFM-IR spectrum of the sample often, although not always, reproduces the transmission spectrum of the same material measured with a conventional Fourier Transform Infrared (FTIR) instrument. The capability of AFM-IR to obtain the same spectra provided by a bulk measurement makes this a technique of choice for performing spectroscopy on small samples. Third, an AFM-IR experiment consists of parallel and concomitant AFM and spectroscopic measurements performed on the same sample, thus providing spectroscopic, topographic and mechanical information in one single run.
Since its inception, AFM-IR has been applied to the study of soft matter, including biological samples, such as protein aggregates and single cells. The achievable resolution has been particularly useful in the study of single prokaryotic cells, the size of which is of the order of the micrometer and inaccessible to far-field mid-IR measurements.12–14 Despite the potential of the technique for the study of cellular biochemistry, relatively few studies have been performed on eukaryotic cells. Several of these investigations were aimed at detecting the subcellular distribution of exogenous species, such as carbonyl-metal complexes,15 drugs16 or nanoparticles.17 Some investigations addressed the study of intrinsic biomolecules in eukaryotic cells, including triglyceride vesicles in algal and yeast cells,14 polysaccharide distribution in live Candida hyphae,18 nuclear localization in cancer cells16 and protein distribution in HeLa cells.19
In this work, we apply AFM-IR to the study of fixed fibroblast cells. We demonstrate the possibility to study subcellular structures such as cytoskeletal components, vesicles and micelles using both spectromicroscopy and imaging experiments.
Experimental
AFM-IR measurements were performed on a nanoIR2 instrument (Anasys, Santa Barbara, CA, USA) working in contact mode using PR-EX-nIR probes with nominal tip diameter of 30 nm and eigen frequency equal to 12.79 ± 0.64 kHz. The photothermal induced deflection of the cantilever was measured by the movement of a laser beam reflected from its surface and recorded by a four-quadrant detector as a sinusoidal decay signal. The resonance spectrum of the cantilever was extracted from the oscillatory decay using the Fast Fourier-Transform (FFT) algorithm.An OPO (Optical Parametric Oscillator) laser was used as the excitation source. For the measurement of extended spectra, the laser was scanned from 850 cm−1 to 3600 cm−1 in 2 cm−1 steps. The plane of polarization was at 0 degrees. Power was set at 10% of the maximum and 1024 measurements were co-averaged for each spectral point. The contact resonances were selected using a search location of 180 kHz or 241 kHz and a Gaussian filter with a half-width of 50 kHz. The maximum peak-to-peak amplitude of the oscillatory decay was used for recording AFM-IR spectra.
For the measurement of maps, the laser was set at the selected wavenumber while the AFM tip was scanned over the sample in contact mode. The contact mode scan was performed using a scan rate of 0.1 Hz, a 256-pixel resolution in the X and Y direction, and turning on the feedback loop of the Z scanner. The setpoint value was defined by an automated algorithm for each sample and I and P gains were set at 2 and 4 respectively. The plane of polarization was at 0 degrees. Power was set at 19% of the maximum and 8 or 32 measurements were co-averaged for each spectral point. The contact resonance was selected using a search location of 174 kHz via a Gaussian filter with a half-width of 50 kHz. The maximum peak-to-peak amplitude of the oscillatory decay was used for recording AFM-IR maps. AFM-IR maps were automatically normalized to laser power by the nanoIR2 instrument during collection.
Measurement parameters provide a pixel size of 117 nm in the AFM maps of Fig. 2–4, larger than the limiting AFM resolution. The collection rate for IR pulses limits pixel resolution in AFM-IR maps to 143 nm in the X direction and 117 nm in the Y direction. This pixel size limits resolution and the smallest object size that can be appreciated in these measurements.
AFM and AFM-IR maps were imported into Gwyddion 2.47 (http://gwyddion.net/) for processing and presentation. All maps were zero fixed. AFM-IR spectral traces were imported into OriginPro 2017 (Origin Lab) for plotting.
Detroit 551 human skin fibroblasts were obtained from the European Collection of Authenticated Cell Cultures (ECACC, Porton Down, UK) and grown in Eagle's Minimum Essential Medium (EMEM, ECACC, Porton Down, UK) supplemented with 10% fetal bovine serum (ECACC, Porton Down, UK) and kept in tissue culture plastic flasks in a humidified incubator at 37 °C and 5% CO2.
In order to prepare samples suitable for AFM-IR measurements, fibroblast cells were seeded onto the CaF2 optical substrates (Crystran, Poole, UK) and grown to confluency. Cells were then fixed using 3.7% paraformaldehyde in PBS (Sigma-Aldrich Poland, Poznan, Poland) for 10 minutes. Subsequently, the fixed cells were incubated with a 0.2% solution of the permeabilizing agent Triton X-100 (Sigma-Aldrich Poland, Poznan, Poland) in PBS for 1 hour at RT to disrupt the cell membrane and expose intracellular structures. Afterwards cells were washed for 2 minutes with PBS solutions of decreasing concentration (in sequence, PBS, 50% PBS in deionized H2O, deionized H2O), to remove salts and medium components, and air dried. Satisfactory removal of Triton X-100 during the washing is confirmed by the absence of its stronger absorption bands from the FTIR and AFM-IR spectra of the sample, such as the aromatic ring vibrations.20
In order to test if prolonged exposure of cells to Triton X-100 affected cell morphology, actin cytoskeleton organization and lipid droplets content, immunofluorescence imaging of fibroblast cells was performed. Firstly, cells were grown on glass coverslips and fixed with 3.7% paraformaldehyde in PBS (Sigma-Aldrich Poland, Poznan, Poland) for 10 minutes at RT and permeabilized in 0.2% Triton X-100 for 5 minutes and 1 hour, respectively. After rinsing with PBS, cells were treated with fluorescent stains. BODIPY 493/503, 1:200, (Molecular Probes, Eugene, OR, USA) was used to label neutral lipids and lipid droplets, rhodamine-phalloidin, 1:200, (Molecular Probes, Eugene, OR, USA) to label actin cytoskeleton filaments and Hoechst, 1:1000, (Molecular Probes, Eugene, OR, USA) to label cell nuclei. Cells were visualized using an AxioImager Z2 fluorescence microscope (Carl Zeiss, Oberkochen, Germany) equipped with a Plan-Apochromat (10×/0.45 NA) objective and a Plan-Apochromat (63×/1.40 NA) oil immersion objective. Fluorescence images were analyzed using Image J.21
Results and discussion
In this study, we performed AFM-IR measurements on a monolayer of fixed adherent cells. We used Detroit 551 human skin fibroblasts as a model system for our studies. Fibroblast cells are an ideal sample because they grow as an adherent phenotype on a variety of substrates, including optical substrates that are transparent to mid-IR radiation, such as CaF2. Adherent cells can be measured repeatedly with reduced problems due to sample displacement by the AFM tip. Finally, coverage can be controlled to provide isolated cells, cell clusters or a cell monolayer. Fixed cells were treated with Triton X-100 for 1 h to partially degrade the cell membrane and the other internal membranes of the cell, thus exposing internal structures of the cell to contact with the AFM tip. Paraformaldehyde fixation results mainly in crosslinking of amine groups of proteins but it is also recognized as a method that preserves lipid droplets in the sample. We used fluorescence imaging to investigate the effect of detergent treatment on fixed cells. Fluorescent images of fixed Detroit 551 fibroblasts after 5 min and 1 h exposure to Triton X-100 are shown on Fig. 1. Selective staining of droplets and actin confirms that treatment with surfactant, even for as long as 1 h, preserved both actin filaments and lipid droplets in paraformaldehyde fixed cells.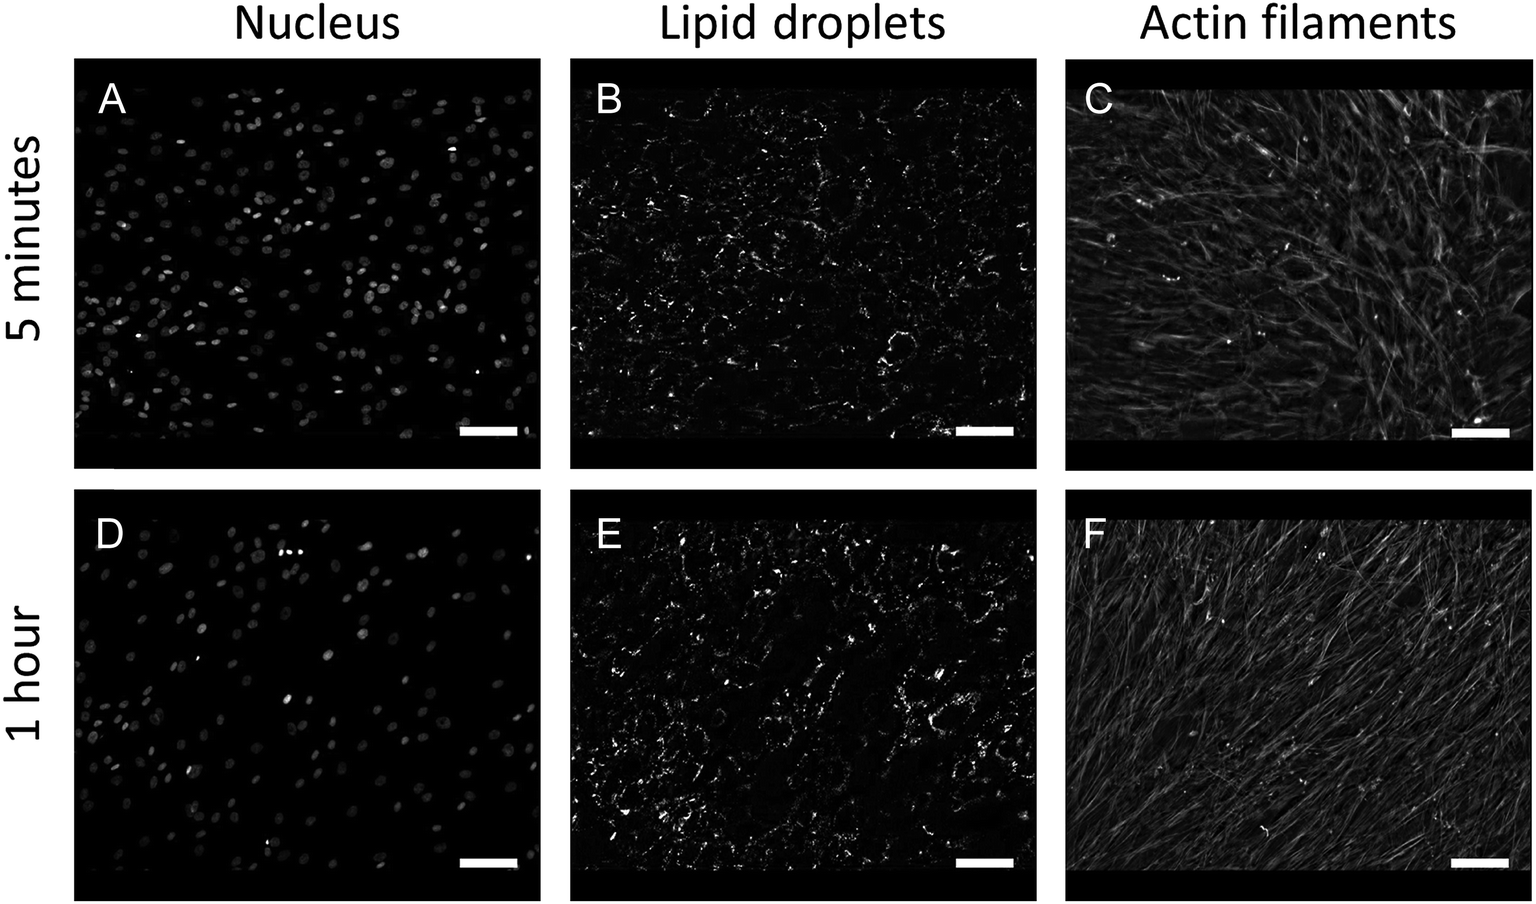 | ||
| Fig. 1 Comparison of fluorescent images obtained by staining nuclei (A, D), lipid droplets (B, E) and actin filaments (C, F) of fixed Detroit 551 fibroblasts treated with 0.2% Triton X-100 for 5 minutes (A–C) or 1 hour (D–F). Scale bars 100 μm. | ||
AFM-IR spectromicroscopy and imaging measurements were used to study structure and composition of cells treated following fixation and treatment with detergent. Single point spectral measurements and single wavelength images were collected on the same sample, together with AFM images. The CaF2 substrate used for cell growth is transparent to light in the mid-IR spectral region above 900 cm−1, and allows using the full spectral range accessible to the OPO laser. The area under investigation is shown in the AFM height image of Fig. 2A and corresponds to part of three cells in contact, lying side by side along their major axis. Portion of a nucleus can be seen on the left edge of the field of view. ESI Fig. S1† shows a wider scan of the surrounding portion of the sample. AFM height measurements confirm the presence of highly organized filaments, between 100 nm and 1000 nm, which constitute the cell actin cytoskeleton. In addition, spherical structures can also be seen in the same image, in agreement with the results of fluorescence imaging.
 | ||
| Fig. 2 AFM-IR spectra measured at specific locations of fixed fibroblasts following treatment with Triton X-100. A – height AFM image. 1–11 – single point spectra measured at the marked locations in panel A. | ||
No structural degradation of the sample is observed following the measurement, despite the relatively high laser power. ESI Fig. S1† has been recorded on the sample after the full set of imaging and spectroscopy experiments. Comparison of Fig. 2 and ESI Fig. S1† does not show any obvious alteration of cell morphology at the resolution of the measurements.
We use the AFM height map (Fig. 2A) to orient ourselves on the sample and select specific locations for the measurement of single AFM-IR spectra. Some of the positions selected for measurement are marked with numbers 1–11. The spectral range was limited to the 950–1800 cm−1 and 2700–3600 cm−1 intervals, to exclude spectral regions in which no absorption from the sample occurs. The resulting AFM-IR spectra are shown in Fig. 2, panels 1–11. The spectra are of such quality as to allow direct comparison with single cell FTIR spectra measured with far-field optics.
The infrared absorption spectra of eukaryotic cells have been extensively described using FTIR microscopy with far-field optics. FTIR absorption spectra of fixed eukaryotic cells are qualitatively similar for most cells and are dominated by a contribution from the main classes of biological macromolecules, mostly proteins, polysaccharides, nucleic acids, plus phospholipids.22 Comparison of FTIR spectra of single cells (ESI Fig. S2†) and of spectra in Fig. 2 shows that major bands in FTIR spectra are also observed in AFM-IR spectra. Some of the clearest bands are characteristic for long chain acyl lipids, such as the strong doublet at 2920 cm−1 and 2855 cm−1, arising from the stretching modes of C–H bonds in CH2 groups of the acyl chains. Additional weaker bands that arise from lipid vibrations are also observed. A weak but sharp band can be seen at 3010 cm−1, corresponding to the stretching mode of C–H bonds on unsaturated C![[double bond, length as m-dash]](https://www.rsc.org/images/entities/char_e001.gif) C bonds in acyl chains. The weak shoulders at 2958 cm−1 and 2895 cm−1 are assigned to the stretching C–H modes of the terminal CH3 groups in the acyl chains. The band at 1740 cm−1 is due to the stretching of the CO bond of the ester carbonyls in phospholipid and triglyceride headgroups. Additional bands can be seen around 1080–1090 cm−1 and 1220–1240 cm−1, which are characteristic of the phosphate headgroups of phospholipids, and around 1380–1390 cm−1 and 1430–1450 cm−1, which are associated to bending modes of the CH2 groups. The relative intensity of these bands is qualitatively similar to the one observed in FTIR measurements of bulk lipids. The only difference is given by the intensity of the peak at 2920 cm−1, which appears to be relatively stronger than the one at 2855 cm−1 compared to bulk isotropic samples. It is notable that the intensity of acyl lipid bands decreases in cells treated with Triton X-100 (ESI Fig. S3†), as expected following the degradation of cellular membranes. AFM-IR spectra show that the distribution of residual acyl lipid bands within the cell is heterogeneous. While some locations do not display any bands from acyl lipids, other locations still display clear bands at 1740 cm−1, 2855 cm−1 and 2920 cm−1, plus weaker bands between 1000 cm−1 and 1300 cm−1. The spectra of Fig. 2 show that the band pattern characteristic of acyl lipids is associated to several particle-like structures observed in the sample (positions 1, 4–8). It is weak or negligible when measured in other locations (positions 2, 3, 7, 9–11).
C bonds in acyl chains. The weak shoulders at 2958 cm−1 and 2895 cm−1 are assigned to the stretching C–H modes of the terminal CH3 groups in the acyl chains. The band at 1740 cm−1 is due to the stretching of the CO bond of the ester carbonyls in phospholipid and triglyceride headgroups. Additional bands can be seen around 1080–1090 cm−1 and 1220–1240 cm−1, which are characteristic of the phosphate headgroups of phospholipids, and around 1380–1390 cm−1 and 1430–1450 cm−1, which are associated to bending modes of the CH2 groups. The relative intensity of these bands is qualitatively similar to the one observed in FTIR measurements of bulk lipids. The only difference is given by the intensity of the peak at 2920 cm−1, which appears to be relatively stronger than the one at 2855 cm−1 compared to bulk isotropic samples. It is notable that the intensity of acyl lipid bands decreases in cells treated with Triton X-100 (ESI Fig. S3†), as expected following the degradation of cellular membranes. AFM-IR spectra show that the distribution of residual acyl lipid bands within the cell is heterogeneous. While some locations do not display any bands from acyl lipids, other locations still display clear bands at 1740 cm−1, 2855 cm−1 and 2920 cm−1, plus weaker bands between 1000 cm−1 and 1300 cm−1. The spectra of Fig. 2 show that the band pattern characteristic of acyl lipids is associated to several particle-like structures observed in the sample (positions 1, 4–8). It is weak or negligible when measured in other locations (positions 2, 3, 7, 9–11).
Some of the strongest spectral contributions in the FTIR spectra of cells are provided by the Amide I and Amide II bands, around 1650 cm−1 and 1550 cm−1 respectively. The bands arise from the amide groups of polypeptides but also contain contributions from amino acid side chains.23 In purified proteins, these bands are used to quantify the relative abundance of specific secondary structure components in proteins.3 Additional bands from proteins are present in the 1200–1400 cm−1 spectral region (Amide III band) and in the 3100–3300 cm−1 region (Amide A and Amide B bands).
A set of bands attributable to proteins can be observed in all the AFM-IR spectra recorded in the sample, including several of the particles (Fig. 2, positions 1, 4–7) and the nucleus (position 3). Bands can be clearly seen in positions characteristic of Amide I, Amide II and Amide A components. The weaker Amide III overlaps with bands from other cellular components, such as lipids and cannot be resolved from them. The relative intensity of the bands is comparable to the one observed in bulk FTIR samples, with the Amide I being the stronger band. In comparison with FTIR spectra of bulk isotropic samples, in AFM-IR spectra the ratio of intensity between the Amide I and Amide II samples appears to be farther skewed towards the Amide I.
The spectrum in position 3 (Fig. 2) has been recorded in the nuclear position. It is dominated by protein Amide I and Amide II bands, with little contribution from the absorption of phospholipid bands. These features have been previously reported in the FTIR spectra of the nuclear region of eukaryotic cells and presumably arise from the abundance of chromatin and the lack of stacked membrane layers within the nucleus itself.24
The spectrum of the particle in position 7 is dominated by contributions from Amide bands. However, despite the positive profile in the AFM height map, the intensity in this position in the 1650 cm−1 map is lower when compared to the surrounding region, suggesting that it is an empty cavity surrounded by a protein shell, presumably held together by cross-linking due to the fixation process.
Oligo and polysaccharides and the ribose chains of nucleic acids give rise to complex absorption multiplets in the 1000–1100 cm−1 range, mostly due to vibrations of C–O bonds. In the spectra of Fig. 2, varying contributions are observed in this spectral region. In addition to absorption from ribose, nucleic acids also contribute bands from the absorption of the phosphate backbone around 1080 cm−1 and 1250 cm−1, and from the carbonyl and imide groups of the nucleic bases, around 1660–1680 cm−1.25 Due to the complexity of the overlap, the relatively low spectral resolution, limited to 8–4 cm−1, and signal-to-noise ratio afforded by the measurement it is not possible to resolve band patterns specific to nucleic acids and polysaccharides from overlapping bands of proteins and lipids by simple visual inspection. Nonetheless, they are expected to provide a contribution to overall intensity.
Fig. 3 shows AFM images and AFM-IR images for the same area of the sample. The selected wavelength values correspond to some of the stronger absorption bands observed in AFM-IR spectra. The map at 1650 cm−1 (Fig. 3c) shows the distribution of the absorption peak of the Amide I band. In fixed cells, protein absorption is the main contribution to this spectral position, with some additional contribution from the tail of nucleic acid absorption around 1670 cm−1. Therefore, the map is expected to be dominated by the distribution of proteins in the sample. Most structures in the 1650 cm−1 map reproduce the ones observed in the AFM height and deflection maps (Fig. 3a and b). Two types of well-defined structures are observed, filaments and particles. Filaments range from about 100 nm to 1000 nm in diameter and match the same structures observed in AFM maps. Particles are granular or spherical in shape and range in size from a few pixels to about 1500 nm. Resolution in the XY plane for AFM-IR experiments is approximately limited by the size of the tip, which is 30 nm. In our experiments, we did not explore the resolution limits achievable in these samples. The smallest structures observed in these measurements are about 120 nm in size, corresponding to the pixel resolution.
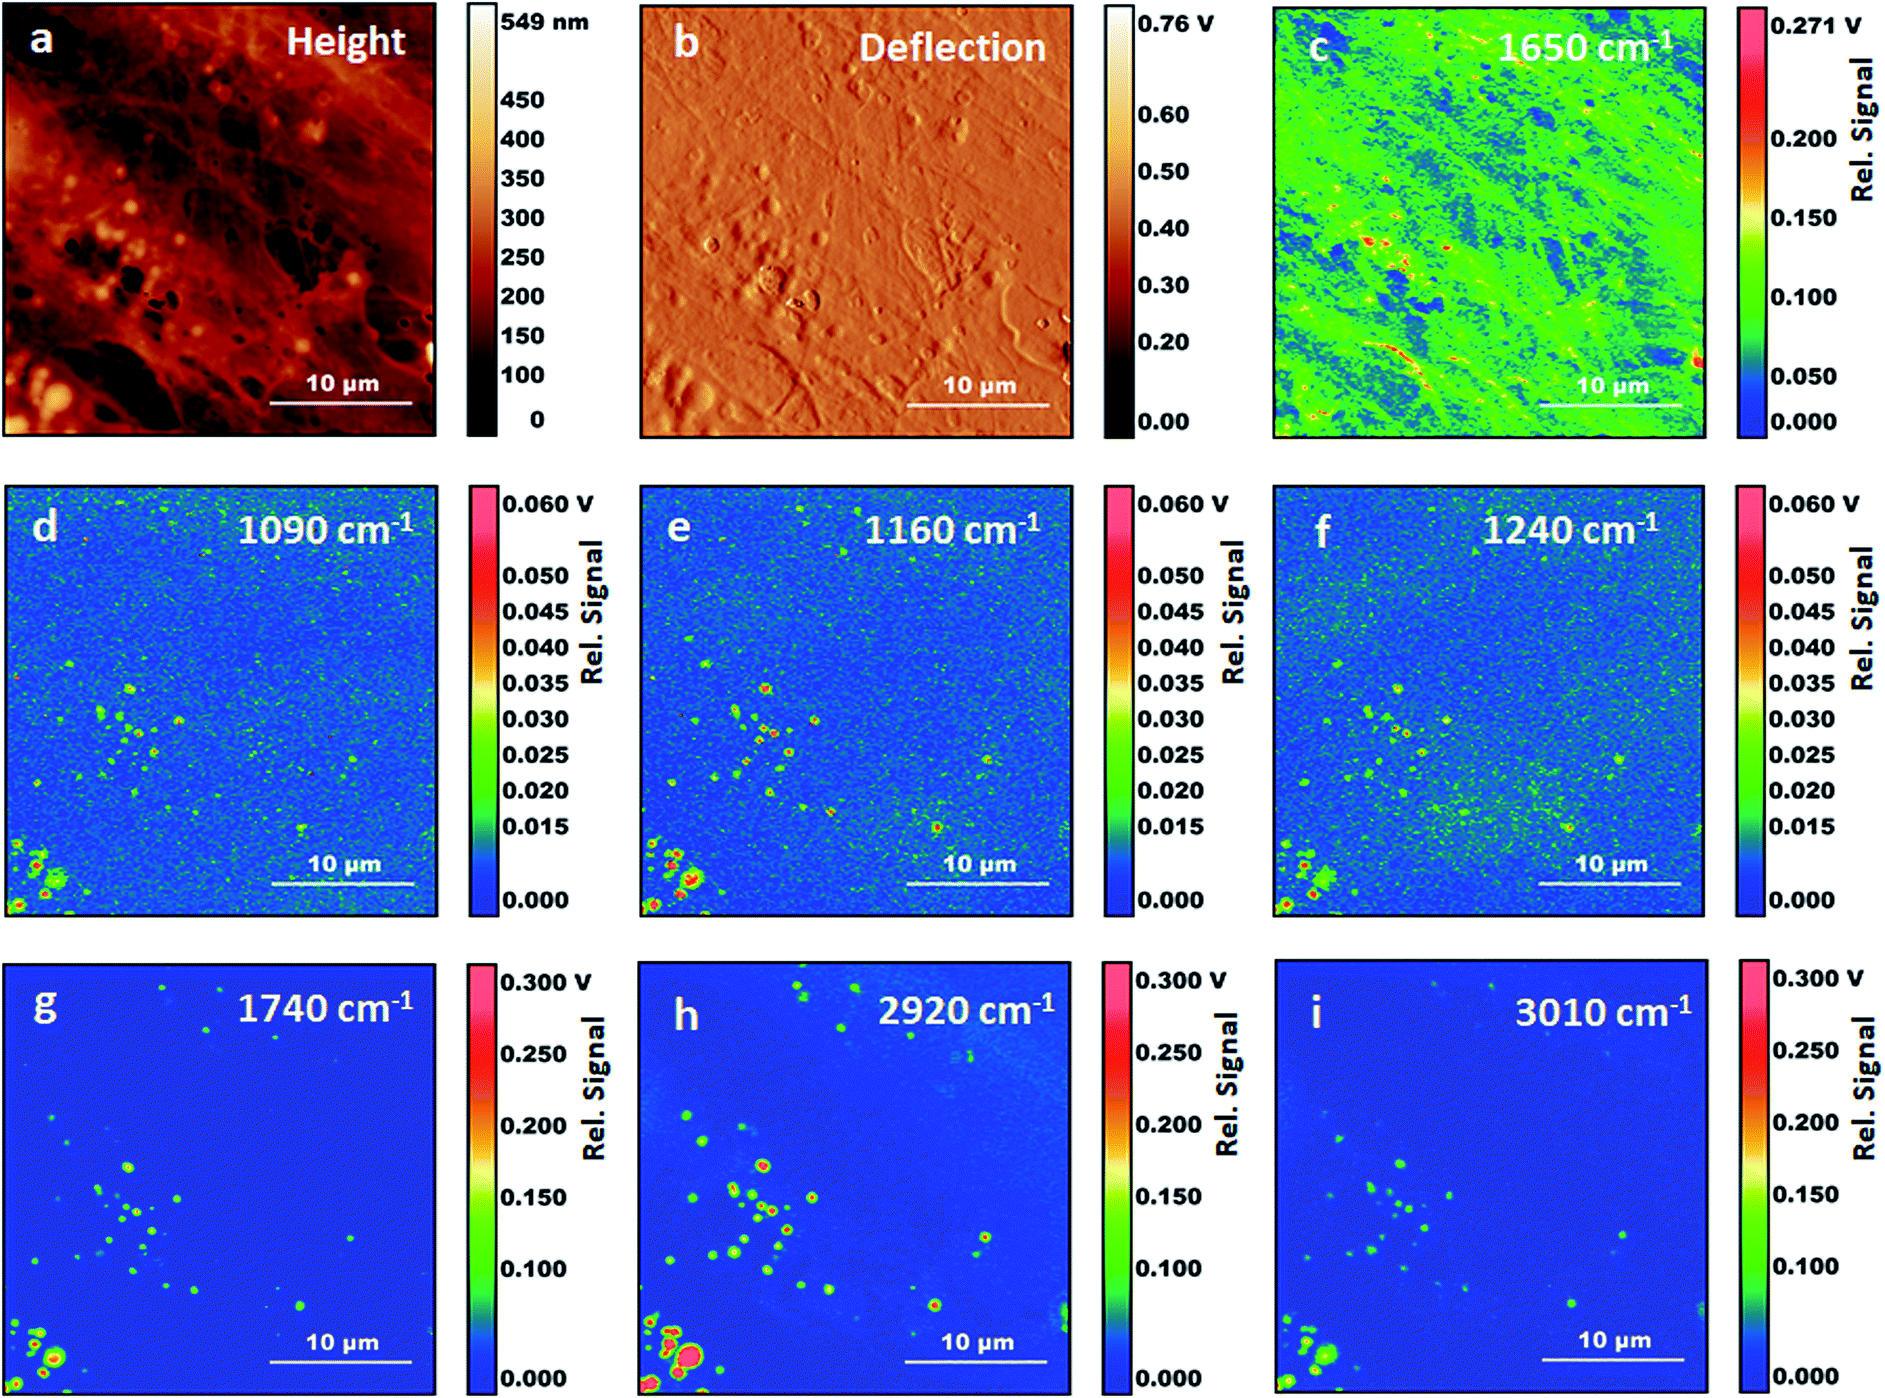 | ||
| Fig. 3 AFM-IR measurements on fixed fibroblasts following treatment with Triton X-100. (a) Height AFM image. (b) Deflection AFM image. (c) AFM-IR map with 1650 cm−1 excitation. (d) AFM-IR map with 1090 cm−1 excitation. (e) AFM-IR map with 1160 cm−1 excitation. (f) AFM-IR map with 1240 cm−1 excitation. (g) AFM-IR map with 1740 cm−1 excitation. (h) AFM-IR map with 2920 cm−1 excitation. (i) AFM-IR map with 3010 cm−1 excitation. | ||
Absorption at 1650 cm−1 and morphology of filaments both support their assignment to components of the cytoskeleton. Cytoskeletal filaments are extended protein complexes formed by the polymerization of G-actin monomers into F-actin filaments. To our knowledge this is the first time that cytoskeletal components are reported in AFM-IR maps of cells. Other investigators have measured AFM-IR maps of fixed eukaryotic cells with an excitation frequency of 1660 cm−1, within the Amide I envelope. However, these authors did not report the fibril structure nor the particles that we observe in Fig. 3a.19 This is somewhat surprising given that actin is the most abundant protein in most eukaryotic cells 26,27and is expected to provide a dominant contribution to spectra from the cytoplasm. We suggest that in our experiments fixation has preserved the filament structure while treatment with Triton X-100 has helped to expose cytoskeletal fibrils and other internal structures to direct contact with the AFM tip, thus facilitating their detection and resolution from cellular surroundings.
It is notable that some spectra display a weak Amide II band relative to the corresponding Amide I. In some cases, the Amide II is barely observable (e.g. positions 2, 9 and 11). In several cytoplasmic locations, no other absorption bands are seen in the spectra except for a weak band at 1650 cm−1. Protein spectra with a weak or absent contribution from the Amide II band have been observed in AFM-IR measurements of purified fibrillar protein aggregates formed by lysozyme and the Josephin domain of Ataxin3.27 In contrast, FTIR spectra of a macroscopic sample of fibrillar Ataxin3 ATQ55 poly-glutamine derivative show a clear Amide II band,28,29 suggesting that a weak Amide II contribution may be associated to the AFM-IR measurement itself. However, in our samples, protein spectra associated with vesicles show a strong Amide II band, indicating that the AFM-IR configuration does not by itself give rise to a weak response in this spectral region. The weak Amide II contribution is more obvious in the locations where cytoskeletal fibers are observed. In these positions, polymeric F-actin is expected to be the most abundant protein. The observations suggest that the unusual Amide II intensity may be due to the measurement of ordered or fibrillar structures using an AFM-IR configuration. However, too few examples are presently available in the literature to support or disprove this hypothesis and additional experiments are necessary to test it.
Following the observation of bands from acyl lipids, we collected several maps at their peak absorption frequency, to assess their spatial distribution (Fig. 3C–H), including 3010 cm−1, 2920 cm−1, 1740 cm−1, 1240 cm−1, 1160 cm−1 and 1090 cm−1. All the maps recorded at these frequencies show particles or vesicles and very little detail is associated to other subcellular structures. Only the map at 2920 cm−1 shows some contributions from objects that are non-spherical. Most of these bands are co-localized within the same objects, suggesting that they arise mostly from the same molecules, and confirming the spectral assignment to acyl lipids, either triglycerides or phospholipids. We must point out that the identification of acyl lipids does not rule out that contributions from other molecules can be present in the same maps, due to the overlap of weaker and unresolved absorption bands from these molecules. Most of the particles appear as uniform circular structures, either filled or with an inner cavity, suggesting that they result from the fixation of vesicles or micelles. A few of them appear as elongated objects, in some cases with an irregular inner structure. Comparison with the map at 1650 cm−1 shows that spectral contributions from proteins are co-localized with those from lipids in some, but not all, of the particles.
Some of the particles can be identified as lipid droplets. Fluorescence imaging of fixed Triton-treated cells stained with BODIPY confirms that these structures survive the Triton treatment. Lipid droplets are rich in triglycerides and are expected to display stronger absorption from acyl bands and weaker absorption from protein bands and phosphate bands (e.g. the particle in Fig. 2, position 5). Observation of a sharp band at 3010 cm−1 indicates that at least part of the acyl chains have unsaturated CC bonds. The intensity of this band relative to that of the bands at 2920 cm−1 and 2985 cm−1 can be used to estimate the degree of unsaturation. Comparison of the spectra for positions 1 and 4–6, shows that unsaturation is variable throughout the sample. The possibility to image lipid droplets in eukaryotic cells without any staining and the capability to assess the degree of unsaturation have recently been demonstrated by Raman spectroscopy.30,31 Our work shows the possibility to obtain complementary spectroscopic information on these systems via AFM-IR measurements.
It is notable that only weak absorption from acyl lipid bands is observed away from lipid droplets or vesicles. This is in contrast to what is observed in FTIR spectra of cells obtained with far field optics, both with fixed and with live samples. Although the latter measurements have relatively low, diffraction limited, resolution, they do allow in many cases collecting spectra of the cytoplasm separately from those of the nucleus. The cytoplasmic region typically shows strong acyl lipid absorption,24 which has been attributed to the collective contribution from the Golgi and endoplasmic reticulum, and to various organelles such as mitochondria. In contrast, our AFM-IR measurements, both spectra and maps, show that at subcellular level acyl lipid absorption is mostly associated to lipid droplets and vesicles. This is likely a consequence of membrane degradation during the fixation process and the following treatment with Triton X-100.
Detailed analysis of individual particles confirms the existence of different structures. Fig. 4 shows the zoom-in of some of the locations in the AFM and AFM-IR maps from Fig. 3. Several particles display a vesicular structure, with a shell enclosing a cavity which can be observed both in AFM height maps and in AFM-IR maps. In many cases the shell gives strong contrast at 1650 cm−1, indicating the presence of a protein rich layer (Fig. 4M–O). These structures may be lipid droplets or they may arise from the fixation of endosomes, organelles or the fragmentation of subcellular membranes. Their spectral features indicate that they retain an abundant protein component. In the case of lipid droplets, the observation of a protein layer is also consistent with the presence of proteins that stabilize the droplets. In the case of membrane-derived structures, this would correspond to the original complement of membrane proteins. Failure to observe extended structures that resemble the endoplasmic reticulum or the Golgi apparatus supports the suggestion that intracellular membranes are being degraded by the combination of fixation and detergent treatment. Treatment of cells with paraformaldehyde is known to induce blebbing and fragmentation of the cell membrane and is used in the preparation of cell membrane vesicles.32
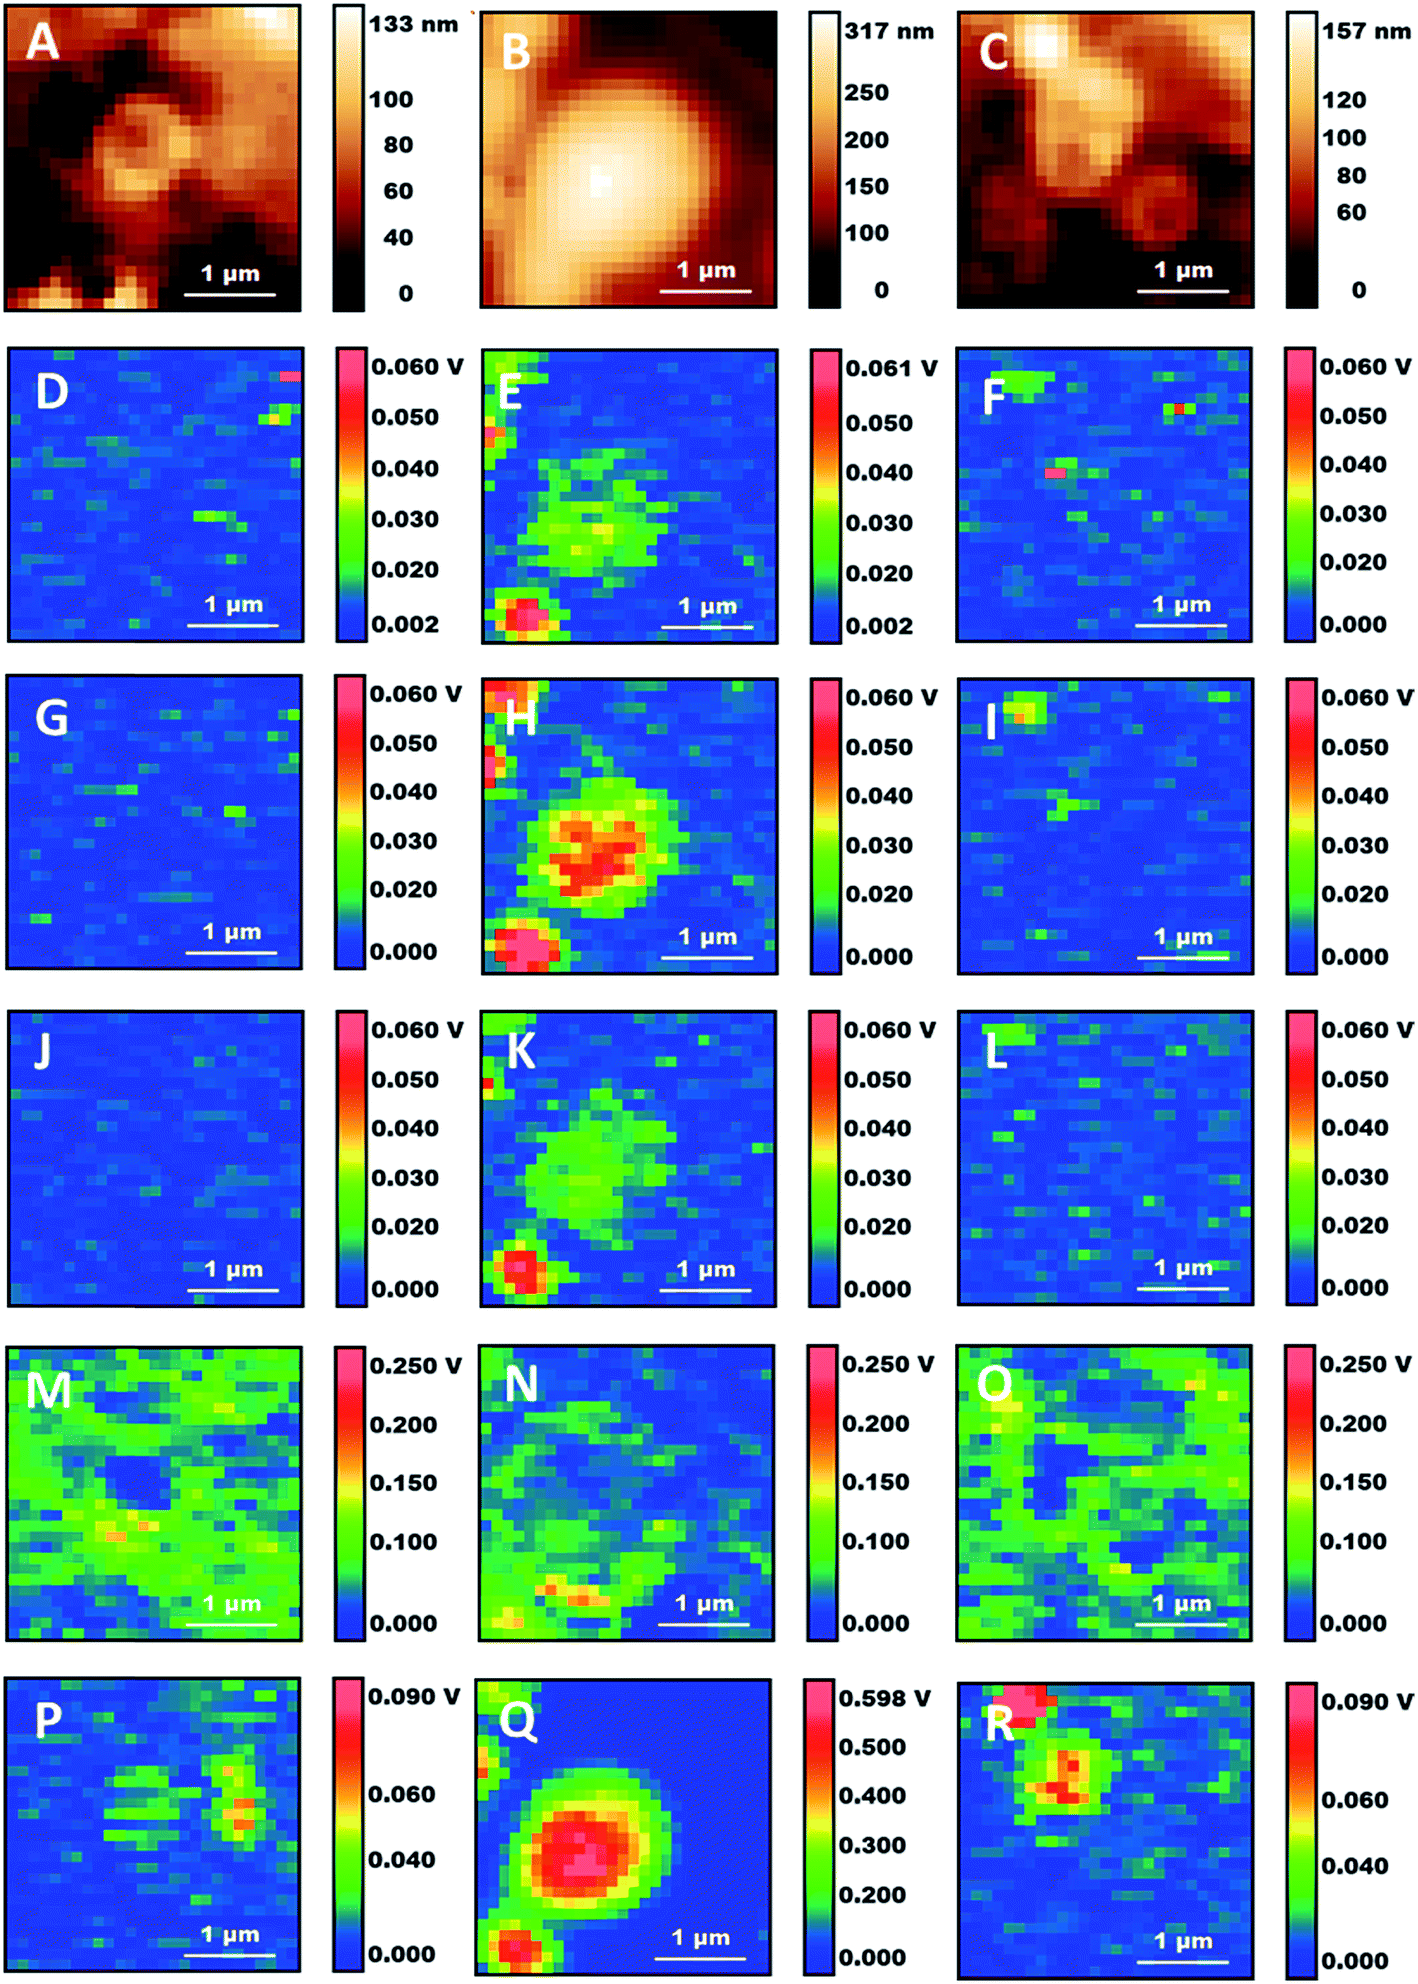 | ||
| Fig. 4 Details of three subcellular structures from Fig. 3. (A–C) Height maps. (D–F) 1090 cm−1 maps. (G–I) 1160 cm−1 maps. (J–L) 1240 cm−1 maps. (M–O) 1650 cm−1 maps. (P–R) 2920 cm−1 maps. Scale bars: 1 μm. | ||
We suggest that fixation may be at the origin of the formation of some of these particles while the subsequent crosslinking reaction may contribute to their stabilization and allow them to survive the treatment with Triton X-100.
Some of the particles have a non-spherical shape and a non-uniform internal distribution (e.g. Fig. 4A, M and P), indicating that they may be derived from the fixation of organelles. Several of them are about 1 μm in size. Mitochondria are 0.7–1.5 μm in size and often display an elongated structure, making them a possible candidate. An alternative or additional interpretation is that the particles may be residual structures from the degradation of the endoplasmic reticulum or the Golgi apparatus. Additional work is necessary both to confirm their identification and to assess how they are affected by the conditions of fixation. This will be the subject of future investigations.
We also observe some small particles that appear only in the maps at 1090 cm−1 and 1160 cm−1 (e.g. Fig. 4D, F, G and I). They are about 100–300 nm in size and described by very few pixels. In maps recorded at other wavelengths they are absent or they give negative contrast (i.e. they decrease the signal from the surrounding material, giving a darker spot). Their lack of absorption at the other mapped wavelengths rules out their assignment to nucleic acids, ribosomes, phosphoproteins and other organic structures. Both this and their size suggest that they are phosphate crystals left over from the fixation process.
From the methodological point of view, we show that comparison of the spatial distribution of absorption bands in AFM-IR maps is a useful tool in confirming their assignment to specific molecular species. This proves true for both the assignment of phospholipid bands and of phosphate bands. Proper band assignments are critical for understanding the molecular properties of a sample from its vibrational spectra. In cellular and tissue samples this task is particularly challenging because of the overlapping contributions from multiple molecules, even when using FTIR spectra, which display high signal-to-noise ratios. This is an even greater challenge for AFM-IR spectra, which generally give noisy bands. Band patterns in the 900–1300 cm−1 spectral region are particularly difficult to assign because of the numerous overlapping contributions from both macromolecules and small molecules. Observing the co-localization of multiple bands from the same molecule is a strategy that provides improved assignments in an AFM-IR experiment, without resorting to additional experiments such as isotopic substitution or correlation analysis.33
Conclusions
We have tested the capability of AFM-IR to perform subcellular studies of fixed fibroblast cells. We show that the technique allows us to image subcellular structures that include lipid droplets, vesicles, organelles and cytoskeletal components with intrinsic contrast that relies on their IR absorption. Although we do not quantify the spatial resolution of our AFM-IR measurements, we can observe and resolve structures as small as 120 nm, well below the diffraction limit for electromagnetic radiation of this wavelength. The spectroscopic properties of these structures are accessible via single point measurements. The detail provided by these measurements, both in spectra and images, is unprecedented in AFM-IR studies of eukaryotic cells. This work opens the way to research that will take advantage of AFM-IR to investigate the properties of individual organelles and other subcellular entities. The use of fixed cells for AFM-IR experiments complicates the interpretation of results in terms of chemical composition of specific cellular structures and prevents us from addressing questions in the biochemistry of living systems. Despite these limitations, fixed cells are still an important and useful subject of biological investigation. The changes induced by fixation do not prevent the retention of molecular structure for investigation by techniques such as electron microscopy and fluorescence immunostaining. A wealth of information is accessible from AFM-IR of fixed cells, such as subcellular distribution and structure of biological macromolecules. The very effects of fixation chemistry on cellular properties, still not well characterized, can now be addressed by AFM-IR experiments. Biomedical applications can be envisioned, including subcellular-level studies of pathological conditions affecting the macromolecular components of the cell, its membranes and the cytoskeleton.The challenge for the near future will be the extension of these measurement capabilities to living cells. This milestone, when achieved, will lead to a whole new approach in the investigation of cellular biochemistry.
Conflicts of interest
There are no conflicts of interest to declare.Acknowledgements
The research was performed using equipment purchased in the frame of the project co-funded by the Małopolska Regional Operational Programme Measure 5.1 Krakow Metropolitan Area as an important hub of the European Research Area for 2007–2013, project No. MRPO.05.01.00-12-013/15. Luca Quaroni is supported by the European Union's Horizon 2020 research and innovation programme under the Marie Skłodowska-Curie grant agreement No. 665778, managed by the National Science Center Poland under POLONEZ contract UMO-2016/21/P/ST4/01321.References
- L. Quaroni and T. Zlateva, Analyst, 2011, 136, 3219 RSC.
- M. Diem, Modern vibrational spectroscopy and micro-spectroscopy: theory, instrumentation and biomedical applications, John Wiley & Sons, 2015, Print ISBN: 9781118824863, Online ISBN: 9781118824924, DOI: 10.1002/9781118824924 Search PubMed.
- B. Bird, M. Miljković, S. Remiszewski, A. Akalin, M. Kon and M. Diem, Lab. Invest., 2012, 92, 1358–1373 CrossRef PubMed.
- I. W. Levin and R. Bhargava, Annu. Rev. Phys. Chem., 2005, 56, 429–474 CrossRef CAS PubMed.
- L. Quaroni, T. Zlateva, K. Wehbe and G. Cinque, Faraday Discuss., 2016, 187, 259–271 RSC.
- A. Centrone, Annu. Rev. Anal. Chem., 2015, 8, 101–126 CrossRef CAS PubMed.
- M. Müller, V. Kravtsov, A. Paarmann, M. B. Raschke and R. Ernstorfer, ACS Photonics, 2016, 3(4), 611–619 CrossRef.
- G. Wollny, E. Bründermann, Z. Arsov, L. Quaroni and M. Havenith, Opt. Express, 2008, 16, 7453–7459 CrossRef CAS PubMed.
- L. Bozec, A. Hammiche, H. M. Pollock, M. Conroy, J. M. Chalmers, N. J. Everall and L. Turin, J. Appl. Phys., 2001, 90, 5159–5165 CrossRef.
- A. Dazzi, R. Prazeres, F. Glotin and J. M. Ortega, Opt. Lett., 2005, 30, 2388 CrossRef CAS PubMed.
- P. M. Donaldson, C. S. Kelley, M. D. Frogley, J. Filik, K. Wehbe and G. Cinque, Opt. Express, 2016, 24, 1852 CrossRef CAS PubMed.
- C. Mayet, A. Dazzi, R. Prazeres, J.-M. Ortega and D. Jaillard, Analyst, 2010, 135, 2540 RSC.
- A. Dazzi, R. Prazeres, F. Glotin, J. M. Ortega, M. Al-Sawaftah and M. de Frutos, Ultramicroscopy, 2008, 108, 635–641 CrossRef CAS PubMed.
- A. Deniset-Besseau, C. B. Prater, M. J. Virolle and A. Dazzi, J. Phys. Chem. Lett., 2014, 5, 654–658 CrossRef CAS PubMed.
- C. Policar, J. B. Waern, M. A. Plamont, S. Clède, C. Mayet, R. Prazeres, J. M. Ortega, A. Vessières and A. Dazzi, Angew. Chem., Int. Ed., 2011, 50, 860–864 CrossRef CAS PubMed.
- E. Kennedy, R. Al-Majmaie, M. Al-Rubeai, D. Zerulla and J. H. Rice, J. Biophotonics, 2015, 8, 133–141 CrossRef CAS PubMed.
- D. Khanal, A. Kondyurin, H. Hau, J. C. Knowles, O. Levinson, I. Ramzan, D. Fu, C. Marcott and W. Chrzanowski, Anal. Chem., 2016, 88, 7530–7538 CrossRef CAS PubMed.
- C. Mayet, A. Dazzi, R. Prazeres, F. Allot, F. Glotin and J. M. Ortega, Opt. Lett., 2008, 33, 1611 CrossRef CAS PubMed.
- L. Baldassarre, V. Giliberti, A. Rosa, M. Ortolani, A. Bonamore, P. Baiocco, K. Kjoller, P. Calvani and A. Nucara, Nanotechnology, 2016, 27, 75101 CrossRef CAS PubMed.
- L. Yang, J. Zhu and D. Xiao, RSC Adv., 2012, 2, 8179 RSC.
- M. D. Abràmoff, P. J. Magalhães and S. J. Ram, Biophoton. Int., 2004, 11, 36–41 Search PubMed.
- J. Doherty, G. Cinque and P. Gardner, Appl. Spectrosc. Rev., 2017, 52, 560–587 CrossRef CAS.
- A. Barth, Prog. Biophys. Mol. Biol., 2000, 74, 141–173 CrossRef CAS PubMed.
- N. Jamin, P. Dumas, J. Moncuit, W.-H. Fridman, J.-L. Teillaud, G. L. Carr and G. P. Williams, Appl. Biol. Sci., 1998, 95, 4837–4840 CAS.
- D. R. Whelan, K. R. Bambery, P. Heraud, M. J. Tobin, M. Diem, D. McNaughton and B. R. Wood, Nucleic Acids Res., 2011, 39, 5439–5448 CrossRef CAS PubMed.
- R. Dominguez and K. C. Holmes, Annu. Rev. Biophys., 2011, 40, 169–186, DOI:10.1146/annurev-biophys-042910-155359.
- F. S. Ruggeri, G. Longo, S. Faggiano, E. Lipiec, A. Pastore and G. Dietler, Nat. Commun., 2015, 6, 7831 CrossRef CAS PubMed.
- G. Invernizzi, F. A. Aprile, A. Natalello, A. Ghisleni, A. Penco, A. Relini, S. M. Doglia, P. Tortora and M. E. Regonesi, PLoS One, 2012, 7(12), e51890 CAS.
- A. Apicella, A. Natalello, A. M. Frana, A. Baserga, C. S. Casari, C. E. Bottani, S. M. Doglia, P. Tortora and M. E. Regonesi, Biochimie, 2012, 94, 1026–1031 CrossRef CAS PubMed.
- K. Kochan, E. Maslak, C. Krafft, R. Kostogrys, S. Chlopicki and M. Baranska, J. Biophotonics, 2015, 8, 597–609 CrossRef CAS PubMed.
- K. Majzner, K. Kochan, N. Kachamakova-Trojanowska, E. Maslak, S. Chlopicki and M. Baranska, Anal. Chem., 2014, 86, 6666–6674 CrossRef CAS PubMed.
- T. Baumgart, A. T. Hammond, P. Sengupta, S. T. Hess, D. A. Holowka, B. A. Baird and W. W. Webb, Proc. Natl. Acad. Sci. U. S. A., 2007, 104, 3165–3170 CrossRef CAS PubMed.
- L. Quaroni and T. Zlateva, Anal. Chem., 2014, 86, 6887–6895 CrossRef CAS PubMed.
Footnote |
| † Electronic supplementary information (ESI) available. See DOI: 10.1039/c7ra10240b |
| This journal is © The Royal Society of Chemistry 2018 |