NiCo2O4 nanoframes with a nanosheet surface as efficient electrocatalysts for the oxygen evolution reaction†
Zhen
Chen
ab,
Bo
Zhao
a,
Ya-Chuan
He
ab,
Hao-Ran
Wen
a,
Xian-Zhu
Fu
 *ac,
Rong
Sun
 *a and
Ching-Ping
Wong
de
aShenzhen Institutes of Advanced Technology, Chinese Academy of Sciences, Shenzhen 518055, China. E-mail: xz.fu@szu.edu.cn; rong.sun@siat.ac.cn; Fax: +86-755-86392299; Tel: +86-755-86392151
bInstitute of Nano Science and Technology, University of Science and Technology of China, Suzhou 215123, China
cCollege of Materials Science and Engineering, Shenzhen University, Shenzhen 518055, China
dSchool of Materials Science and Engineering, Georgia Institute of Technology, Atlanta, GA 30332, USA
eDepartment of Electronics Engineering, The Chinese University of Hong Kong, Hong Kong, China
First published on 30th March 2018
Abstract
NiCo2O4 nanoframes with a nanosheet surface are fabricated using Cu2O nanoframes as a template. The size of the NiCo2O4 nanoframe is about 450 nm, and the thickness of the surface nanosheet is about 10 nm. Compared with Co3O4 and NiO nanoframes, NiCo2O4 nanoframes as electrocatalysts demonstrate much higher catalytic activity and stability for the oxygen evolution reaction (OER). The superior electrocatalytic performance of NiCo2O4 nanoframes might be attributed to the large surface area and synergistic effect of Ni and Co.
1. Introduction
Due to the use of excessive fossil fuels, an increase in the energy demand and rising environmental pollution have stimulated research in energy conversion and storage systems such as water splitting devices, fuel cells and metal–air batteries.1–5 The oxygen evolution reaction (OER) is an important process in these applications.6,7 At present, the most efficient electrocatalysts for OER are noble metals such as Ir and Ru.8–10 However, their high cost and scarcity limit their applications. Therefore, it is important to develop OER electrocatalysts with low cost, high efficiency and stability.In recent years, the first row transition metal compounds such as transition metal oxides,11–13 hydroxides,14–16 and phosphides17,18 that are used as electrocatalysts for OER have attracted much attention; among them, transition metal oxides such as Co-based oxides are the most promising electrocatalysts towards OER in alkaline media.19–21 Moreover, doping metal ions such as Ni and Fe into Co-based oxides can improve electrocatalytic performance;22,23 among them, using NiCo2O4 as an electrocatalyst for OER has attracted much attention because of its high electrical conductivity and stability.23,24
Compared with solid nanoparticles, open structures such as porous, hollow, cage and frame structures have a larger exposed exterior and interior surface-to-volume ratio and a lower atomic coordination number.25–27 Therefore, materials with a nanoframe structure as catalysts can display superior performance. To date, many materials with a nanoframe structure have been synthesized as catalysts. For example, an octahedral Au–Ag nanoframe was prepared for the synthesis of azobenzene from aniline.28 The conversion of the Au–Ag nanoframe catalyst is 94% at 60 °C for 32 h, which is 3.03 times than that of Au–Ag nanoparticles. In addition, an Ru nanoframe is an efficient catalyst for the reduction of p-nitrophenol by NaBH4.27 The average reaction rate constants of the Ru nanoframe and Ru nanowires are 0.022 ± 0.001 and 0.005 ± 0.0002 min−1, respectively. This implies that the Ru nanoframe displays high catalytic activity. Moreover, a concave PtCu2 octopod nanoframe displays more than 7 times the activity when compared with commercial Pt/C towards the methanol oxidation reaction.29 The mass activity of an RhCu truncated octahedral nanoframe is about twice that of Rh nanoparticles towards OER.30 Clearly, the catalysts with nanoframe structures show superior catalytic performances, which can be attributed to their high surface areas and unique nanoframe structures. However, there are few reports about the use of metal oxide nanoframes as electrocatalysts.
Herein, we report NiCo2O4 nanoframes with a nanosheet surface as efficient electrocatalysts for OER. The obtained NiCo2O4 nanoframe is uniform, and its size is about 450 nm. The NiCo2O4 nanoframe as an electrocatalyst for OER displays a low overpotential and high stability in alkaline media.
2. Experimental section
2.1 Chemical and materials
All chemical reagents in the experiment were of analytical grade and used without further purification. Copper(II) sulfate pentahydrate (CuSO4·5H2O, ≥99.0%), glucose anhydrous (C6H12O6, ≥99.7%), nickel(II) chloride hexahydrate (NiCl2·6H2O, ≥98.0%) and sodium thiosulfate pentahydrate (Na2S2O3·5H2O, ≥99.0%) were obtained from Sinopharm chemical reagent Co., Ltd (Shanghai, China). Potassium sodium tartrate tetrahydrate (C4H4O6KNa·4H2O, 99.0%), potassium hydroxide (KOH, 90.0%), palladium chloride (PdCl2, 59–60%), polyvinylpyrrolidone (PVP, K-30) and cobalt chloride hexahydrate (CoCl2·6H2O, 98.0%) were purchased from Aladdin. Deionized Mini-Q water (18 MΩ cm) was used in all experiments.2.2 Synthesis of the Cu2O nanoframe
The Cu2O nanoframe was prepared by modifying the method presented by Lu.31 Briefly, a Fehling's solution was prepared by adding 0.35 g CuSO4·5H2O, 1.25 g C4H4O6KNa·4H2O and 0.225 g KOH into 50 mL water. Then, 1 mL 0.054 M PdCl2 and 10 mL 0.25 M glucose were introduced into a mixed solution of Fehling's solution and 450 mL water. After 2 minutes, the solution was put in a water bath at 75 °C for 3 h. During the entire process, the solution was stirred constantly. Finally, Cu2O nanoframe precipitates were obtained by centrifugation, washed several times with mixed water and ethanol solution (v water![[thin space (1/6-em)]](https://www.rsc.org/images/entities/char_2009.gif) :
:![[thin space (1/6-em)]](https://www.rsc.org/images/entities/char_2009.gif) v ethanol = 1
v ethanol = 1![[thin space (1/6-em)]](https://www.rsc.org/images/entities/char_2009.gif) :
:![[thin space (1/6-em)]](https://www.rsc.org/images/entities/char_2009.gif) 1), and dried in vacuum at 35 °C for 10 h.
1), and dried in vacuum at 35 °C for 10 h.
2.3 Synthesis of the NiCo2O4 nanoframe
The NiCo2O4 nanoframe was fabricated by modifying a previously reported method.32 Typically, 0.3333 g PVP was introduced into a mixed solution containing 5 mL water and 5 mL ethanol. Then, 10 mg Cu2O nanoframe, 3.3 mg NiCl2·6H2O and 6.7 mg CoCl2·6H2O were added sequentially. After 10 minutes, 5 mL 1 M Na2S2O3 solution was added dropwise. Next, the reaction was carried out for another 10 minutes. During this period, the color of the solution changed gradually from yellow to green. Finally, the product was centrifuged, washed with water and ethanol several times and then dried at room temperature for 12 h. The obtained products were annealed at 350 °C for 2 h under air atmosphere to synthesize the NiCo2O4 nanoframe.For comparison, we also prepared Co3O4 and NiO nanoframes by a similar method to that used for the NiCo2O4 nanoframe, but we replaced the mixture of 3.3 mg NiCl2·6H2O and 6.7 mg CoCl2·6H2O with 10 mg CoCl2·6H2O and 10 mg NiCl2·6H2O, respectively.
2.4 Characterization
The morphologies and structures of the as-prepared materials were analyzed using high resolution transmission electron microscopy (HRTEM, FEI Tecnai G2 F20) and field emission scanning electron microscopy (FE-SEM, FEI Nova Nano SEM 450), respectively. Brunauer–Emmett–Teller (BET) specific surface areas of the as-synthesized materials were measured by a Micromeritics ASAP 2020 instrument (Micromeritics, USA). Crystalline structures of all these electrocatalysts were characterized by X-ray diffraction (XRD, Rigaku D/max 2500, Japan). X-ray photoelectron spectroscopy (XPS, PHI-1800, Japan) was used to analyze the element valence states of the electrocatalysts. Electrochemical measurements were performed using an electrochemical workstation system (CHI 760E, Shanghai, China).2.5 Electrochemical measurements
Electrochemical properties of the electrocatalysts are characterized using a CHI 760E electrochemical workstation. As for the electrode, we use a standard three electrode system. The reference electrode and counter electrode are Ag/AgCl (3 M KCl, aq.) and a platinum-plate electrode (1 cm × 1.5 cm), respectively. A glass carbon electrode (GCE, diameter: 5 mm, area: 0.196 cm2) modified with electrocatalysts is the working electrode. A schematic representation of electrochemical characterization for OER is shown in Scheme S1 (ESI†). The three electrodes are plugged into 100 mL 1 M KOH solution in a 150 mL beaker. The other end is in contact with the electrochemical workstation. The three electrodes are separate and are not in contact with each other. After setting the appropriate parameters, the electrochemical performance of the electrocatalysts can be measured. Prior to electrochemical measurements, GCE is treated as follows: first, GCE is polished with 50 nm Al2O3 to obtain a mirror; next, it is cleansed by sonication. Then, it is washed with water and ethanol and dried at room temperature.Four mg electrocatalysts were dispersed in 1 mL ethanol and then ultrasonicated for about 20 min to obtain a homogeneous catalyst ink. Then, 14 μL of the catalyst ink was deposited on GCE and dried in air. Finally, 10 μL 0.1 wt% nafion solution was transferred onto GCE and dried again at room temperature. The modified GCE was obtained for electrochemical measurements. In this study, the electrochemical experiments were performed in a purified electrolyte. The electrolyte was 1 M KOH solution without any iron impurities. In this study, the water used was deionized Mini-Q water (18 MΩ cm). KOH was used as an analytical reagent. Moreover, all KOH solutions used for electrochemical experiments were freshly prepared.
3. Results and discussion
3.1 Structural characterization of the NiCo2O4 nanoframe
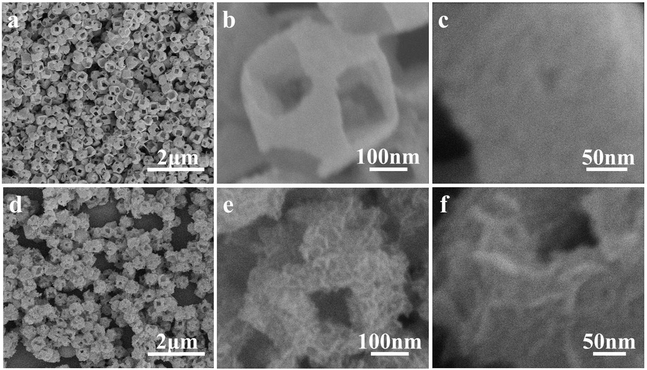
NiCo2O4 nanoframes with a nanosheet surface were prepared using Cu2O nanoframes as a template. The formation process of the NiCo2O4 nanoframe can be seen in Scheme 1. The Cu2O nanoframe was synthesized using a catalytic solution route,31 which was formed by two main processes: (1) PdCl2 was first reduced to small Pd nanoparticles by glucose; then, the Pd nanoparticles as catalysts transformed Cu2+ into Cu2O. (2) The Cu2O octahedron was etched into the nanoframe structures. In the formation of the nanoframe structure, Pd nanoparticles played an important role. At first, due to high activity, the apexes of the Cu2O octahedron were preferentially etched. The dissolved oxygen and Pd nanoparticles further etched the interior to form hollow structures, resulting in Cu2O nanoframe structures.Fig. 1a and b display the SEM images of the Cu2O nanoframe. Cu2O with a nanoframe structure is uniform and about 450 nm in size. The holes in the nanoframe structure are on the six corners of the octahedron. The hole is nearly square-shaped with a length of about 150 nm. In addition, Fig. 1c clearly shows that the surface of the Cu2O nanoframe is rough.
The Cu2O nanoframes transformed into NiCo complexes by the HSAB principle.33 The chemical routes can be described as follows:
| Cu2O + H2O + xS2O32− → [Cu2(S2O3)x]2−2x + 2OH− | (1) |
| S2O32− + H2O → HS2O3− + OH− | (2) |
| Ni2+ + xCo2+ + xOH− → NiCox(OH)x | (3) |
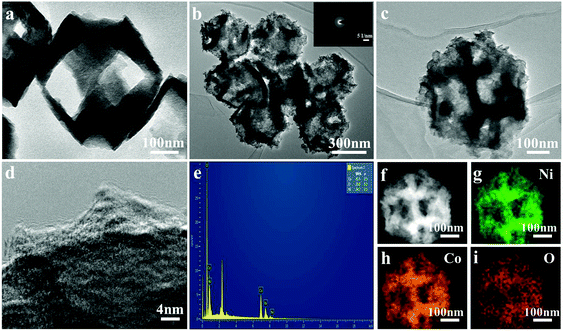
To further characterize the structure of the nanoframe, TEM was performed. As illustrated in Fig. 2a, clearly, Cu2O had a nanoframe structure, which was consistent with the SEM result. Fig. 2b and c show the TEM images of the NiCo2O4 nanoframe. Clearly, NiCo2O4 had a nanoframe structure and consisted of a nanosheet. Fig. 2d clearly displays the presence of nanosheets on the surface of the NiCo2O4 nanoframe. Moreover, Fig. 2d also confirms that the NiCo2O4 nanoframe was porous. The corresponding selected area electron diffraction (SAED) pattern of the NiCo2O4 nanoframe is displayed in the inset of Fig. 2b, which revealed that the NiCo2O4 nanoframe was polycrystalline. The EDX spectrum in Fig. 2e demonstrates that the NiCo2O4 nanoframe mainly consisted of Ni, Co and O, and the elemental ratio of Ni and Co was about 1![[thin space (1/6-em)]](https://www.rsc.org/images/entities/char_2009.gif) :
:![[thin space (1/6-em)]](https://www.rsc.org/images/entities/char_2009.gif) 2. Moreover, the distribution of different elements in the NiCo2O4 nanoframe was further investigated. Fig. 2f–i demonstrates that Ni, Co and O elements were distributed homogeneously throughout the whole nanoframe structure, confirming that the as-synthesized material was NiCo2O4 rather than separated Ni and Co oxides. TEM images further confirmed the highly open structure and nanosheets in the NiCo2O4 nanoframe, and these results were consistent with the results of SEM. Moreover, the porous structure of the NiCo2O4 nanoframe also enhanced its properties and excellent performance.
2. Moreover, the distribution of different elements in the NiCo2O4 nanoframe was further investigated. Fig. 2f–i demonstrates that Ni, Co and O elements were distributed homogeneously throughout the whole nanoframe structure, confirming that the as-synthesized material was NiCo2O4 rather than separated Ni and Co oxides. TEM images further confirmed the highly open structure and nanosheets in the NiCo2O4 nanoframe, and these results were consistent with the results of SEM. Moreover, the porous structure of the NiCo2O4 nanoframe also enhanced its properties and excellent performance.
N2 adsorption–desorption measurements were performed to investigate the pore size distribution and Brunauer–Emmett–Teller (BET) specific surface areas of NiCo2O4, Co3O4 and NiO nanoframes. Fig. 3a displays a type IV adsorption–desorption isotherm with a hysteresis loop, indicating that the NiCo2O4 nanoframe was a typical mesoporous material.34,35 Fig. S2 (ESI†) also confirmed that Co3O4 and NiO nanoframes were mesoporous in nature. Moreover, the pore size distribution was calculated from the desorption data using the Barrett–Joyner–Halenda (BJH) method, which is shown in Fig. 3b. The pore distribution of the NiCo2O4 nanoframe was narrow and mainly at 3.6 nm, which further confirmed its mesoporous nature. The mesoporous structure endowed the NiCo2O4 nanoframe with a high surface area. Moreover, the BET specific surface area of the NiCo2O4 nanoframe was 40.8 m2 g−1, which was higher than those of the Co3O4 (35.9 m2 g−1) nanoframe and NiO nanoframe (27.9 m2 g−1). Therefore, the mesoporous structure and high specific surface area improved the catalytic performance of the NiCo2O4 nanoframe.
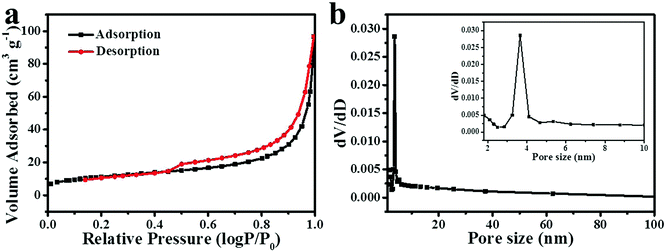 | ||
| Fig. 3 N2 adsorption–desorption isotherm (a) and the corresponding pore size distribution (b) (the inset of b is a part of it) for the NiCo2O4 nanoframe. | ||
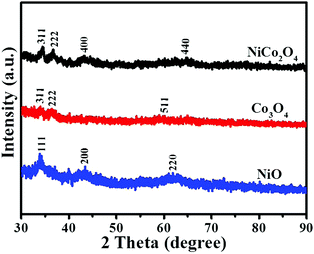
The XRD pattern of the Cu2O nanoframe is shown in Fig. S3 (ESI†). The peaks located at 2θ positions of 29.63°, 36.5°, 42.4°, 61.52°, 73.69° and 77.57° were recorded and indexed to the (110), (111), (200), (220), (311) and (222) planes of the cubic phase of Cu2O, respectively (JCPDS No. 65-3288). Fig. 4 displays the XRD patterns of the as-synthesized electrocatalysts. The noticeable (311) and (222) lattice phases of the NiCo2O4 nanoframe were centered at ∼34.5° and 36.7°, respectively, which were indexed to the spinel NiCo2O4 phase (JCPDF No. 20-0781). For comparison, the XRD patterns of Co3O4 and NiO are also displayed in Fig. 4. For Co3O4, there were two noticeable diffraction peaks at 2θ of 34.0° and 36.3°, which were indexed to the (311) and (222) lattice planes (JCPDF No. 43-1003). The lattice planes (111) and (200) of NiO were located at 2θ positions of 33.9° and 43.4°, respectively (JCPDF No. 65-2901). The peaks of Co3O4 and NiO were assigned to the cubic spinel Co3O4 and cubic NiO phase, respectively.
To analyze the surface chemical states of NiCo2O4, XPS was further performed. Fig. 5a shows the full survey spectrum of the NiCo2O4 nanoframe, which displayed the presence of Ni, Co and O; the C 1s peak is the reference. The Ni 2p spectrum is displayed in Fig. 5b, which clearly showed six species. Meanwhile, the binding energies at around 861.8 eV and 880.3 eV were assigned to two shakeup satellites (identified as “Sat.”). Other peaks in the Ni 2p spectrum were two pairs of spin–orbit doublets characteristic of Ni2+ and Ni3+.20,36,37 The peaks at around 854.7 eV and 872.4 eV were ascribed to Ni2+, and the peaks located at around 856.5 eV and 874.4 eV were ascribed to Ni3+.35,37 The ratio of Ni3+/Ni2+ in the NiCo2O4 nanoframe was 0.73. Fig. 5c demonstrates the Co 2p spectrum. Similarly, there were clearly six species of Co 2p including two spin–orbit doublets and two Sat. peaks.38,39 The two Sat. peaks were located at around 785 eV and 803.2 eV. Additionally, the fitting peaks at around 781.0 eV and 797.1 eV were indexed to Co2+, and the fitting peaks at 779.4 eV and 794.6 eV were related to Co3+.34,37 In the NiCo2O4 nanoframe, the ratio of Co3+/Co2+ was 0.12. It should be noted that the intensity of the satellite Co 2p region was high, which was different from that of the flat morphology of spinels, suggesting the high hydroxylation degree of spinel cobaltites.23 This might be beneficial in improving the electrocatalytic activity. Fig. 5d shows the O 1s spectrum, which clearly displayed three oxygen contributions denoted as O1, O2 and O3. The O1 peak at around 529.9 eV is usually associated with metal–oxygen bonds.40,41 The peak belonging to O2 in NiCo2O4 at 532.0 eV is usually assigned to defect sites.42,43 The O3 peak at 532.9 eV is associated with the multiplicity of physi- and chemi-sorbed water.20,35
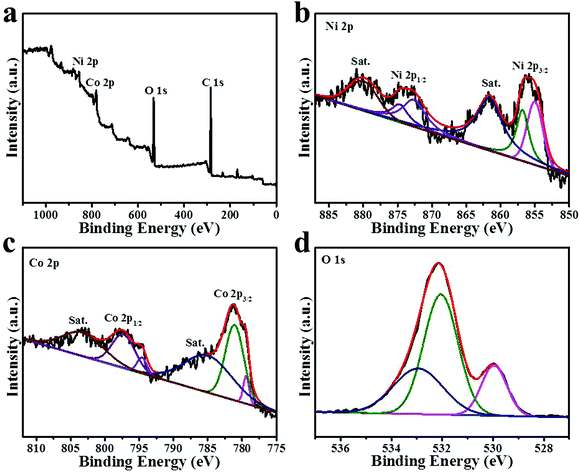 | ||
| Fig. 5 XPS spectra of (a) survey spectrum (b) high-resolution Ni 2p (c) high-resolution Co 2p and (d) high-resolution O 1s for the NiCo2O4 nanoframe. | ||
The physical characterizations indicate that NiCo2O4 has a nanoframe structure consisting of nanosheets and mesoporous structure. The nanoframe is a highly open structure, which can offer more active sites. In addition, the nanosheets on the surface of the nanoframe can improve the surface area. Moreover, the mesoporous structure further improves the surface area of the nanoframe. Therefore, the NiCo2O4 nanoframe has a high surface area. The high surface area can dramatically enhance the catalytic performance of the NiCo2O4 nanoframe.
3.2 Electrochemical properties
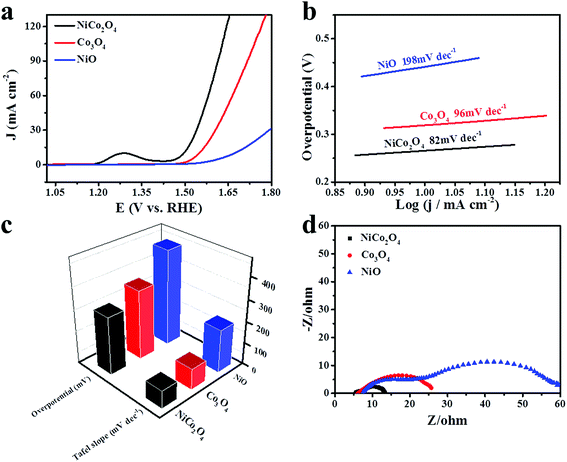
The catalytic performance of the as-synthesized materials is measured by the oxygen evolution reaction in alkaline medium. Fig. 6a displays the linear sweep voltammetry polarization curves of NiCo2O4, Co3O4 and NiO nanoframes in 1 M KOH solution at a scan rate of 5 mV s−1. The peak at around 1.31 V vs. RHE can be ascribed to the oxidation of M2+ to M3+ or M4+ (M = Ni or Co).14 Clearly, the NiCo2O4 nanoframe is more active than Co3O4 and NiO towards the oxygen evolution reaction, which can be attributed to the synergistic effect of Ni and Co. The overpotential of an electrocatalyst is an important parameter for identifying the catalytic performance towards OER. The overpotential of the NiCo2O4 nanoframe at a current density of 10 mA cm−2 is 265 mV, which is more negative than those of the Co3O4 nanoframe (319 mV) and NiO nanoframe (442 mV). The results indicate that the catalytic activity of NiCo2O4 nanoframe is superior. Moreover, it is worthwhile to mention that the overpotential of the NiCo2O4 nanoframe at a current density of 10 mA cm−2 is much lower than those of the previously reported electrocatalysts such as NiCoOx,44 Co Ni(20![[thin space (1/6-em)]](https://www.rsc.org/images/entities/char_2009.gif) :
:![[thin space (1/6-em)]](https://www.rsc.org/images/entities/char_2009.gif) 1)-P-NS,45 NiCo2O4 core–shell nanowires,40 CFP/NiCo2O4/Co0.57Ni0.43LMOs,39 and NiCo LDH.14 In addition, the corresponding Tafel slopes of NiCo2O4, Co3O4 and NiO nanoframes are 82, 96 and 198 mV dec−1, respectively, which are displayed in Fig. 6b. The Tafel slope values are calculated in the potential range of 1.48–1.69 V (V vs. RHE). According to a previous report,46 the oxygen vacancies play an important role in OER. The oxygen vacancies give a distorted structure and molecular level oxygen porosity, which can promote the adsorption of H2O onto the surface of catalysts and accelerate OER kinetics.47–50 A higher number of oxygen vacancies correspond to a lower Tafel slope.47,51,52 Therefore, the high Tafel slope of Co3O4 in this study may be attributed to the low number of oxygen vacancies. Moreover, the high Tafel slope of unsupported Co3O4 is also reported in another study such as the Tafel slope of a Co3O4 nanocage (110 mV dec−1).53 The results indicate that the Tafel slope of the NiCo2O4 nanoframe is superior to those of the Co3O4 and NiO nanoframes, which is consistent with the results of LSV. The OER mechanism in alkaline medium is detailed as follows:54,55
1)-P-NS,45 NiCo2O4 core–shell nanowires,40 CFP/NiCo2O4/Co0.57Ni0.43LMOs,39 and NiCo LDH.14 In addition, the corresponding Tafel slopes of NiCo2O4, Co3O4 and NiO nanoframes are 82, 96 and 198 mV dec−1, respectively, which are displayed in Fig. 6b. The Tafel slope values are calculated in the potential range of 1.48–1.69 V (V vs. RHE). According to a previous report,46 the oxygen vacancies play an important role in OER. The oxygen vacancies give a distorted structure and molecular level oxygen porosity, which can promote the adsorption of H2O onto the surface of catalysts and accelerate OER kinetics.47–50 A higher number of oxygen vacancies correspond to a lower Tafel slope.47,51,52 Therefore, the high Tafel slope of Co3O4 in this study may be attributed to the low number of oxygen vacancies. Moreover, the high Tafel slope of unsupported Co3O4 is also reported in another study such as the Tafel slope of a Co3O4 nanocage (110 mV dec−1).53 The results indicate that the Tafel slope of the NiCo2O4 nanoframe is superior to those of the Co3O4 and NiO nanoframes, which is consistent with the results of LSV. The OER mechanism in alkaline medium is detailed as follows:54,55| M + OH− → e− + MOH (Step 1) |
| MOH + OH− → e− + H2O + MO (Step 2) |
| MO + OH− → e− + MOOH (Step 3) |
| MOOH + OH− → H2O + e− + MOO (Step 4) |
| MOO → O2 + M (Step 5) |
The rate-determining steps for OER can be determined from the values of the Tafel slopes.56,57 The main rate-determining steps for OER in an alkaline medium are OH− adsorption (Step 1), O–H bond breaking (Step 2) and O2 desorption (Step 5), which correspond to the theoretical Tafel slope values of 120, 30 and 20 mV dec−1.58 The Tafel slope values of NiCo2O4 and Co3O4 are between 30 and 120 mV dec−1, indicating that the rate-determining steps are a mixture of OH− adsorption (Step 1) and O–H bond breaking (Step 2).59
Co3+ is considered to be the active site for OER.22,60 According to previous reports,32,61 low-coordinated Ni and Co sites originating from the defects or vacancies in disordered or amorphous structures can serve as active sites for OER. In addition, adding Ni into Co oxides creates new active sites.62 Therefore, the surface atoms of Co and Ni are the active sites in NiCo2O4.34,60 The active sites of NiCo2O4 are not the same as those of Co3O4. In addition, NiCo2O4 and Co3O4 have nanoframe structures. Therefore, NiCo2O4 is more efficient than Co3O4 due to the formation of more efficient active sites.
To gain an insight into the resistance of the as-synthesized electrocatalysts, Nyquist plots of EIS spectra were obtained at a potential of 1.583 V vs. RHE, which are presented in Fig. 6d. Rct is the charge transfer resistance. The diameter of the semicircle can be used to estimate the value of Rct in a high frequency region. The NiCo2O4 nanoframe exhibited the smallest diameter, and the Co3O4 nanoframe possessed a smaller diameter than that of NiO nanoframe. This indicated that OER on the electrode/electrolyte interface for the NiCo2O4 nanoframe was more facile. Meanwhile, Rs is the resistance of the electrolyte. The value of Rs can be estimated by the intercept at the real axis in the high frequency region. The Rs values of NiCo2O4, Co3O4 and NiO were about 5.4, 6.1 and 7.4, respectively. Clearly, the NiCo2O4 nanoframe showed a smaller Rs value than Co3O4 and NiO. The results demonstrated that the NiCo2O4 nanoframe possessed superior conductivity for OER.
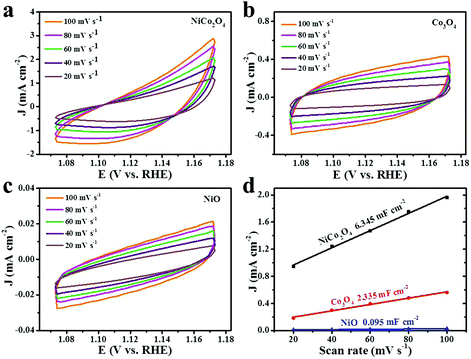
Electrochemical active surface area (ECSA) is a significant parameter to identify the electrochemical reaction performance of the electrocatalysts. The ECSA values can be estimated by the double-layer charging current (Cdl).63–65 The Cdl values of the electrocatalysts are determined by measuring the non-faradic capacitive current associated with double-layer charging by CV curves at different rates. Fig. 7a–c show the CV curves of different materials in a potential range of 1.073–0.173 V vs. RHE at a sweep rate of 20, 40, 60, 80 and 100 mV s−1 in 1 M KOH solution. The values of the current density variation measured at 1.123 V vs. RHE plotted against scan rates, which give a straight line, are shown in Fig. 7d. Specifically, Cdl can be determined by the slope of a line.65–67 The calculated Cdl values of NiCo2O4, Co3O4 and NiO nanoframes are 6.345, 2.335 and 0.095 mF cm−2, respectively. Moreover, the corresponding order of ECSA is NiCo2O4 > Co3O4 > NiO. In addition, Rf is the surface roughness factor, which is calculated by dividing Cdl by the capacitance of the smooth surface of a metal oxide (Rf = Cdl/60 μF cm−2).60,61 The Rf values of the NiCo2O4 nanoframe, Co3O4 nanoframe and NiO nanoframe are 105.75, 38.92 and 1.58, respectively. The higher ECSA and Rf values of the NiCo2O4 nanoframe can be attributed to the higher electrocatalytic activity towards OER. Electrochemical active surface area (ECSA) provides significant information about the number of available active sites.68 A higher ECSA indicates that there are more active sites for the catalysts to react with the electrolyte.69 The edges and defect sites of NiCo2O4 are the active centers, which can facilitate the dissociation of water.70 The introduction of Ni into Co oxides can enlarge the specific surface area and provide many defect sites thereby leading to high ECSA.50 Moreover, nanoframes have attracted great attention as electrocatalysts due to their inherently high active surface areas.71 The nanoframe structure provides a highly open structure and more interior and exterior catalytic surface.25,30 Moreover, nanoframe electrocatalysts have high surface-to-volume ratios and large surface areas.72,73 The confined nanospace enables facile collisions of reactants on the catalytic surface for the nanoframe structure.74 In addition, the nanosheets on the NiCo2O4 nanoframe can improve the surface area, which facilitates high ECSA. Besides, the mesoporous structure of NiCo2O4 leads to a larger ECSA value.75
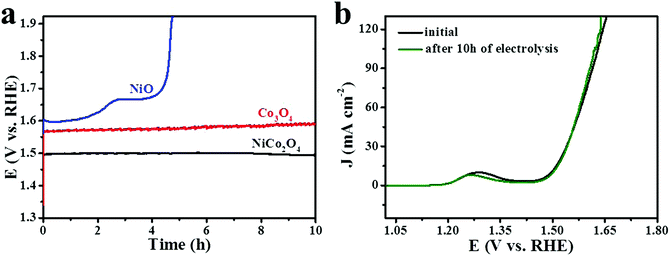
Stability is a major parameter for evaluating the performance of electrocatalysts. To evaluate the stability of NiCo2O4, Co3O4 and NiO nanoframes, galvanostatic measurements were performed in 1 M KOH with a continuous current density of 10 mA cm−2 for 10 h. As shown in Fig. 8a, it was obvious that the chronopotentiometric curve of the NiCo2O4 nanoframe was nearly a straight line and was parallel to the time axis. In addition, the potential increased to no more than 27 mV during the 10 h of electrocatalytic operation. The potential of the Co3O4 nanoframe increased gradually for 10 h. However, the potential of the NiO nanoframe increased to 1.93 V vs. RHE quickly after about 4.7 h. The high charge transfer capability facilitated the process of OER.76 The EIS plots showed higher values of Rs and Rct for NiO, indicating lower conductivity of NiO for OER, which might result in poor stability. The abovementioned results demonstrated that the NiCo2O4 nanoframe showed excellent stability towards OER. Moreover, the polarization curve of the NiCo2O4 nanoframe was obtained after 10 h stability tests, which is shown in Fig. 8b. It was evident that the two curves of the NiCo2O4 nanoframe nearly overlapped. This result also confirmed that the NiCo2O4 nanoframe had superior stability. Fig. S5 (ESI†) displays cyclic voltammetry curves of NiCo2O4 nanoframes before and after 50 CV cycles at a scan rate of 20 mV s−1 in 1 M KOH. The catalytic activity decreased slightly after 50 CV cycles. This phenomena can be attributed to two possible reasons.22,77 One is the existence of a gas bubble. The formation and accumulation of gas bubbles may pull the catalysts off the electrode so that fewer catalysts are accessible. Second is the structure change of the catalysts. The primary and secondary passivation layers of Co(II) and Co(III) are formed on the electrode surface during electrolysis, and this results in low catalytic activity.78
After electrochemical measurements, the NiCo2O4 nanoframe displays low overpotential and high stability towards OER. The superior performance of the NiCo2O4 nanoframe can be attributed to the mesoporous structure, nanosheets on the surface of NiCo2O4 and unique nanoframe structure. These physical features of the NiCo2O4 nanoframe endow it with a high surface area and more active sites. Therefore, the NiCo2O4 nanoframe shows excellent catalytic performance towards OER.
4. Conclusions
A NiCo2O4 nanoframe with a nanosheet surface was synthesized using a Cu2O nanoframe as a template at room temperature. The NiCo2O4 nanoframe exhibited a lower overpotential at a current density of 10 mA cm−2 and had higher stability than the Co3O4 nanoframe and NiO nanoframe in an alkaline electrolyte. Meanwhile, the nanoframe structure displayed more active sites and a large specific surface area. In addition, the NiCo2O4 nanoframe consisted of nanosheets and a mesoporous structure, which could improve the catalytic performance.Conflicts of interest
There are no conflicts to declare.Acknowledgements
This study was financially supported by the National Natural Science Foundation of China (No. 21203236), the Guangdong Department of Science and Technology (2017A050501052), and the Shenzhen Research Plan (JCYJ20160229195455154).Notes and references
- M. Yu, Z. Wang, C. Hou, Z. Wang, C. Liang, C. Zhao, Y. Tong, X. Lu and S. Yang, Adv. Mater., 2017, 29, 1602868 CrossRef PubMed.
- B. Weng, F. Xu, C. Wang, W. Meng, C. R. Grice and Y. Yan, Energy Environ. Sci., 2017, 10, 121–128 CAS.
- W. Yang, K.-Y. Kim, P. E. Saikaly and B. E. Logan, Energy Environ. Sci., 2017, 10, 1025–1033 CAS.
- J. Feng, M. Gong, M. J. Kenney, J. Z. Wu, B. Zhang, Y. Li and H. Dai, Nano Res., 2015, 8, 1577–1583 CrossRef CAS.
- B. Hua, M. Li, Y.-F. Sun, Y.-Q. Zhang, N. Yan, J. Chen, T. Thundat, J. Li and J.-L. Luo, Nano Energy, 2017, 32, 247–254 CrossRef CAS.
- L. Tao, C.-Y. Lin, S. Dou, S. Feng, D. Chen, D. Liu, J. Huo, Z. Xia and S. Wang, Nano Energy, 2017, 41, 417–425 CrossRef CAS.
- R. Liu, Y. Wang, D. Liu, Y. Zou and S. Wang, Adv. Mater., 2017, 29, 1701546 CrossRef PubMed.
- Z. W. Seh, J. Kibsgaard, C. F. Dickens, I. Chorkendorff, J. K. Norskov and T. F. Jaramillo, Science, 2017, 355, eaad4998 CrossRef PubMed.
- Y. Lee, J. Suntivich, K. J. May, E. E. Perry and Y. Shao-Horn, J. Phys. Chem. Lett., 2012, 3, 399–404 CrossRef CAS PubMed.
- S. Dou, C.-L. Dong, Z. Hu, Y.-C. Huang, J.-L. Chen, L. Tao, D. Yan, D. Chen, S. Shen, S. Chou and S. Wang, Adv. Funct. Mater., 2017, 27, 1702546 CrossRef.
- Y. Cheng, S. Dou, M. Saunders, J. Zhang, J. Pan, S. Wang and S. P. Jiang, J. Mater. Chem. A, 2016, 4, 13881–13889 CAS.
- H. Jin, J. Wang, D. Su, Z. Wei, Z. Pang and Y. Wang, J. Am. Chem. Soc., 2015, 137, 2688–2694 CrossRef CAS PubMed.
- Z. Xiao, Y. Wang, Y.-C. Huang, Z. Wei, C.-L. Dong, J. Ma, S. Shen, Y. Li and S. Wang, Energy Environ. Sci., 2017, 10, 2563–2569 CAS.
- H. Liang, F. Meng and M. Caban-Acevedo, et al. , Nano Lett., 2015, 15, 1421–1427 CrossRef CAS PubMed.
- M. Wei, M. Renzhi and W. Chengxiang, et al. , ACS Nano, 2015, 9, 1977–1984 CrossRef PubMed.
- F. Song and X. Hu, J. Am. Chem. Soc., 2014, 136, 16481–16484 CrossRef CAS PubMed.
- J. Chang, Y. Xiao, M. Xiao, J. Ge, C. Liu and W. Xing, ACS Catal., 2015, 5, 6874–6878 CrossRef CAS.
- X. Wang, W. Li, D. Xiong, D. Y. Petrovykh and L. Liu, Adv. Funct. Mater., 2016, 26, 4067–4077 CrossRef CAS.
- F. Wang, Y. Yu, X. Yin, P. Tian and X. Wang, J. Mater. Chem. A, 2017, 5, 9060–9066 CAS.
- H. Cheng, Y.-Z. Su, P.-Y. Kuang, G.-F. Chen and Z.-Q. Liu, J. Mater. Chem. A, 2015, 3, 19314–19321 CAS.
- D. Chen, C. L. Dong, Y. Zou, D. Su, Y. C. Huang, L. Tao, S. Dou, S. Shen and S. Wang, Nanoscale, 2017, 9, 11969–11975 RSC.
- L. Zhuang, L. Ge, Y. Yang, M. Li, Y. Jia, X. Yao and Z. Zhu, Adv. Mater., 2017, 29, 1606793 CrossRef PubMed.
- I. Abidat, C. Morais, C. Comminges, C. Canaff, J. Rousseau, N. Guignard, T. W. Napporn, A. Habrioux and K. B. Kokoh, J. Mater. Chem. A, 2017, 5, 7173–7183 CAS.
- J. Yang, C. Yu, S. Liang, S. Li, H. Huang, X. Han, C. Zhao, X. Song, C. Hao, P. M. Ajayan and J. Qiu, Chem. Mater., 2016, 28, 5855–5863 CrossRef CAS.
- C. Chen, Y. Kang, Z. Huo, Z. Zhu, W. Huang, H. L. Xin, J. D. Snyder, D. Li, J. A. Herron, M. Mavrikakis, M. Chi, K. L. More, Y. Li, N. M. Markovic, G. A. Somorjai, P. Yang and V. R. Stamenkovic, Science, 2014, 343, 1339–1343 CrossRef CAS PubMed.
- H. J. Jang, S. Hong and S. Park, J. Mater. Chem., 2012, 22, 19792–19797 RSC.
- H. Ye, Q. Wang, M. Catalano, N. Lu, J. Vermeylen, M. J. Kim, Y. Liu, Y. Sun and X. Xia, Nano Lett., 2016, 16, 2812–2817 CrossRef CAS PubMed.
- X. Hong, D. Wang, S. Cai, H. Rong and Y. Li, J. Am. Chem. Soc., 2012, 134, 18165–18168 CrossRef CAS PubMed.
- S. Luo and P. K. Shen, ACS Nano, 2017, 11, 11946–11953 CrossRef CAS PubMed.
- J. Park, J. Kim, Y. Yang, D. Yoon, H. Baik, S. Haam, H. Yang and K. Lee, Adv. Sci., 2016, 3, 8 Search PubMed.
- C. Lu, L. Qi, J. Yang, X. Wang, D. Zhang, J. Xie and J. Ma, Adv. Mater., 2005, 17, 2562–2567 CrossRef CAS.
- J. Nai, H. Yin, T. You, L. Zheng, J. Zhang, P. Wang, Z. Jin, Y. Tian, J. Liu, Z. Tang and L. Guo, Adv. Energy Mater., 2015, 5, 1401880 CrossRef.
- J. Nai, S. Wang, Y. Bai and L. Guo, Small, 2013, 9, 3147–3152 CrossRef CAS PubMed.
- C. Ji, F. Liu, L. Xu and S. Yang, J. Mater. Chem. A, 2017, 5, 5568–5576 CAS.
- L. Qian, L. Gu, L. Yang, H. Yuan and D. Xiao, Nanoscale, 2013, 5, 7388–7396 RSC.
- J. Li, S. Xiong, Y. Liu, Z. Ju and Y. Qian, ACS Appl. Mater. Interfaces, 2013, 5, 981–988 CAS.
- C. Jin, F. Lu, X. Cao, Z. Yang and R. Yang, J. Mater. Chem. A, 2013, 1, 12170–12177 CAS.
- A. Jayakumar, R. P. Antony, R. Wang and J. M. Lee, Small, 2017, 13, 1603102 CrossRef PubMed.
- J. Yin, P. Zhou, L. An, L. Huang, C. Shao, J. Wang, H. Liu and P. Xi, Nanoscale, 2016, 8, 1390–1400 RSC.
- R. Chen, H.-Y. Wang, J. Miao, H. Yang and B. Liu, Nano Energy, 2015, 11, 333–340 CrossRef CAS.
- J. Guo, Z. Yin, X. Zang, Z. Dai, Y. Zhang, W. Huang and X. Dong, Nano Res., 2017, 10, 405–414 CrossRef CAS.
- L. An, L. Huang, P. Zhou, J. Yin, H. Liu and P. Xi, Adv. Funct. Mater., 2015, 25, 6814–6822 CrossRef CAS.
- X.-F. Lu, D.-J. Wu, R.-Z. Li, Q. Li, S.-H. Ye, Y.-X. Tong and G.-R. Li, J. Mater. Chem. A, 2014, 2, 4706–4713 CAS.
- C. C. McCrory, S. Jung, J. C. Peters and T. F. Jaramillo, J. Am. Chem. Soc., 2013, 135, 16977–16987 CrossRef CAS PubMed.
- X. Xiao, C.-T. He, S. Zhao, J. Li, W. Lin, Z. Yuan, Q. Zhang, S. Wang, L. Dai and D. Yu, Energy Environ. Sci., 2017, 10, 893–899 CAS.
- J. J. Zhang, H. H. Wang, T. J. Zhao, K. X. Zhang, X. Wei, Z. D. Jiang, S. I. Hirano, X. H. Li and J. S. Chen, ChemSusChem, 2017, 10, 2875–2879 CrossRef CAS PubMed.
- J. Bao, X. Zhang, B. Fan, J. Zhang, M. Zhou, W. Yang, X. Hu, H. Wang, B. Pan and Y. Xie, Angew. Chem., Int. Ed. Engl., 2015, 54, 7399–7404 CrossRef CAS PubMed.
- Z. Cai, Y. Bi, E. Hu, W. Liu, N. Dwarica, Y. Tian, X. Li, Y. Kuang, Y. Li, X.-Q. Yang, H. Wang and X. Sun, Adv. Energy Mater., 2018, 8, 1701694 CrossRef.
- X. Wang, T.-T. Li and Y.-Q. Zheng, Int. J. Hydrogen Energy, 2018, 43, 2009–2017 CrossRef CAS.
- Y.-Z. Su, Q.-Z. Xu, G.-F. Chen, H. Cheng, N. Li and Z.-Q. Liu, Electrochim. Acta, 2015, 174, 1216–1224 CrossRef CAS.
- L. Xu, Q. Jiang, Z. Xiao, X. Li, J. Huo, S. Wang and L. Dai, Angew. Chem., Int. Ed. Engl., 2016, 55, 5277–5281 CrossRef CAS PubMed.
- T. Ling, D. Y. Yan, Y. Jiao, H. Wang, Y. Zheng, X. Zheng, J. Mao, X. W. Du, Z. Hu, M. Jaroniec and S. Z. Qiao, Nat. Commun., 2016, 7, 12876 CrossRef CAS PubMed.
- H. Hu, B. Guan, B. Xia and X. W. Lou, J. Am. Chem. Soc., 2015, 137, 5590–5595 CrossRef CAS PubMed.
- J. X. Feng, S. H. Ye, H. Xu, Y. X. Tong and G. R. Li, Adv. Mater., 2016, 28, 4698–4703 CrossRef CAS PubMed.
- V. Maruthapandian, M. Mathankumar, V. Saraswathy, B. Subramanian and S. Muralidharan, ACS Appl. Mater. Interfaces, 2017, 9, 13132–13141 CAS.
- M. Tahir, L. Pan, F. Idrees, X. Zhang, L. Wang, J.-J. Zou and Z. L. Wang, Nano Energy, 2017, 37, 136–157 CrossRef CAS.
- Z. Chen, C. X. Kronawitter, Y.-W. Yeh, X. Yang, P. Zhao, N. Yao and B. E. Koel, J. Mater. Chem. A, 2017, 5, 842–850 CAS.
- T. Shinagawa, A. T. Garcia-Esparza and K. Takanabe, Sci. Rep., 2015, 5, 13801 CrossRef PubMed.
- G. Zhang, H. Wang, J. Yang, Q. Zhao, L. Yang, H. Tang, C. Liu, H. Chen, Y. Lin and F. Pan, Inorg. Chem., 2018, 57, 2766–2772 CrossRef CAS PubMed.
- B. Cui, H. Lin, J.-B. Li, X. Li, J. Yang and J. Tao, Adv. Funct. Mater., 2008, 18, 1440–1447 CrossRef CAS.
- H. Liu, Y. Wang, X. Lu, Y. Hu, G. Zhu, R. Chen, L. Ma, H. Zhu, Z. Tie, J. Liu and Z. Jin, Nano Energy, 2017, 35, 350–357 CrossRef CAS.
- Z. Lu, H. Wang, D. Kong, K. Yan, P.-C. Hsu, G. Zheng, H. Yao, Z. Liang, X. Sun and Y. Cui, Nat. Commun., 2014, 5, 4345 CAS.
- P. Chen, K. Xu, Z. Fang, Y. Tong, J. Wu, X. Lu, X. Peng, H. Ding, C. Wu and Y. Xie, Angew. Chem., Int. Ed. Engl., 2015, 54, 14710–14714 CrossRef CAS PubMed.
- L. Zhao, B. Dong, S. Li, L. Zhou, L. Lai, Z. Wang, S. Zhao, M. Han, K. Gao, M. Lu, X. Xie, B. Chen, Z. Liu, X. Wang, H. Zhang, H. Li, J. Liu, H. Zhang, X. Huang and W. Huang, ACS Nano, 2017, 11, 5800–5807 CrossRef CAS PubMed.
- C. G. Morales-Guio, L. Liardet and X. Hu, J. Am. Chem. Soc., 2016, 138, 8946–8957 CrossRef CAS PubMed.
- T. Y. Ma, S. Dai, M. Jaroniec and S. Z. Qiao, J. Am. Chem. Soc., 2014, 136, 13925–13931 CrossRef CAS PubMed.
- B. Lu, D. Cao, P. Wang, G. Wang and Y. Gao, Int. J. Hydrogen Energy, 2011, 36, 72–78 CrossRef CAS.
- Q. Kang, L. Vernisse, R. C. Remsing, A. C. Thenuwara, S. L. Shumlas, I. G. McKendry, M. L. Klein, E. Borguet, M. J. Zdilla and D. R. Strongin, J. Am. Chem. Soc., 2017, 139, 1863–1870 CrossRef CAS PubMed.
- H. Liu, X. Ding, L. Wang, D. Ding, S. Zhang and G. Yuan, Electrochim. Acta, 2018, 259, 1004–1010 CrossRef CAS.
- S. Chen and S. Z. Qiao, ACS Nano, 2013, 7, 10190–10196 CrossRef CAS PubMed.
- A. Oh, Y. J. Sa, H. Hwang, H. Baik, J. Kim, B. Kim, S. H. Joo and K. Lee, Nanoscale, 2016, 8, 16379–16386 RSC.
- L. Yang, Q. Zhan, Z. Wang, Q. Chen, J. Tong, D. Fang, L. Xia and M. Jin, J. Mater. Chem. A, 2017, 5, 10150–10153 CAS.
- S. Luo, M. Tang, P. K. Shen and S. Ye, Adv. Mater., 2017, 29, 1601687 Search PubMed.
- J. Park, Y. J. Sa, H. Baik, T. Kwon, S. H. Joo and K. Lee, ACS Nano, 2017, 11, 5500–5509 CrossRef CAS PubMed.
- S. Oh, H. Kim, Y. Kwon, M. Kim, E. Cho and H. Kwon, J. Mater. Chem. A, 2016, 4, 18272–18277 CAS.
- C. Yu, Z. Liu, X. Han, H. Huang, C. Zhao, J. Yang and J. Qiu, Carbon, 2016, 110, 1–7 CrossRef CAS.
- S. Liu, L. Li, H. S. Ahn and A. Manthiram, J. Mater. Chem. A, 2015, 3, 11615–11623 CAS.
- S. K. Singh, V. M. Dhavale and S. Kurungot, ACS Appl. Mater. Interfaces, 2015, 7, 442–451 CAS.
Footnote |
| † Electronic supplementary information (ESI) available: Additional information includes morphology characterizations, crystalline structure characterizations and electrochemical measurements of NiCo2O4, Co3O4 and NiO nanoframes. See DOI: 10.1039/c8qm00027a |
| This journal is © the Partner Organisations 2018 |


