
The important role of salivary α-amylase in the gastric digestion of wheat bread starch
Daniela
Freitas
 ,
Steven
Le Feunteun
*,
Maud
Panouillé
and
Isabelle
Souchon
,
Steven
Le Feunteun
*,
Maud
Panouillé
and
Isabelle
Souchon
UMR GMPA, AgroParisTech, INRA, Université Paris-Saclay, 78850, Thiverval-Grignon, France. E-mail: steven.le-feunteun@inra.fr
First published on 4th December 2017
Abstract
The role of salivary α-amylase (HSA) in starch digestion is often overlooked in favour of that of pancreatic α-amylase due to the short duration of the oral phase. Although it is generally accepted that the amylase of salivary origin can continue to be active in the stomach, studies ascertaining its contribution are lacking. This study aimed to address this issue by coupling in vitro oral processing with an in vitro dynamic system that mimicked different postprandial gastric pH reduction kinetics observed in vivo following a snack- or lunch-type meal. The digestion of both starch and protein from wheat bread as well as the interplay between the two processes were studied. We have observed that the amylolytic activity of saliva plays a preponderant role hydrolysing up to 80% of bread starch in the first 30 min of gastric digestion. Amylolysis evolved exponentially and nearly superimposing curves were obtained regardless of the acidification profiles, revealing its high efficiency.
1. Introduction
Nutrition is a complex process in which not only the type and quantity of nutrients ingested are important, but also their rates of digestion and absorption, particularly for carbohydrates and proteins. The most frequently used reference tool to classify the rate of carbohydrate digestion and absorption is the glycaemic index (GI).1 Different meta-analysis studies have found evidence of an association between high GI diets and an increased risk of type-2 diabetes,2 coronary heart disease in women,3,4 breast cancer,5 as well as obesity-related complications.6 Likewise, protein resistance to digestion and the rate at which it is digested can influence the mechanisms that trigger food allergies7 and the efficiency of postprandial protein metabolism,8–10 respectively.The association between carbohydrates and proteins forms the elementary structure of many cereal-based staple foods such as wheat bread, one of the main sources of carbohydrates in the human diet.11 One loaf of bread consists of about 50% starch, 40% water and 7% protein by weight.12 Wheat starch consists of around 23% amylose (essentially linear) and 73% amylopectin (larger and branched).13 These polymers are made up of α-1,4-linked glucose residues in linear segments and α-1,6-linked glucose residues at branch points.13
Given that starch is generally the main source of digestible carbohydrate in the human diet,14 the physiological impact of its digestion kinetics has been widely studied, and slowly digestible starch has been linked to beneficial effects on common diet-related chronic diseases such as diabetes and pre-diabetes, cardiovascular diseases and obesity.15
Starch digestion starts in the oral cavity (when saliva is mixed with food particles) due to the action of human salivary α-amylase (HSA) which breaks down amylose and amylopectin by cleaving their α-1-4 glycosidic bonds.16 Its role is often considered of little significance due to the short duration of the oral phase, but this line of thought can be challenged after analysing some bibliographical data. Indeed, bread boli are typically formed within 16 to 50 seconds, depending on the type of bread and the characteristics of the individual.17,18 However, once boli are swollen, HSA can continue hydrolysing starch in the stomach16,19 until the pH decreases below 4.0 and the enzyme is inactivated.20 As postprandial gastric acidification is a gradual process, it can take over 45 min to reach this pH level.21 The data from human studies showing that HSA can remain active in the stomach long after the short oral processing phase, and might even reach the small intestine without becoming inactive, indicate that this enzyme can be responsible for hydrolysing an important fraction of starch.20 Additionally, according to an interesting article from the early 20th century, also reporting the results of a human study, up to 76% of the starch in mashed potatoes and 59% of that in bread are hydrolysed into maltose by HSA in the stomach.22 Since no other amylase is present, only that of salivary origin can be responsible for the enzymatic hydrolysis of starch during gastric digestion.16 Nonetheless, this work seems to have been forgotten within the scientific community, considering that the extent of HSA's contribution to starch digestion remains unclear14 and the final digestive stage is often considered of higher importance. The last stage of starch digestion occurs in the small intestine, where pancreatic α-amylase and brush border enzymes complete amylolysis, and the ultimate product of this process, glucose, is finally absorbed into the bloodstream.19
Proteins in wheat bread consist of about 25% soluble proteins and 75% insoluble gluten proteins.23 In contrast to the digestion of starch, proteolysis only begins in the stomach with the combined action of hydrochloric acid (HCl) and pepsin, the gastric protease.19 HCl has a double action: it causes proteins to unfold or uncoil due to the breakage of hydrogen and electrostatic bonds19 and enables the activation of pepsin.19,24 Human pepsin starts being active below pH 5.5 and exhibits maximum activity at pH 2.24 The products of gastric proteolysis consist of a mixture of large polypeptides, oligopeptides and free amino acids.19 Protein digestion is completed in the small intestine by the action of different proteases and peptidases before the absorption of small peptides and free amino acids.19
At a macroscopic level, bread is characterized as a solid foam.25 At a molecular level, the bread foam contains a continuous phase and a discontinuous phase. The continuous phase is formed by an elastic network of cross-linked gluten molecules and leached starch polymers that may integrate starch–gluten associations (starch–gluten fibrils).25 The discontinuous phase consists of gelatinized, swollen, deformed starch granules entrapped in the continuous phase.25 Given the intricate association of starch and gluten in bread, an interdependence of their digestive processes can be expected. This was recently shown using an in vitro static digestion model where the pH was kept stable during each digestive stage.26 Expanding our understanding of the digestive process of starch, and how this influences the digestion of proteins, is an important step towards the development of food products with potential health-supporting digestion rates. However, to preserve the biological relevance of the results, it is important that the digestive conditions reflect as closely as possible those found in vivo. Therefore, our purpose was to re-evaluate the role of HSA in the form in which it is found in the human digestive tract (i.e. in saliva, non-purified), and to study the digestion kinetics of bread starch and proteins during oral and gastric processing using DiDGI®, an in vitro model capable of mimicking the key dynamic aspects of our digestive environment. Bread was selected as a model food due to its macronutrient profile and its importance in our diet.
2. Materials and methods
2.1. Materials
The bread used in this study was a French wheat baguette supplied by Lesaffre (Marcq-en-Baroeul, France) that has been characterized during previous studies carried out in our lab.17 Only the crumb of the baguette was used in all the experimental work.Human saliva from one non-smoker volunteer was used for the determination of HSA activity as a function of pH and for the preparation of saliva-based boli after informed consent was obtained. The subject was asked to abstain from tooth brushing, food and drinks for at least two hours prior to saliva collection. On each trial day, mechanically stimulated saliva was collected at 9 AM, aliquoted and conserved at 4 °C until usage (for a maximum period of 6 hours). Saliva was used in all experiments requiring HSA. Given that HSA's activity can be influenced by the salts naturally present in saliva,27 no pre-treatments (excluding freezing and thawing) were employed in order to reinforce the physiological relevance of the results. Immediately before each digestion experiment, saliva aliquots were placed in a water bath for 5 min and brought to 37 °C. The commercial enzymes used in this study were: amyloglucosidase from Aspergillus niger (ref. 10 102 857 001, from Roche, Switzerland), pepsin from gastric mucosa (P-6887) and pancreatic α-amylase (A-3176), both of porcine origin (Sigma-Aldrich, France). The substrate used for the determination of HSA activity was potato starch (ref. 101 253, from Merck, Germany).
2.2. Bread characterization
Total starch was determined according to a modified version of Goñi's method.28 Bread crumb samples (50 ± 5 mg) were dispersed into 10 mL of 2 M KOH solution and mixed (150 rpm) at room temperature for 30 min before 5.7 mL of 2 M HCl and 3 mL of sodium acetate buffer were added and the pH adjusted to 4.75 ± 0.1. This resulted in solutions of solubilized starch which was subsequently hydrolysed into glucose by adding 60 μL of undiluted amyloglucosidase and incubating in a shaking water bath (60 °C, 150 rpm, 45 min). After centrifugation (4 °C, 3000g, 10 min), the glucose concentration in the supernatant was determined using an enzymatic kit (D-glucose kit, ref. 103.21, BioSenTec, Toulouse, France) followed by absorbance measurements (340 nm) in 1 cm plastic cuvettes with a UV-Vis spectrometer (Evolution 201, Thermo Scientific). The total starch content was then calculated from the measured glucose as mg of glucose × 0.9.
Resistant starch was determined according to a modified version of the method of Goñi.29 Bread crumb samples (250 ± 5 mg) were incubated with 10 mL of HCl–KCl buffer (pH 1.5) and 0.2 mL of a 2.5 × 10⁵ U mL−1 pepsin solution in a shaking water bath (40 °C, 150 rpm) for 60 min. Then, 9 mL of tris-maleate buffer (pH 6.9) and 5 mL of a 0.52 U mL−1 pancreatic α-amylase solution were added. A 16 h incubation at 37 °C under agitation (150 rpm) followed. After centrifugation (4 °C, 3000g, 15 min) and supernatant removal, the starch remaining in the pellet (resistant starch) was quantified using the procedure described above for total starch.
Digestible starch was calculated as the difference between total and resistant starch.
2.3. HSA activity as a function of pH
An adapted version of Bernfeld's method30 was used to estimate the activity of HSA as a function of pH. Human saliva, collected as described in section 2.1, was diluted 10-fold (w/w) with deionized water. 13 solutions of 1% (w/v) starch and 5.8 mM NaCl were prepared in the range of pH 2 to 7.5 using HCl or NaOH for pH adjustments. For each pH level, four glass tubes containing 0.5 mL of the corresponding starch solution were incubated at 20 °C for 3 min with different volumes of diluted saliva (0, 50, 70 or 100 μL). Immediately afterwards, the solutions with a pH < 6.5 were neutralized to 7 with pre-determined volumes of NaOH solutions, and the amylolytic activity was interrupted by adding 0.5 mL of a DNS solution (containing 96 mM 3,5-dinitrosalicylic acid, 0.5 M NaOH and 0.16 M potassium tartrate). The saliva content of each tube was then standardized to 100 μL. All the tubes were placed in a boiling water bath for 15 min and cooled to room temperature in ice, before adding 4.95 mL of a Na3PO4 buffer solution and adjusting the pH to 6.9. The absorbance was then read at 540 nm, and the maltose concentration was determined from a previously established calibration curve obtained using a series of maltose solutions (0.005% to 0.2% w/v). Enzymatic activity was defined as follows: 1 unit liberated 1.0 mg of maltose from potato starch per mL of saliva in 3 min, at pH 6.9 and 20 °C.2.4. In vitro digestion: oral and gastric phases
All digestion experiments were carried out with bread crumb only. The crumb was separated from the crust with the help of a round, 3 cm diameter cookie cutter, used to cut crumb cylinders from bread slices 1.5–2 cm thick.The suitability of our in vitro boli to appropriately mimic the textural and digestive properties of in vivo boli was preliminarily assessed. In vivo boli were produced by the volunteer who donated the saliva by chewing 3 g crumb portions for 30 s. Texture profile analyses (TPA) were conducted using a TA-XT2 texture analyser (Stable Micro Systems Ltd, Godalming, UK) equipped with an ebonite 60 mm diameter cylindrical probe. Each sample was compressed twice at 4 °C and a speed of 0.83 mm s−1 up to 65% of deformation (rest period of 1 s between each cycle) to determine its hardness, adhesiveness and cohesiveness (3 replicates). Fig. 1 shows that only hardness was significantly different (higher for in vitro formed boli). As presented in Fig. 2, the digestion profiles of both types of bolus were also highly comparable, with a plateau being reached in about 15 min in all the cases.
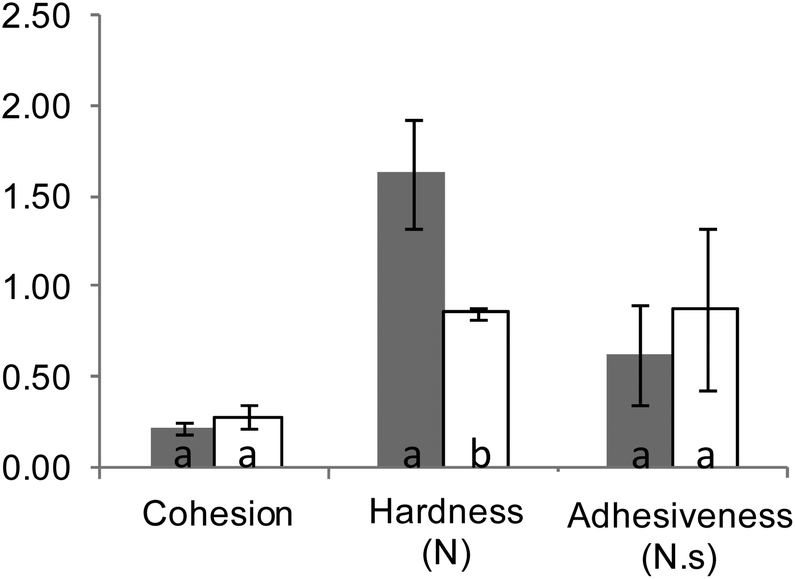 | ||
| Fig. 1 Texture profile analysis of in vitro (grey columns) and in vivo (white columns) formed boli. Different letters (a–b) denote statistically significant differences (p < 0.05) between the two types of bolus for each parameter (cohesion, hardness and adhesiveness) according to one-way ANOVA. | ||
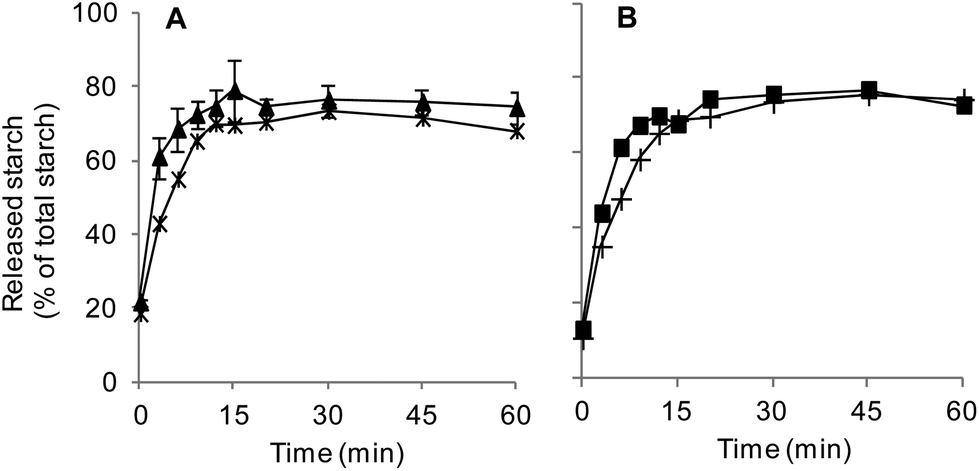 | ||
| Fig. 2 Assessment of the in vitro boli's ability to reproduce in vivo conditions. Proportion of starch released during the digestion of in vivo and in vitro formed bread boli. (A) —▲— SSB – snack-type digestion of an in vitro saliva-based bolus (average ± SD, 3 rpts.), —*— snack-type digestion of an in vivo saliva-based bolus (1 rpt.). (B) —■— CSB – constant pH digestion of an in vitro saliva-based bolus (1 rpt.), —+— constant pH digestion of an in vivo saliva-based bolus (1 rpt.). | ||
(1) “Snack-type digestion of a Water-based Bolus” (SWB): Saliva was replaced with water during the bolus preparation (i.e. no-HSA conditions), and gastric digestion lasted 60 min. The pH was gradually reduced from 6.0 to 2.0 by continuously adding 0.5 M HCl during the first 30 min of gastric digestion, and kept constant (pH 2) during the last 30 min. This pH reduction kinetics was intended to reproduce the evolution of human gastric pH following the ingestion of a bread-based snack-type meal,34 and could be classified as a physiologically fast pH reduction kinetics. SWB served as a control trial for starch digestion.
(2) “Snack-type digestion of a Saliva-based Bolus” (SSB): SSB trials only differed from SWB in the type of bolus used as saliva-based boli were used in SSB.
(3) “Lunch-type digestion of a Saliva-based Bolus” (LSB): These trials only differed from SSB in the duration of the gastric phase and the pH reduction kinetics. This digestive stage lasted 90 min and the pH reduction from 6.0 to 2.0 was performed in a 60 min period (vs. 30 min in SSB). This was done to simulate the human gastric pH conditions following the ingestion of a lunch bread-based meal.21
(4) “Constant pH (pH 6) digestion of a Saliva-based Bolus” (CSB): CSB was carried out to assess the maximum amylolytic capacity of HSA under favourable activity conditions (pH ≈ 6.0) upon the digestion of bread. This trial only differed from the SSB trials in the pH conditions used, and served as a control for protein digestion as pepsin activation was not enabled.
In addition to the first sample collected right before initiating gastric digestions, during the gastric phase, samples were also collected at 3, 9, 12, 15, 20 and 30 min, and every 15 min after this. The sampling process consisted of interrupting stirring for 30 s (to allow for particle settling) immediately before collecting a 1 mL sample from the supernatant and placing it in a dry bath (ThermoMixer C, Eppendorf) (99 °C, 5 min) for enzyme inactivation. The samples were conserved at −20 °C until required for further analysis. The SSB and LSB assays were performed in triplicate, while the others were conducted once.
2.5. Sample analysis
After thawing (12–15 hours, 4 °C) and centrifugation (10 min, 3000g, 4 °C), the supernatant of the in vitro chime samples was analysed for released starch and protein fractions.| ε280 = 5500 × nTrp + 1490 × nTyr + 125 × ncystine |
3. Results and discussion
3.1. Bread characterization
The studied baguette contained 43.4 ± 1.3 g of starch per 100 g of crumb as eaten, of which 95.9 ± 0.6% was digestible and 4.1 ± 0.6% was resistant to digestion. The protein content amounted to 5.4 g per 100 g of crumb as eaten. As mentioned above, a loaf of bread generally consists of about 50% starch, 40% water and 7% protein.12 The higher water content of the bread used in our study (49.1 ± 0.2)17 explains the slightly inferior starch and protein in comparison with values reported in the literature.3.2. Amylolytic activity of saliva as a function of pH
To understand the contribution of HSA to starch digestion, it is important to first determine its behaviour within the range of pH values it encounters throughout digestion. The evolution of human HSA's activity as a function of pH is presented in Fig. 3. The highest amylolytic activity corresponded to 352 ± 41 U mL−1, and was observed between pH 6 and 7. At around pH 4, 50% of the maximum activity was still observed, and complete inhibition occurred between pH 3.0 and 3.5 (Fig. 3).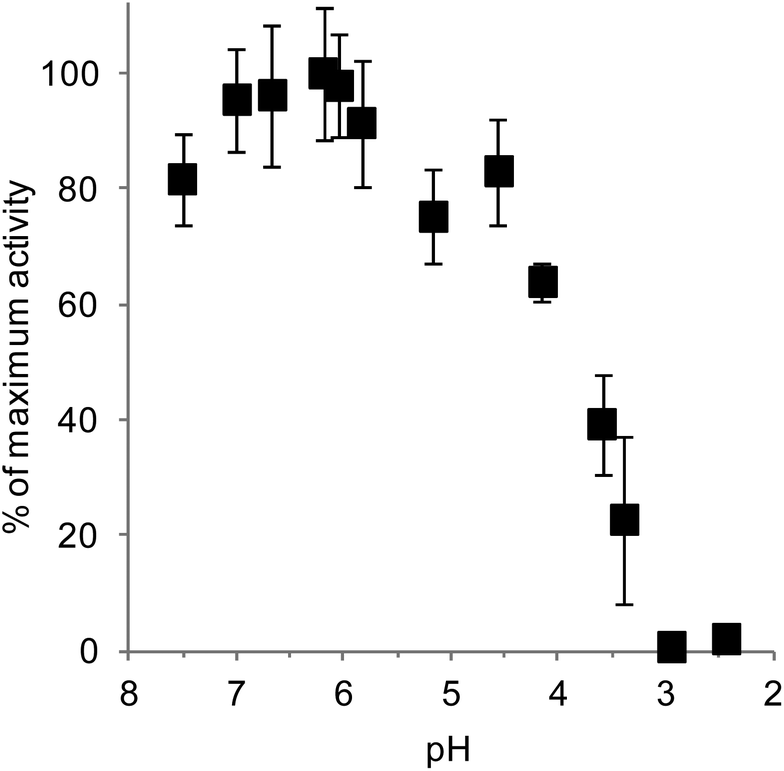 | ||
| Fig. 3 Amylolytic activity of saliva as a function of pH. The maximum activity, found at pH 6.2, was 352 ± 41 U per mL of saliva (1 unit liberated 1.0 mg of maltose from potato starch in 3 min at pH 6.9 at 20 °C). | ||
These findings are well in accordance with the literature on saliva and HSA's properties. The optimum pH of HSA (both in saliva and in purified form) has been reported to be between 6.5 and 7.0,27,30,37 and the maximal amylolytic activity of 352 U mL−1 obtained for saliva is very close to the 410 U mL−1 previously reported for centrifuged saliva30 using the same assay as in the present study. HSA in both saliva and purified form has also been reported to be inactivated at around pH 3.5, although it seems that the amylolytic activity of saliva decreases slowly when approaching this inactivation threshold compared to that of pure HSA.27,37 Indeed, it was demonstrated that saliva's amylolytic activity was preserved in human gastric juice at pH 5, and that there was a steady decrease of activity to 50% of the initial levels after 120 min of exposure to gastric juice at pH 4.3.20 This somehow contrasts with the activity of pure HSA which was shown to decrease by about 80–90% when approaching pH 4.27,37
3.3. Dynamic in vitro digestion
The role of HSA on starch digestion and the possible interplay between its action and proteolysis were studied by performing a series of in vitro digestions varying in oral and gastric conditions. A total of three distinct trials were carried out with saliva-based boli to investigate protein and starch hydrolysis when simulating snack- (SSB) and lunch-type (LSB) gastric acidification kinetics, and when keeping the pH constant at 6 (favourable to HSA and unfavourable to pepsin) (CSB). CSB also served as a protein digestion control. For the starch digestion control study, a water-based bolus (free from HSA) was used and in vitro gastric digestion (SWB) was carried out under the same conditions as in the SSB trials. The results obtained are presented in Fig. 4A, B, C and D for trials SWB, SSB, LSB and CSB, respectively. These graphs show the proportion of starch (black symbols) and total protein (white symbols) released over time, as well as the pH conditions (dotted line) during each trial. The first point in each graph corresponds, simultaneously, to the end of the oral phase (t = 2.5 min) and the beginning of gastric digestion.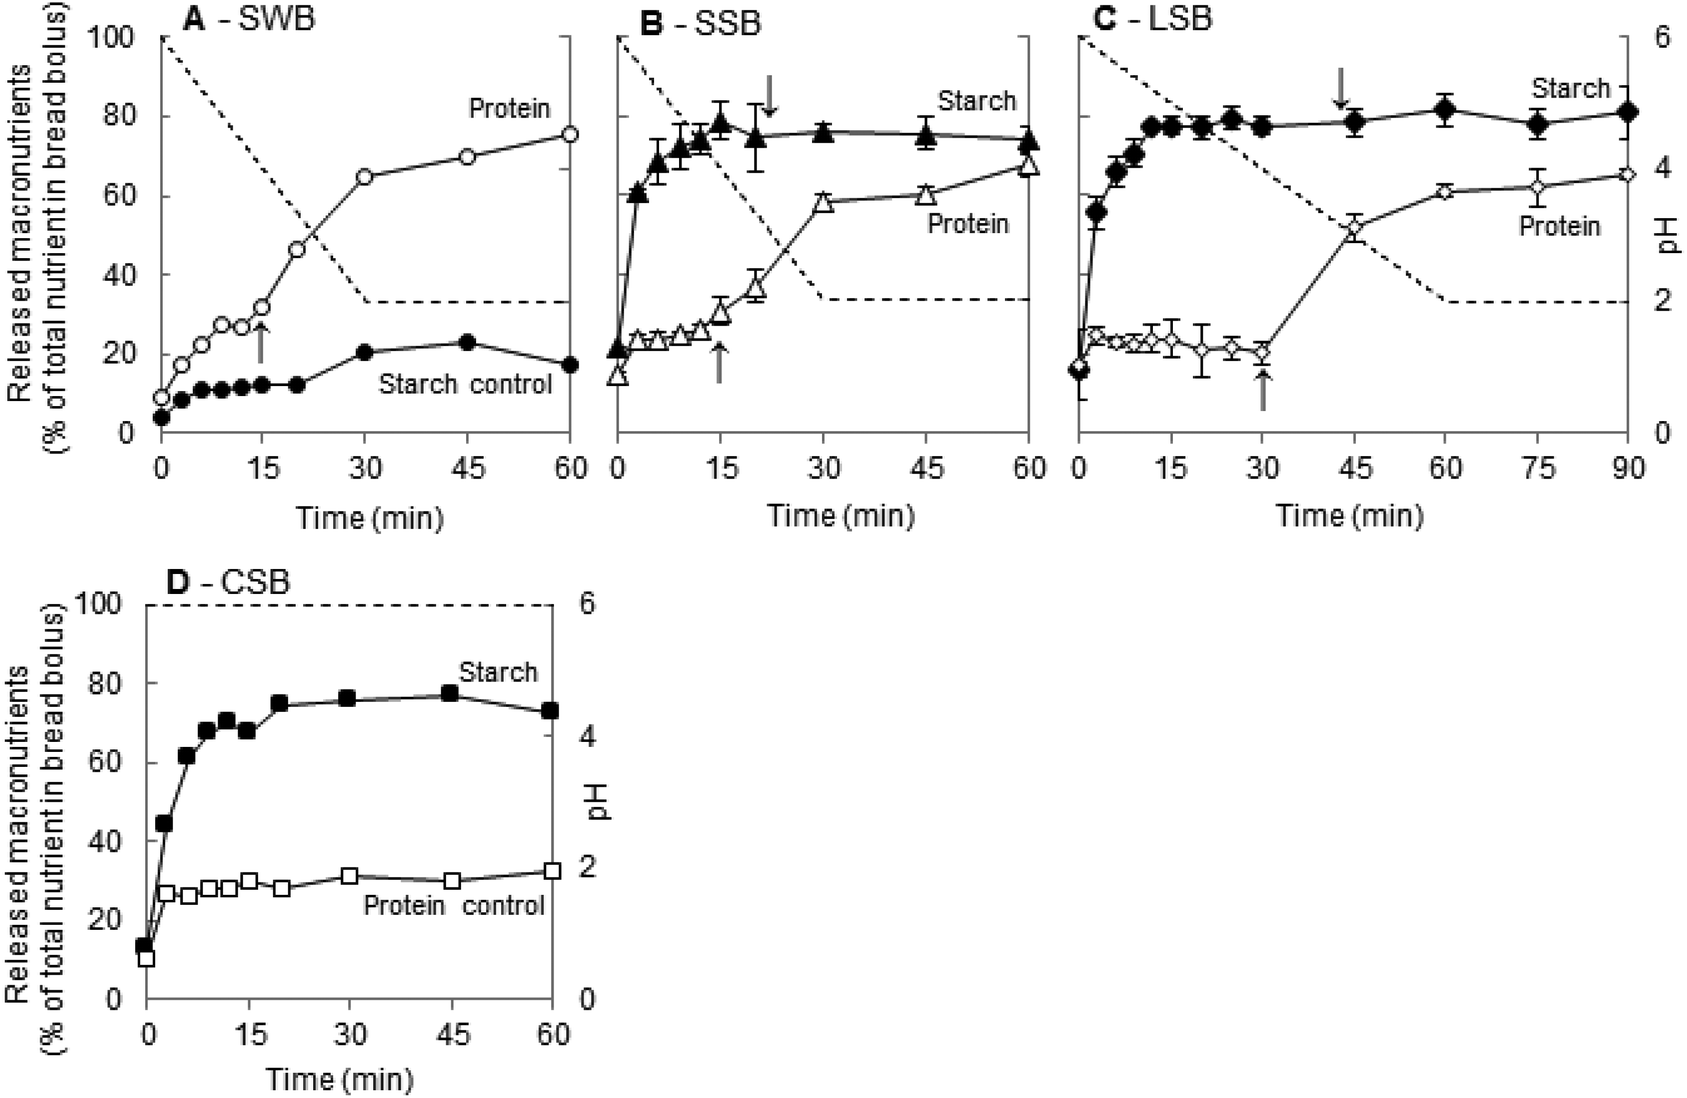 | ||
| Fig. 4 Starch and protein digestion during the in vitro oral–gastric digestion of bread. Proportion of total starch (black symbols) and protein (white symbols) released into the chime throughout the digestion. (A) SWB – snack-type digestion of a water-based bolus (1 rpt.). (B) SSB – snack-type digestion of a saliva-based bolus (average ± SD, 3 rpts.). (C) LSB – lunch-type digestion of a saliva-based bolus (average ± SD, 3 rpts.). (D) CSB – constant pH (pH 6) digestion of a saliva-based bolus (1 rpt.). In all the graphs, the dotted lines (- - -) correspond to the gastric pH conditions. In graphs A, B and C, the up arrows (↑) denote the moment when the pH conditions start enabling the activation of pepsin (porcine origin) (pH ≈ 4). In graphs B and C, the down arrows (↓) denote the moment of complete HSA inactivation (pH ≈ 3). | ||
HSA was present in all other trials (SSB, LSB and CSB). Matching its activity at different pH levels (Fig. 3) with the pH conditions imposed, inhibition of its activity by 50% was anticipated at around t = 15 min and t = 30 min during snack-type (SSB, Fig. 4B) and lunch-type (LSB, Fig. 4C) digestions, respectively. In the last type of trial (CSB, Fig. 4D) the amylolytic activity was expected to be preserved at all times. Surprisingly, the starch digestion profiles in all types of digestions were equivalent, showing an exponential evolution up to a plateau just under 80% of the total starch released, reached within the first 20 min of digestion. Amylolysis did not seem to be impaired through early HSA inhibition (SSB trials), nor promoted through the extension of its activity period (LSB and CSB trials). In fact, no matter what the pH conditions, and therefore the time HSA remained active, starch hydrolysis evolved exponentially into nearly superimposable curves with similar plateaus always being reached before HSA inactivation (Fig. 4). This suggests that the process had already been completed within the first 20 min of digestion, demonstrating the effectiveness and relevance of this enzyme.
By considering the first data points in Fig. 4B, C and D (dark symbols, SSB and LSB digestions), we found that 18.5 ± 3.6% (mean ± std, 9 replicates) of the starch was released at the start of the gastric phase. By comparing these results with those obtained in the absence of HSA (SWB trial) (Fig. 4A), it is possible to deduce that this enzyme was responsible for hydrolysing at least 13% of bread starch by the end of the oral phase and an additional 50% within the first 30 min of gastric digestion.
Starch hydrolysis during the oral phase was investigated before. The team of Woolnough and colleagues, for example, found that 13% of bread starch was hydrolysed (either completely to glucose, or partially to dextrins) by HSA during a typical chewing cycle in vivo38 which is close to the results obtained in our study. Furthermore, despite possible intra-individual variations39 the similarity between the oral phases containing HSA (first point in the SSB, LSB and CSB graphs) indicates that any possible variations in the saliva's amylolytic profile were minimal. The same team also concluded that the presence of this enzyme did not influence the starch digestion profiles during in vitro intestinal digestions, questioning its relevance to the digestive process.38 However, they used a method that simulated an instantly acidified gastric phase38 leading to the immediate inhibition of the amylolytic activity after the oral phase, which, as discussed above, does not represent human biological reality.20,21,34
The similarity between our results and those from Bergeim's in vivo studies,22 both showing hydrolysis levels of at least 50% at the end of the gastric digestion of bread, strengthens the biological significance of our study as well as the usefulness and importance of using dynamic digestion models in such studies. To the best of the authors’ knowledge, this was the first time that the contribution of HSA to starch digestion during the gastric phase was quantitatively assessed with a dynamic digestion model. Our results not only support its relevance in the process, but also highlight its efficiency as, overall, the process was not affected by the pH reduction kinetics.
Around 20% of the starch remained intact by the end of all trials containing HSA. If the limiting factor here was enzymatic inactivation, the degradation of this starch fraction would have proceeded when the amylolytic activity was preserved (CSB), which was not the case (Fig. 4D). Our findings appear to reveal the existence of some form of starch resistance to gastric digestion. The concepts of resistant and digestible starch used to characterize the bread studied here are well defined in the literature and refer to the whole process of digestion.1 The initial bread characterization revealed that only around 4% of the total starch in bread was resistant to digestion. Our present results thus suggest that there is a larger fraction of starch, of about 20%, that resists digestion up to the gastric phase. As further discussed in section 3.3.3., this is possibly due to the in vivo chronology of salivary amylase and pepsin actions, and the fact that starch is embedded in the gluten network of bread.
In the other in vitro digestions, proteolysis was enabled through an acidification of the chime to levels that supported pepsin activation (SSB, SWB and LSB trials). Porcine pepsin, the type of pepsin used in our experiments, starts being active at pH below 4 and exhibits maximum activity at around pH 2.40,41 In SSB, SWB and LSB digestions, and similarly to the CSB control, during the first minutes of gastric digestion, while the pH was above 5, there was an increase in the protein concentration followed by a plateau at around 25% of the total protein solubilized. This plateau lasted only until the pH decreased to about 4, enabling proteolysis. At this transition point, a second rise was initiated. In LSB trials (Fig. 4C) the pH reduction was twice as slow as in SSB and SWB, explaining the twice as long duration of the initial plateau. By the end of all the trials, 65% to 75% of the total protein in bread had been released.
Considering that it appears safe to presume that the initial plateau in the SSB, LSB and SWB trials corresponds to the soluble protein fraction, the transition from this plateau to the second rise, representing about 45% of the total protein, resulted from the release of protein fractions from the insoluble gluten network (equivalent to about 50% thereof). Peptic digestion was relatively slow and incomplete. This result is in accordance with findings reported by other researchers indicating that gluten proteins can be quite resistant to in vitro gastric digestion.26 Additionally, our protein quantification method accounted for all solubilized protein fractions indiscriminately; therefore, it is possible that large fragments resisted proteolysis as demonstrated in the work of Smith and colleagues.26
By comparing the CSB results (Fig. 4D) with those from SSB and LSB, we can observe that starch hydrolysis did not seem to be impaired in the absence of proteolytic activity. However, as previously stated, the second rise in the starch release profile in the absence of HSA (Fig. 4A) can be attributed to the effect of pepsin action, thereby reflecting starch–gluten interactions. Indeed, this increase coincided with pepsin activation and degradation of the gluten network, which probably could have led to the release of starch fractions initially entrapped within it. Moreover, these molecular arrangements can also explain, at least in part, the fact that the proportion of starch remaining intact by the end of the gastric digestion trials was about 5 times higher than the fraction of resistant starch found in this bread. This explanation is supported by the distinct protocols used in the resistant starch and digestion experiments. To determine the resistant starch fraction (section 2.2.2) foods are first incubated with a pepsin solution for one hour and amylolysis is initiated only afterwards. Due to this inversion of the proteolytic and amylolytic processes, by the time amylolysis starts, the protein was already digested and the gluten network disrupted, facilitating the hydrolysis of starch which may explain the finding of a smaller fraction of resistant starch.
4. Conclusion
We have demonstrated that HSA plays a preponderant role in the digestion of bread starch during gastric digestion in vitro and the literature shows that its role in vivo appears equally important. Moreover, in the presence of HSA, nearly superimposing exponential curves were obtained regardless of the pH reduction kinetics imposed, which reveals its high efficacy and justifies the need to re-evaluate the relevance of this enzyme in the digestive process of starch. Approximately 20% of the starch was resistant to gastric digestion, and the initial stages of protein digestion appeared to be impaired in the absence of HSA. Both of these observations could be related to starch–gluten interactions. A specific analysis of the starch and/or protein fractions produced during digestion can provide further insight into the extent of hydrolysis, and it is recommended for future studies.Finally, our results offer a key insight into the digestive process of starchy foods and show the need for accurately replicating the dynamic character of digestive conditions in in vitro studies in order to correctly determine the contribution of each mechanism.
Abbreviations
| HSA | Human salivary α-amylase |
| SWB | Snack-type digestion of a Water-based Bolus |
| SSB | Snack-type digestion of a Saliva-based Bolus |
| LSB | Lunch-type digestion of a Saliva-based Bolus |
| CSB | Constant pH (pH 6) digestion of a Saliva-based Bolus |
Conflicts of interest
There are no conflicts of interest to declare.Acknowledgements
The authors would like to thank David Forest and Thomas Cattenoz for their technical help during the experimental trials. This study was financially supported by the INRA through the PRODIPAIN project developed in collaboration with the UR 1268 BIA (Nantes, France) and the Centre des Sciences du Goût et de l'alimentation (Dijon, France).References
- A. C. Dona, G. Pages, R. G. Gilbert and P. W. Kuchel, Digestion of starch: “In vivo” and “in vitro” kinetic models used to characterise oligosaccharide or glucose release, Carbohydr. Polym., 2010, 80, 599–617 CrossRef CAS.
- S. N. Bhupathiraju, D. K. Tobias, V. S. Malik, A. Pan, A. Hruby, J. E. Manson, W. C. Willett and F. B. Hu, Glycemic index, glycemic load, and risk of type 2 diabetes: results from 3 large US cohorts and an updated meta-analysis, Am. J. Clin. Nutr., 2014, 100, 218–232 CrossRef CAS PubMed.
- J.-Y. Dong, Y.-H. Zhang, P. Wang and L.-Q. Qin, Meta-Analysis of Dietary Glycemic Load and Glycemic Index in Relation to Risk of Coronary Heart Disease, Am. J. Cardiol., 2012, 109, 1608–1613 CrossRef CAS PubMed.
- A. Mirrahimi, R. J. de Souza, L. Chiavaroli, J. L. Sievenpiper, J. Beyene, A. J. Hanley, L. S. A. Augustin, C. W. C. Kendall and D. J. A. Jenkins, Associations of Glycemic Index and Load With Coronary Heart Disease Events: A Systematic Review and Meta-Analysis of Prospective Cohorts, J. Am. Heart Assoc., 2012, 1, e000752 Search PubMed.
- P. Mullie, A. Koechlin, M. Boniol, P. Autier and P. Boyle, Relation between Breast Cancer and High Glycemic Index or Glycemic Load: A Meta-analysis of Prospective Cohort Studies, Crit. Rev. Food Sci. Nutr., 2016, 56, 152–159 CrossRef CAS PubMed.
- L. Schwingshackl and G. Hoffmann, Long-term effects of low glycemic index/load vs. high glycemic index/load diets on parameters of obesity and obesity-associated risks: A systematic review and meta-analysis, Nutr., Metab. Cardiovasc. Dis., 2013, 23, 699–706 CrossRef CAS PubMed.
- K. L. Bøgh and C. B. Madsen, Food allergens: Is There a Correlation between Stability to Digestion and Allergenicity?, Crit. Rev. Food Sci. Nutr., 2016, 56, 1545–1567 CrossRef PubMed.
- M. Dangin, Y. Boirie, C. Guillet and B. Beaufrère, Influence of the protein digestion rate on protein turnover in young and elderly subjects, J. Nutr., 2002, 132, 3228S–3233S CAS.
- S. Walrand, C. Gryson, J. Salles, C. Giraudet, C. Migné, C. Bonhomme, P. Le Ruyet and Y. Boirie, Fast-digestive protein supplement for ten days overcomes muscle anabolic resistance in healthy elderly men, Clin. Nutr., 2016, 35, 660–668 CrossRef CAS PubMed.
- R. Koopman, N. Crombach, A. P. Gijsen, S. Walrand, J. Fauquant, A. K. Kies, S. Lemosquet, W. H. Saris, Y. Boirie and L. J. van Loon, Ingestion of a protein hydrolysate is accompanied by an accelerated in vivo digestion and absorption rate when compared with its intact protein, Am. J. Clin. Nutr., 2009, 90, 106–115 CrossRef CAS PubMed.
- E. Wirfält, A. McTaggart, V. Pala, B. Gullberg, G. Frasca, S. Panico, H. B. Bueno-de-Mesquita, P. H. M. Peeters, D. Engeset, G. Skeie, M. D. Chirlaque, P. Amiano, E. Lundin, A. Mulligan, E. A. Spencer, K. Overvad, A. Tjønneland, F. Clavel-Chapelon, J. Linseisen, U. Nöthlings, E. Polychronopoulos, K. Georga, U. R. Charrondière and N. Slimani, Food sources of carbohydrates in a European cohort of adults, Public Health Nutr., 2002, 5, 1197–1215 CrossRef PubMed.
- I. M. C. Pateras, in Technology of Breadmaking, ed. S. P. Cauvain and L. S. Young, Springer US, Boston, MA, 2nd edn, 2007, pp. 275–298, DOI:10.1007/0-387-38565-7_10.
- C. E. Stauffer, in Technology of Breadmaking, ed. S. P. Cauvain and L. S. Young, Springer US, Boston, MA, 2nd edn, 2007, pp. 299–332, DOI:10.1007/0-387-38565-7_11.
- P. J. Butterworth, F. J. Warren and P. R. Ellis, Human α-amylase and starch digestion: An interesting marriage, Starch/Staerke, 2011, 63, 395–405 CrossRef CAS.
- M. Miao, B. Jiang, S. W. Cui, T. Zhang and Z. Jin, Slowly digestible starch–A review, Crit. Rev. Food Sci. Nutr., 2015, 55, 1642–1657 CrossRef CAS PubMed.
- G. M. Bornhorst and R. P. Singh, Bolus formation and disintegration during digestion of food carbohydrates, Compr. Rev. Food Sci. Food Saf., 2012, 11, 101–118 CrossRef CAS.
- S. Jourdren, M. Panouillé, A. Saint-Eve, I. Déléris, D. Forest, P. Lejeune and I. Souchon, Breakdown pathways during oral processing of different breads: impact of crumb and crust structures, Food Funct., 2016, 7, 1446–1457 CAS.
- M. Panouillé, A. Saint-Eve, I. Déléris, F. Le Bleis and I. Souchon, Oral processing and bolus properties drive the dynamics of salty and texture perceptions of bread, Food Res. Int., 2014, 62, 238–246 CrossRef.
- S. S. Gropper and J. L. Smith, Advanced nutrition and human metabolism, Cengage Learning, United States of America, 6th edn, 2013 Search PubMed.
- M. Fried, S. Abramson and J. H. Meyer, Passage of salivary amylase through the stomach in humans, Dig. Dis. Sci., 1987, 32, 1097–1103 CrossRef CAS PubMed.
- J.-R. Malagelada, V. L. W. Go and W. H. J. Summerskill, Different gastric, pancreatic, and biliary responses to solid-liquid or homogenized meals, Dig. Dis. Sci., 1979, 24, 101–110 CrossRef CAS PubMed.
- O. Bergeim, Intestinal chemistry: iii. Salivary digestion in the human stomach and intestines, Arch. Intern. Med., 1926, 37, 110–117 CrossRef.
- B. Belderok, J. Mesdag and D. A. Donner, in Bread-making quality of wheat: a century of breeding in Europe, ed. D. A. Donner, Kluwer Academic Publishers, Dordrecht, The Netherlands, 2000 Search PubMed.
- D. W. Piper and B. H. Fenton, pH stability and activity curves of pepsin with special reference to their clinical importance, Gut, 1965, 6, 506–508 CrossRef CAS PubMed.
- J. A. Gray and J. N. Bemiller, Bread staling: molecular basis and control, Compr. Rev. Food Sci. Food Saf., 2003, 2, 1–21 CrossRef CAS.
- F. Smith, X. Pan, V. Bellido, G. A. Toole, F. K. Gates, M. S. Wickham, P. R. Shewry, S. Bakalis, P. Padfield and E. Mills, Digestibility of gluten proteins is reduced by baking and enhanced by starch digestion, Mol. Nutr. Food Res., 2015, 59, 2034–2043 CAS.
- P. Bernfeld, A. Staub and E. H. Fischer, Sur les enzymes amylolytiques XI. Propriétés de l’α-amylase de salive humaine cristallisée, Helv. Chim. Acta, 1948, 31, 2165–2172 CrossRef CAS PubMed.
- I. Goñi, A. Garcia-Alonso and F. Saura-Calixto, A starch hydrolysis procedure to estimate glycemic index, Nutr. Res., 1997, 17, 427–437 CrossRef.
- I. Goñi, L. Garcia-Diz, E. Mañas and F. Saura-Calixto, Analysis of resistant starch: a method for foods and food products, Food Chem., 1996, 56, 445–449 CrossRef.
- P. Bernfeld, Amylases, α and β, Methods Enzymol., 1955, 1, 149–158 CAS.
- C. Hoebler, M.-F. Devaux, A. Karinthi, C. Belleville and J.-L. Barry, Particle size of solid food after human mastication and in vitro simulation of oral breakdown, Int. J. Food Sci. Nutr., 2000, 51, 353–366 CrossRef CAS PubMed.
- G. M. Bornhorst and R. P. Singh, Kinetics of in vitro bread bolus digestion with varying oral and gastric digestion parameters, Food Biophys., 2013, 8, 50–59 CrossRef.
- O. Ménard, T. Cattenoz, H. Guillemin, I. Souchon, A. Deglaire, D. Dupont and D. Picque, Validation of a new in vitro dynamic system to simulate infant digestion, Food Chem., 2014, 145, 1039–1045 CrossRef PubMed.
- V. I. Dedlovskaya, Investigation of pH of contents of the gastro-intestinal tract by a radiotelemetric method, Bull. Exp. Biol. Med., 1968, 66, 1292–1294 CrossRef.
- A. Juhász, F. Békés and C. W. Wrigley, in Applied Food Protein Chemistry, ed. Z. Ustunol, John Wiley & Sons, Ltd, Chichester, UK, 2014, pp. 219–303, DOI:10.1002/9781118860588.ch11.
- C. N. Pace, F. Vajdos, L. Fee, G. Grimsley and T. Gray, How to measure and predict the molar absorption coefficient of a protein, Protein Sci., 1995, 4, 2411–2423 CrossRef CAS PubMed.
- G. J. Walker and W. Whelan, The mechanism of carbohydrase action. 7. Stages in the salivary α-amylolysis of amylose, amylopectin and glycogen, Biochem. J., 1960, 76, 257 CrossRef CAS PubMed.
- J. W. Woolnough, A. R. Bird, J. A. Monro and C. S. Brennan, The effect of a brief salivary α-amylase exposure during chewing on subsequent in vitro starch digestion curve profiles, Int. J. Mol. Sci., 2010, 11, 2780–2790 CrossRef CAS PubMed.
- E. Neyraud, O. Palicki, C. Schwartz, S. Nicklaus and G. Feron, Variability of human saliva composition: possible relationships with fat perception and liking, Arch. Oral Biol., 2012, 57, 556–566 CrossRef CAS PubMed.
- A. Kondjoyan, J.-D. Daudin and V. Santé-Lhoutellier, Modelling of pepsin digestibility of myofibrillar proteins and of variations due to heating, Food Chem., 2015, 172, 265–271 CrossRef CAS PubMed.
- B. I. Pletschke, R. J. Naudé and W. Oelofsen, Ostrich pepsins I and II: a kinetic and thermodynamic investigation, Int. J. Biochem. Cell Biol., 1995, 27, 1293–1302 CrossRef CAS PubMed.
| This journal is © The Royal Society of Chemistry 2018 |