Effect of PAC particle layer on the performance of gravity-driven membrane filtration (GDM) system during rainwater treatment†
An
Ding
,
Jinlong
Wang
,
Dachao
Lin
,
Xiaoxiang
Cheng
,
Hui
Wang
,
Langming
Bai
,
Nanqi
Ren
,
Guibai
Li
and
Heng
Liang
 *
*
State Key Laboratory of Urban Water Resource and Environment (SKLUWRE), Harbin Institute of Technology, 73 Huanghe Road, Nangang District, Harbin, 150090, P.R. China. E-mail: dinganhit@gamil.com; chnwangjinlong@163.com; 455141870@qq.com; cxx19890823@163.com; 18004513691@163.com; andy_white@126.com; rnq@hit.edu.cn; liguibai@vip.163.com; hitliangheng@163.com
First published on 11th October 2017
Abstract
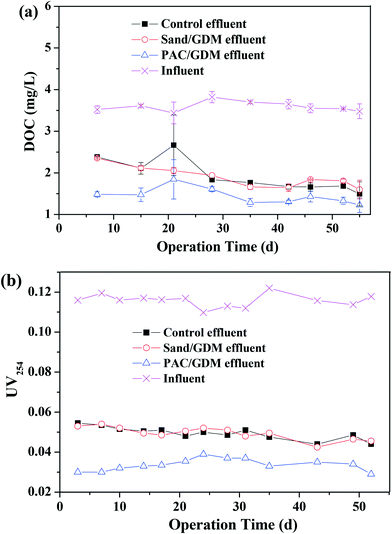
The gravity-driven membrane filtration (GDM) process is very suitable for decentralized drinking water or rainwater treatment due to low maintenance (no backwashing, physical flushing and chemical cleaning) and low energy consumption. However, the ultrafiltration process alone seldom satisfies the standard of organics removal. To meet the purpose of water reuse, we applied a powdered activate carbon (PAC) layer and sand layer on the membrane surface of a GDM system to improve the quality of the effluent in this study. In addition, the flux development and fouling layer properties were also systematically investigated. Results show that the presence of a PAC layer enhanced the organics removal by nearly 20%, including the fluorescent organics (such as aromatic proteins, tryptophan proteins and humics) removal. However, the sand layer assisted system did not show any improvement, as observed when compared with the control. With regard to the permeate flux development tendency, the flux could be kept stable in the PAC/GDM system (3.0 L m−2 h−1) and control system (4.5 L m−1 h−1), whereas the flux of the sand/GDM system did not stabilize with the final value of 2.3 L m−2 h−1 on day 55. The reason for the lower stable flux in PAC/GDM system was that PAC acted as a bio-carrier and that a large amount of biomass with higher EPS contents (proteins and polysaccharides) developed on the membrane. The main explanation for the unstable flux in the sand/GDM system was the low porosity of the bio-fouling layer, which significantly increased the hydraulically reversible and cake layer resistances. However, the permeate flux could be restored easily in these systems by simple flushing because hydraulically reversible resistance accounted for large proportions (>90%) of the total filtration resistance.
Water impactSuitable treatment of rainwater can help in it being reused as an alternative water resource. Low pressure gravity-driven membrane-based process is promising for decentralized rainwater recycling due to high removal performance, low maintenance (no backwashing, physical flushing and chemical cleaning) and low energy consumption. |
1. Introduction
Due to the scarcity of water resources, alternative and sustainable sources of water (such as rainwater, grey water and wastewater) are thus considered to supply freshwater for domestic and potable purposes.1 Among these water sources, rainwater is a natural resource, from where water can be easily collected and consumed in a variety of domestic, commercial and industrial applications, particularly where drinking water is not required.2 However, rainwater usually contains natural organic matters (NOMs), bacteria and heavy metals, which can cause severe diseases; therefore, the development of effective rainwater treatment methods are required to provide clean and safe non-potable and potable water to rural communities and informal settlements in urban areas.Traditional methods for treating contaminated water include chlorination, slow sand filtration, UV radiation, and pasteurization3 Owing to its small footprint, complete rejection of bacteria and reduced dosage of chemical disinfectant, the ultrafiltration (UF) membrane process is a promising technology for rainwater treatment. Furthermore, a gravity-driven membrane (GDM) filtration process has been proposed for decentralized water and wastewater treatment recently because of the low maintenance and low energy cost involved.4–8 It is reported that the permeate flux can always stabilize for an extended period because a heterogeneous bio-fouling layer loosely attached to the membrane surface and a biological process, such as predation, can be found in the fouling layer.9,10
However, the UF process alone could not fully reject the organic carbon, such as that in low molecular weight organics. Our previous research showed that the effluent qualities (containing humics) were even worse than that in the feed in the GDM system for stored rainwater treatment during the first 30 days.11 Wu et al.12 also reported that the GDM did not reject humics and low molecular weight neutrals for sea water pre-treatment. In order to reach the standards of potable water qualities or for water reuse purpose, pre-treatment or post-treatment needs to be put forward.
Powdered activated carbon (PAC) has been widely used alone or in combination with membrane processes. PAC can adsorb several types of organics such as microcystin, NOMs and atrazine.13–15 Moreover, the addition of PAC would influence the membrane fouling. Shao et al.16 summarized that on one hand PAC reduces the amount of organic matter deposited on the membrane surface and on the other hand PAC and the deposited organic matter have a synergistic effect on membrane fouling when they form a cake layer together. Sometimes, PAC can be irreversibly deposited on the UF membrane surface; the deposited PAC is difficult to be removed even by backwashing or bubble scouring. As is well known, the PAC in suspension could scour on the membrane and thus mitigate the cake layer fouling. However, it still remains unclear that how the PAC as a adsorbent layer influences the membrane fouling during low pressure filtration system.
To this end, three GDM systems were operated in parallel, namely (1) no particle addition as a control; (2) silica sand layer on the membrane (sand/GDM); (3) PAC layer on the membrane (PAC/GDM), to understand how the PAC particle layer/sand layer influences the organics removal (especially for the florescent organics); how PAC layer/sand layer changes the properties of the bio-fouling layer adhered to the membrane surface; and whether the presence of PAC/sand layer increases or decreases the permeate flux of GDM during rainwater recycling. Long-term dead-end filtration experiments were carried out for an operation of 55 days, monitoring the organics removal (including florescent organics) and the development of permeate flux.
2. Materials and methods
2.1 GDM setup
Three groups of GDM filtration systems were operated in parallel for an operation of 55 days, and each system had two parallel systems. The reactors were made of polymethyl methacrylate, and the flat sheet membrane was placed at the bottom of the cell (Fig. 1). The membranes were UP150 from Microdyn Nadir (Wiesbaden, Germany), made of polyethersulfone with a nominal cut-off of 150 kDa. The total filtration area in each cell was 12.5 cm2. A PAC layer was placed on the membrane surface of GDM 1 (PAC/GDM); a silica sand layer was used (with the same particle size distribution as that of PAC) in GDM 2 (sand/GDM) for comparison; GDM 3 was a control system without any particle layer addition. PAC and sand were both screened by mesh sieves (mesh 80: pore size of 180 μm; mesh 100: pore size of 150 μm), and the particle size ranged from 150 μm to 180 μm.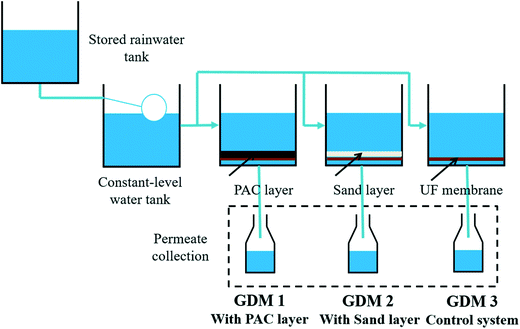 | ||
| Fig. 1 Experimental setup of GDM process for the rainwater recycling: effect of different particle layers. | ||
The concentration of the particle layer was 250 g m−2 membrane. Moreover, the surface areas were measured by a surface area analyzer (NOVA touch l × 2, quantachrome, USA). The surface areas of PAC and silica sand were calculated from the linear range of the adsorption data, as seen in Table 1.
| Particle size (μm) | Surface area (m2 g−1) | |
|---|---|---|
| PAC | 150–180 | 996 |
| Sand | 150–180 | 0.2 |
Rainwater was collected from the rooftop and runoffs of the campus of Harbin Institute of Technology and then was stored under 20 °C for more than two months. The stored rainwater was pumped in the feed tank, and a ball float valve was used to keep the water level constant at 50 cm (corresponding to the trans-membrane pressure of 50 mbar). All of the three systems were located in a dark room under a constant temperature of 20 °C.
2.2 Static adsorption test
In order to distinguish how the PAC and silica particles impacted the removal of the organics in GDM system, bench tests of static adsorption were performed before long-term GDM filtration. PAC and silica sand particles were added into the raw rainwater in conical flasks. The concentration was set at 1.13 g L−1, which was in accordance with the GDM system (volume of 1 L with 1.13 g particle on the membrane). A magnet rotor was used for mixing with a rotation speed of 120 rpm. The static adsorption tests were carried out for 72 hours under a room temperature of 20 °C.2.3 Analytical methods
![[thin space (1/6-em)]](https://www.rsc.org/images/entities/char_2009.gif) 000 g for 20 min, and then collecting the supernatants as described by Adav and Lee.18 The concentration of proteins was measured by the Lowry method.19 The concentration of polysaccharides was determined by the anthrone-sulfuric method.20 The analyses were all conducted in duplicate, and their average values were reported.
000 g for 20 min, and then collecting the supernatants as described by Adav and Lee.18 The concentration of proteins was measured by the Lowry method.19 The concentration of polysaccharides was determined by the anthrone-sulfuric method.20 The analyses were all conducted in duplicate, and their average values were reported.
2.4 Resistances-in-series model
Darcy's law was applied to evaluate the fouling resistance. The total resistance (Rt) comprises the membrane resistance (Rm), the hydraulically reversible resistance (Rr) and hydraulically irreversible resistance (Rir). Rm was determined by measuring the flux of the virgin membrane with ultrapure water. Rir and Rr were calculated by testing the flux before and after flushing the membrane surface using ultrapure water; Rt can also comprise Rm, cake layer resistance (Rc) and pore blocking resistance (Rp). Rc was measured based on the difference in the overall resistance before and after the cake layer was cleaned using a sponge. Finally, Rp was calculated by extracting Rm and Rc from Rt.233. Results and discussion
3.1 Effect of PAC layer on the flux development
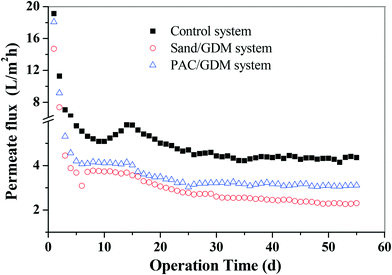
The development of the permeate flux in the three systems is presented in Fig. 2. It can be roughly divided into two stages for the whole filtration. In the first stage (from day 0 to day 25), the permeate flux decreased dramatically from 18 L m−2 h−1 (initial value of the three systems) to 3.0 L m−2 h−1 in the PAC/GDM system, 2.7 L m−2 h−1 in the sand/GDM system and 4.7 L m−2 h−1 in the control system. In the second stage (from day 25 to the end), the permeate flux in the PAC/GDM and control system remained stable with the values of around 3.0 L m−2 h−1 and 4.5 L m−2 h−1, respectively. However, the flux in the sand/GDM system could not stabilize and continuously decreased to 2.3 L m−1 h−1 on day 55. The phenomenon of flux stabilization in the GDM system was first reported by Peter-Varbanets, who found that the flux was stable during river water, lake water and diluted wastewater filtration.4 Ding et al. also found that the flux can stabilize at 2 L m−2 h−1 in a no aeration shear stress GDM system for grey water treatment.6,7 The flux stabilization in the GDM system during rainwater treatment has already been reported in our previous work.11 However, the level of the stable flux was a bit higher than in the current study. This might be due to the compositions of the feed water, which were different from each other. EEM analyses show that the feed water in this work contained aromatic proteins, tryptophan protein-like substances and humic-like substances (see section 3.3.3). Moreover, the stable flux is attributed to the development of a heterogeneous bio-fouling layer adhered to the membrane surface, and a biological process such as predation was involved in the fouling layer.9,10 As for the sand layer assisted GDM system, the flux could not be stable. The probable reason is a compact or dense fouling layer formed on the membrane, and we will discuss the underlying mechanisms in section 3.5.2.3.2 Filtration resistance distribution analyses
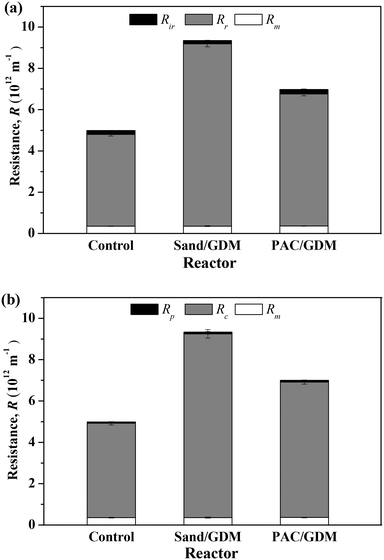
In order to figure out the reason for the lower flux in the particle layer (PAC and sand) assisted systems, the membranes were taken out for resistance distribution analyses at the end of the filtration (day 55). Fig. 3a shows the total resistance (Rt) and hydraulically reversible (Rr) and hydraulically irreversible (Rir) resistances at that time. It could be calculated that the values of Rt in the control, sand layer assisted system and PAC layer assisted system were 5.0 × 10¹², 9.3 × 10¹² and 7.0 × 10¹² m−1, respectively. The presence of sand particle layer increased the Rt by 47%. In particular, the membrane resistance was nearly the same in all the systems with a value of 0.36 × 10¹² m−1. Rr occupied a large proportion (>90%) of Rt with values of 4.4 × 10¹², 8.8 × 10¹² and 6.4 × 10¹² m−1 in the three systems. Therefore, it can be concluded that the presence of small particles seriously increased the hydraulically reversible resistance, and PAC adsorption could better alleviate the hydraulically reversible resistance compared with the sand particle. Nevertheless, simple physical cleaning (such as flushing) after long operation is a possible way to recover the permeate flux in the GDM system effectively. Fig. 3b shows the distribution of pore blocking resistance (Rp) and cake layer resistance (Rc) of the three systems. It was observed that the Rc accounted for a large percent of the Rt. Sand layer highly increased the cake layer resistance, and the PAC layer could mitigate the cake layer resistance and pore blocking resistance better in comparison with the sand/GDM system.3.3 Organics removal performance
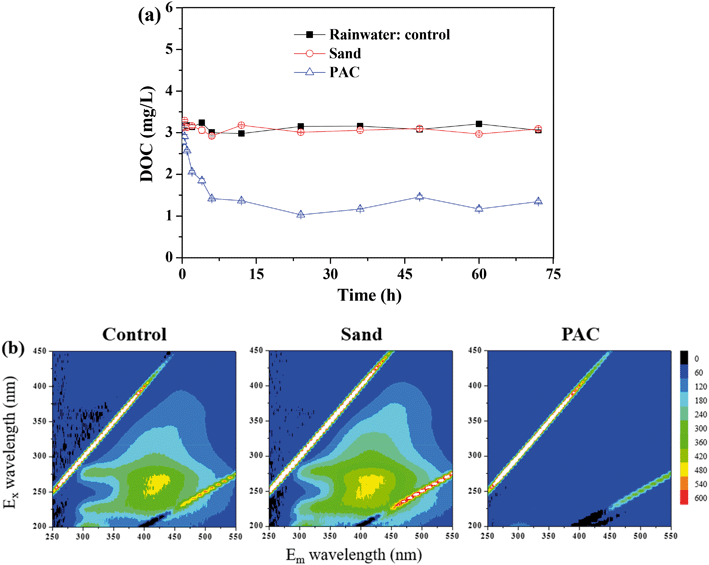 | ||
| Fig. 4 Effect of particle adsorption on the DOC removal: (a) static adsorption test; (b) EEM spectra of the samples after adsorption. | ||
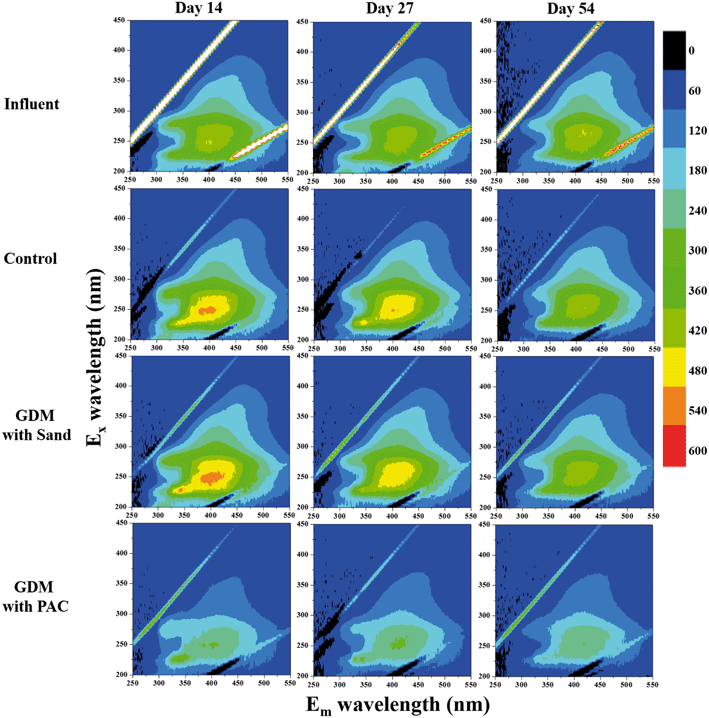
Fig. 4b shows the EEM spectra of the solutions after the adsorption. There were mainly three peaks in the feed water. Peak A (Ex/Em of 240/340–355 nm), peak B (Ex/Em of 275–280/320–330 nm) and peak C (Ex/Em of 240–260/390–445 nm) were related to the aromatic proteins, tryptophan protein-like substances and the fluorescence of fulvic acid, respectively.26–28 PAC efficiently adsorbed the aromatic proteins, tryptophan proteins and humics, whereas there was nearly no significant change in the sand group and control group. Similarly, Li et al. found that PAC can adsorb tryptophan-like substance and humic acid during algal water treatment.29
3.4 Characterization of bio-fouling layer
In order to better understand the effect of a PAC or small particle layer on the membrane fouling of the GDM system, the properties of the fouling layer attached to the membrane surface were characterized systematically.The morphology of the bio-fouling layer on the membrane surface was observed by SEM at the end of the filtration experiment. Fig. 7 shows the images of the fouling layer in the three systems, and the magnification was 5000 times. It can be seen that numerous pores developed on the fouling layer in the control system (left), and the PAC layer assisted system (right) was in the second place. The fouling layer was much denser and more compact in the sand assisted GDM system (middle) than the other two systems. It is hypothesized that the particles acted as bio-carriers, and the biomass and large molecular weight biopolymers (EPS content analyses) filled the interspace, leading to an increased density. In order to prove this, the surface porosity of the bio-fouling layer was quantified by ImageJ. As seen in Table 2, the porosity in the control system was 29.4%, which was much higher than that of the PAC/GDM system, with a value of 10.2%, and the porosity in sand/GDM was only 5.8%. Therefore, the decreased porosity of the bio-fouling layer was the important reason for the lower stable flux in the PAC/GDM system.
 | ||
| Fig. 7 SEM images of the fouling layer on the membrane surface, where the magnification was 5000 times. | ||
| Sample | Biomass (g VSS m−2) | Proteins (mg m−2) | Polysaccharides (mg m−2) | Surface porosity(%) |
|---|---|---|---|---|
| Control | 4.6 ± 0.6 | 722 ± 122 | 352 ± 55 | 29.4 ± 2.5 |
| Sand layer | 5.1 ± 0.3 | 1480 ± 79 | 657 ± 27 | 5.8 ± 1.9 |
| PAC layer | 6.2 ± 0.4 | 2263 ± 92 | 1127 ± 57 | 10.2 ± 0.3 |
In addition, the amount of the biomass adhered to the membrane surface was also measured (shown in Table 2). The amount of biomass in the PAC/GDM system was larger (6.2 g VSS m−2) than in the control (4.6 VSS m−2), followed by that in the sand/GDM system (5.1 VSS m−2). The results are in accordance with our hypothesis that the small particles acted as bio-carriers. PAC could enhance the adsorption of organic substances due to the higher specific surface area and enhance the growth of bacteria better than that by the silica sand. Similarly, Seo et al. found that adsorption played a dominant role in removing DOC in the initial period. However, the biological effect gradually increased after the following three months operation in a high concentration PAC/MBR system.30 Furthermore, EPS contents were also quantified at that time. As seen in Table 2, the proteins and polysaccharides in the PAC layer assisted system were much higher (nearly 3 times) than in the control system. The EPS content of the sand layer was in the second place. Therefore, the higher biomass with higher EPS contents (proteins and polysaccharides) in the particle layer assisted systems was another important reason for the lower flux. We will discuss the underlying fouling mechanism in section 3.5.
3.5 Fouling mechanisms
Second, the presence of the PAC layer changed the properties of the bio-fouling layer, resulting in a lower stable flux. Results showed that the surface porosity of the fouling layer in the PAC/GDM system was nearly one third of that in the control, revealing that the adsorption of organics and growth of biomass within the PAC layer led to a more compact and denser fouling layer in comparison with that of the control. Shao et al. observed that PAC increased the thickness and reduced the water permeability of the fouling cake, because water can only pass through the pore spaces between PAC particles during the humics-contaminated water filtration.33 Moreover, the EPS contents (including the proteins and polysaccharides) of the bio-fouling layer were much higher than those of the control system. It is well known that EPS and soluble microbial products (SMP, soluble EPS) play important roles in membrane fouling.34–36 NOMs, such as humics and proteins, bind PAC or SiO2 particles to one another and to the membrane surface, leading to serious fouling.37 In consequence, the growth of more biomass with higher EPS contents on the membrane was another main reason for the low level of stable flux in the PAC/GDM system.
Second, the reason for the unstable flux might be due to the porosity of the bio-fouling layer. EPS contents in PAC layer assisted system were much higher than that in the sand/GDM system; however, the permeate flux was stable and higher than that in the sand/GDM system, indicating that the stabilization of the flux was not dominated by the EPS contents. It is worth noting that the porosity of the sand layer assisted system was nearly half of that in the PAC layer assisted system, which confirmed our assumption that the porosity played a key role in flux stabilization rather than EPS contents. That is, the flux could be stable when the porosity of the fouling layer was larger than 10%; otherwise, the flux would not be stable. In the previous work, we also found the phenomenon of unstable flux in gravity-driven membrane bioreactor (GDMBR) system during the grey water treatment. The aeration shear stress on the membrane led to a very compact and dense bio-fouling layer (although the thickness of the fouling layer was lower than the control), which resulted in the unstable permeate flux.6 Therefore, the low porosity in the and/GDM system caused the unstable permeate flux.
4. Conclusions
We systematically investigated the effects of PAC layer and silica sand layer on the performance of a low pressure gravity-driven membrane filtration (GDM) process during rainwater recycling for nearly two months' operation. The following conclusions can be drawn: (1) PAC layer improved organics removal in the GDM system, particularly for aromatic proteins, tryptophan proteins and humics removals, compared with that observed for the single GDM and sand/GDM systems; (2) the permeate flux was stable in the PAC/GDM and control systems; however, the level of the stable value in the PAC/GDM system was lower than that in the control, due to a higher amount of the biomass with higher EPS contents (proteins and polysaccharides) adhered to the membrane; (3) the permeate flux did not maintain stability in the sand/GDM system, and the potential reason was that the sand layer resulted in a dense bio-fouling layer with low porosity. Although the level of stable permeate flux was lower, the increased resistance was dominated by the hydraulically reversible resistance. Therefore, simple physical flushing could recover the permeate flux easily, and it is suggested that the physical cleaning period could be more than two months in a PAC layer assisted GDM system.Conflicts of interest
There are no conflicts to declare.Acknowledgements
This work was supported jointly by the National Natural Science Foundation of China (No. 51608150), the National Science Foundation for the Outstanding Youngster Fund (51522804), the China Postdoctoral Science Foundation funded project (Grant No. 2017 M610210), the HIT Environment and Ecology Innovation Special Funds (HSCJ201603), the Fundamental Research Funds for the Central Universities (HIT. NSRIF. 2017059) and the Heilongjiang Postdoctoral Found (LBH-Z16070).References
- B. Lévesque, D. Pereg, E. Watkinson, J. S. Maguire, L. Bissonnette, S. Gingras, P. Rouja, M. G. Bergeron and É. Dewailly, Assessment of microbiological quality of drinking water from household tanks in Bermuda, Can. J. Microbiol., 2008, 54, 495–500 CrossRef PubMed.
- L. F. Sanches Fernandes, D. P. Terencio and F. A. Pacheco, Rainwater harvesting systems for low demanding applications, Sci. Total Environ., 2015, 529, 91–100 CrossRef CAS PubMed.
- J. D. Burch and K. E. Thomas, Water disinfection for developing countries and potential for solar thermal pasteurization, Sol. Energy, 1998, 64, 87–97 CrossRef.
- M. Peter-Varbanets, F. Hammes, M. Vital and W. Pronk, Stabilization of flux during dead-end ultra-low pressure ultrafiltration, Water Res., 2010, 44, 3607–3616 CrossRef CAS PubMed.
- M. Peter-Varbanets, J. Margot, J. Traber and W. Pronk, Mechanisms of membrane fouling during ultra-low pressure ultrafiltration, J. Membr. Sci., 2011, 377, 42–53 CrossRef CAS.
- A. Ding, H. Liang, G. Li, N. Derlon, I. Szivak, E. Morgenroth and W. Pronk, Impact of aeration shear stress on permeate flux and fouling layer properties in a low pressure membrane bioreactor for the treatment of grey water, J. Membr. Sci., 2016, 510, 382–390 CrossRef CAS.
- A. Ding, H. Liang, G. Li, I. Szivak, J. Traber and W. Pronk, A low energy gravity-driven membrane bioreactor system for grey water treatment: permeability and removal performance of organics, J. Membr. Sci., 2017, 542, 408–417 CrossRef CAS.
- A. Ding, J. Wang, D. Lin, X. Tang, X. Cheng, G. Li, N. Ren and H. Liang, In situ coagulation versus pre-coagulation for gravity-driven membrane bioreactor during decentralized sewage treatment: Permeability stabilization, fouling layer formation and biological activity, Water Res., 2017 DOI:10.1016/j.watres.2017.09.027.
- N. Derlon, M. Peter-Varbanets, A. Scheidegger, W. Pronk and E. Morgenroth, Predation influences the structure of biofilm developed on ultrafiltration membranes, Water Res., 2012, 46, 3323–3333 CrossRef CAS PubMed.
- N. Derlon, N. Koch, B. Eugster, T. Posch, J. Pernthaler, W. Pronk and E. Morgenroth, Activity of metazoa governs biofilm structure formation and enhances permeate flux during Gravity-Driven Membrane (GDM) filtration, Water Res., 2013, 47, 2085–2095 CrossRef CAS PubMed.
- A. Ding, J. Wang, D. Lin, X. Tang, X. Cheng, H. Wang, L. Bai, G. Li and H. Liang, A low pressure gravity-driven membrane filtration (GDM) system for rainwater recycling: Flux stabilization and removal performance, Chemosphere, 2016, 172, 21–28 CrossRef PubMed.
- B. Wu, F. Hochstrasser, E. Akhondi, N. Ambauen, L. Tschirren, M. Burkhardt, A. G. Fane and W. Pronk, Optimization of gravity-driven membrane (GDM) filtration process for seawater pretreatment, Water Res., 2016, 93, 133–140 CrossRef CAS PubMed.
- M. P. Campinas, Removal of cyanobacteria and cyanotoxins from drinking water by powdered activated carbon adsorption/ultrafiltration, Ph.D. thesis in Environmental Sciences and Technologies, University of Algarve, Faro, Portugal, 2009 Search PubMed.
- M. Campinas and M. J. Rosa, Assessing PAC contribution to the NOM fouling control in PAC/UF systems, Water Res., 2010, 44, 1636–1644 CrossRef CAS PubMed.
- S. Shao, Y. Feng, H. Yu, J. Li, G. Li and H. Liang, Presence of an adsorbent cake layer improves the performance of gravity-driven membrane (GDM) filtration system, Water Res., 2017, 108, 240–249 CrossRef CAS PubMed.
- S. Shao, L. Cai, K. Li, J. Li, X. Du, G. Li and H. Liang, Deposition of powdered activated carbon (PAC) on ultrafiltration (UF) membrane surface: influencing factors and mechanisms, J. Membr. Sci., 2017, 530, 104–111 CrossRef CAS.
- A. Chomiak, J. Traber, E. Morgenroth and N. Derlon, Biofilm increases permeate quality by organic carbon degradation in low pressure ultrafiltration, Water Res., 2015, 85, 512–520 CrossRef CAS PubMed.
- S. S. Adav and D. J. Lee, Extraction of extracellular polymeric substances from aerobic granule with compact interior structure, J. Hazard. Mater., 2008, 154, 1120–1126 CrossRef CAS PubMed.
- O. H. Lowry, N. J. Rosebrough, A. L. Farr and R. J. Randall, PROTEIN MEASUREMENT WITH THE FOLIN PHENOL REAGENT, J. Biol. Chem., 1951, 193, 265–275 CAS.
- M. DuBois, K. A. Gilles, J. K. Hamilton, P. A. Rebers and F. Smith, Colorimetric Method for Determination of Sugars and Related Substances, Anal. Chem., 1956, 28, 350–356 CrossRef CAS.
- F. Qu, H. Liang, J. He, J. Ma, Z. Wang, H. Yu and G. Li, Characterization of dissolved extracellular organic matter (dEOM) and bound extracellular organic matter (bEOM) of Microcystis aeruginosa and their impacts on UF membrane fouling, Water Res., 2012, 46, 2881–2890 CrossRef CAS PubMed.
- W. Yan, Z. Wang, J. Wu, S. Zhao, J. Wang and S. Wang, Enhancing the flux of brackish water TFC RO membrane by improving support surface porosity via a secondary pore-forming method, J. Membr. Sci., 2016, 498, 227–241 CrossRef CAS.
- A. Ding, H. Liang, F. Qu, L. Bai, G. Li, H. H. Ngo and W. Guo, Effect of granular activated carbon addition on the effluent properties and fouling potentials of membrane-coupled expanded granular sludge bed process, Bioresour. Technol., 2014, 171, 240–246 CrossRef CAS PubMed.
- H. Humbert, H. Gallard, H. Suty and J. P. Croue, Natural organic matter (NOM) and pesticides removal using a combination of ion exchange resin and powdered activated carbon (PAC), Water Res., 2008, 42, 1635–1643 CrossRef CAS PubMed.
- F. Zietzschmann, G. Aschermann and M. Jekel, Comparing and modeling organic micro-pollutant adsorption onto powdered activated carbon in different drinking waters and WWTP effluents, Water Res., 2016, 102, 190–201 CrossRef CAS PubMed.
- A. Baker, Fluorescence Excitation−Emission Matrix Characterization of Some Sewage-Impacted Rivers, Environ. Sci. Technol., 2001, 35, 948–953 CrossRef CAS PubMed.
- W. Chen, P. Westerhoff, J. A. Leenheer and K. Booksh, Fluorescence Excitation−Emission Matrix Regional Integration to Quantify Spectra for Dissolved Organic Matter, Environ. Sci. Technol., 2003, 37, 5701–5710 CrossRef CAS PubMed.
- M. N. Pons, S. Le Bonte and O. Potier, Spectral analysis and fingerprinting for biomedia characterisation, J. Biotechnol., 2004, 113, 211–230 CrossRef CAS PubMed.
- K. Li, F. Qu, H. Liang, S. Shao, Z.-S. Han, H. Chang, X. Du and G. Li, Performance of mesoporous adsorbent resin and powdered activated carbon in mitigating ultrafiltration membrane fouling caused by algal extracellular organic matter, Desalination, 2014, 336, 129–137 CrossRef CAS.
- G. T. Seo, C. D. Moon, S. W. Chang and S. H. Lee, Long term operation of high concentration powdered activated carbon membrane bio-reactor for advanced water treatment, Water Sci. Technol., 2004, 50, 81–87 CAS.
- J. Liu, Z. Wang, B. Dong and D. Zhao, Fouling behaviors correlating to water characteristics during the ultrafiltration of micro-polluted water with and without the addition of powdered activated carbon, Colloids Surf., A, 2016, 511, 320–328 CrossRef CAS.
- K. Li, H. Liang, F. Qu, S. Shao, H. Yu, Z.-S. Han, X. Du and G. Li, Control of natural organic matter fouling of ultrafiltration membrane by adsorption pretreatment: Comparison of mesoporous adsorbent resin and powdered activated carbon, J. Membr. Sci., 2014, 471, 94–102 CrossRef CAS.
- S. Shao, H. Liang, F. Qu, K. Li, H. Chang, H. Yu and G. Li, Combined influence by humic acid (HA) and powdered activated carbon (PAC) particles on ultrafiltration membrane fouling, J. Membr. Sci., 2016, 500, 99–105 CrossRef CAS.
- F. Meng, S. Zhang, Y. Oh, Z. Zhou, H. S. Shin and S. R. Chae, Fouling in membrane bioreactors: An updated review, Water Res., 2017, 114, 151–180 CrossRef CAS PubMed.
- A. Drews, Membrane fouling in membrane bioreactors—Characterisation, contradictions, cause and cures, J. Membr. Sci., 2010, 363, 1–28 CrossRef CAS.
- F. Meng, S. R. Chae, A. Drews, M. Kraume, H. S. Shin and F. Yang, Recent advances in membrane bioreactors (MBRs): membrane fouling and membrane material, Water Res., 2009, 43, 1489–1512 CrossRef CAS PubMed.
- M. Zhang, C. Li, M. M. Benjamin and Y. Chang, Fouling and natural organic matter removal in adsorbent/membrane systems for drinking water treatment, Environ. Sci. Technol., 2003, 37, 1663–1669 CrossRef CAS PubMed.
Footnote |
| † Electronic supplementary information (ESI) available. See DOI: 10.1039/c7ew00298j |
| This journal is © The Royal Society of Chemistry 2018 |

