Micro-sensors based on hypha-templated coaxial microfibers†
Li
Zhihua‡
,
Shi
Jiyong‡
,
Huang
Xiaowei
,
Zou
Xiaobo
 *,
Hu
Xuetao
,
Zhou
Xucheng
and
Haroon Elrasheid
Tahir
College of Food and Biological Engineering, Jiangsu University, Zhenjiang 212013, China. E-mail: zou_xiaobo@ujs.edu.cn
First published on 24th November 2017
Abstract
Biological templates show great potential in the fabrication of advanced materials since they are green, renewable and easy to obtain. Hyphae of Penicillium are demonstrated to be a versatile template for the fabrication of coaxial microfibers. Five kinds of nanomaterials, including ZnO, Fe3O4, Cu(OH)2, polypyrrole (PPy) and polyaniline (PANI), are coated on the hyphal surface without any modification. SEM, EDS, XRD and FT-IR were employed to confirm the morphology and chemical components of the prepared microfibers. The results showed that the fabricated nanomaterials were attached firmly on the hyphal surface to form an outside shell. An adsorption experiment showed that the cations could be attached on the hyphal surface with the help of related functional groups, which explained well the formation mechanism of the coaxial structure. Microsensors based on PANI/hypha, PPy/hypha and ZnO/hypha microfibers were fabricated and tested with TMA as the model gas. The prepared sensors showed a good linear response toward TMA with an R2 higher than 0.977, relative standard deviation for reproducibility measurement lower than 7.2%, and fast response–recovery speed, which demonstrate the applicability of the prepared coaxial microfibers.
1. Introduction
Over the past few decades, the synthesis and application of nanomaterials have drawn tremendous attention in various fields due to their interesting physical and chemical properties.1,2 A wide variety of physical, chemical and biological methods have been explored to synthesize nanomaterials with different components, morphologies and structures. Many application scenarios, such as fabrication of micro-sensors,3 design of nanomotors4 and preparation of flexible solar cells,5 always require the development of microfibers coating with functional thin layers. The size of the microfibers should be at the micrometer scale, which will facilitate their assembly under an optical microscope, while, the coating layer should be at the nanometer scale to guarantee its outstanding functionality. To achieve such a purpose, many templates have been explored for the preparation of microfibers with certain components.6 Among the reported templates, biological templates showed great potential because of their interesting structures.7,8 Compared with other templates, biological templates are green, renewable and easy to obtain. In the process of replication, the structure of biological materials provides stable and controllable conditions to guide the assembly of nanostructured materials.As a crucial subclass of fungi, mold is a fungus that grows in the form of multicellular filaments called hyphae.9 The hyphal radius of mold usually varies from 1 to 10 μm, and the length could be more than 100 μm. Furthermore, the cell wall of hyphae primarily consists of chitin, glucan and protein,10 which contain large amounts of functional groups (hydroxyl, carboxyl and amino) and makes it possible to modify the hyphal surface with other components. Thus, it is expected that hyphae may be an ideal template for the synthesis of functional microfibers. Such microfibers would have great potential to be widely applied in fields such as supercapacitors, biosensors, high-efficiency solar cells and micro-elements.
Herein, it is demonstrated that hyphae of Penicillium expansum could serve as a versatile template for the fabrication of core/shell coaxial microfibers without any surface modification. Five kinds of nanomaterials, including ZnO, Fe3O4, copper hydroxide (Cu(OH)2), polypyrrole (PPy) and polyaniline (PANI), were coated on the hyphal surface conveniently, and characterized with related methods. Furthermore, microsensors based on PANI/hypha, PPy/hypha and ZnO/hypha microfibers were fabricated to demonstrate the applicability of the coaxial microfibers.
2. Materials and methods
2.1. Strains and cultivation
Strains of Penicillium expansum (P. expansum) were obtained from the research group of Prof. Zhang Hongyin, College of Food and Biological Engineering. The strains were incubated in 500 mL of Czapek-Dox medium containing 1.5 g NaNO3, 0.5 g K2HPO4, 0.25 g MgSO4, 0.25 g KCl, 0.005 g Fe2SO4·7H2O and 15 g sucrose at 27 °C for 96 h with vigorous shaking to form mycelial balls. The mycelial balls were washed three times with sterilized water by vacuum filtering for further use.2.2. Preparation of coaxial microfibers
To prepare ZnO/hypha microfibers, 2.5 g of the hypha filter cake acquired in Section 2.1 was re-suspended in 100 mL of water containing 1 g Zn(CH3COO)2·2H2O by stirring constantly. Then, 100 mL of 1.2 M triethanolamine (TEA) was added slowly to the suspension, stirred for 5 min and aged for 1 h at 90 °C. Finally, the obtained microfibers were washed three times with sterilized water by vacuum filtering and freeze dried for 24 h to maintain the fibrous structure of the hyphae.To prepare Fe3O4/hypha microfibers, 2.5 g of the hypha filter cake was re-suspended in 100 mL of water at 60 °C. 1.193 g of FeCl2·4H2O and 3.244 g of FeCl3·6H2O were added to the suspension under the protection of nitrogen, and stirred for 20 min. Then, the pH value of the suspension was adjusted to 10 by adding ammonia (26–28%) slowly. Finally, the obtained microfibers were washed thoroughly using sterilized water with the help of a magnet and freeze dried for 24 h.
To prepare Cu(OH)2/hypha microfibers, 2.5 g of the hypha filter cake was re-suspended in 100 mL of water containing 1.25 g CuCl2·2H2O by stirring for 20 min. Then, 100 mL of Na(OH) solution (containing 0.704 g Na(OH)) was added slowly to the suspension, and stirred for 2 h at room temperature. The obtained microfibers were washed three times with sterilized water by vacuum filtering and freeze dried for 24 h.
To prepare PPy/hypha microfibers, 2.5 g of the hypha filter cake was re-suspended in 100 mL of 0.5 M H2SO4 solution containing 0.04 M pyrrole by stirring for 20 min at 0 °C. Then, 100 mL of 0.5 M H2SO4 solution containing 0.04 M ammonium persulfate was added slowly to the suspension, and stirred for 10 min. The obtained microfibers were washed three times with sterilized water by vacuum filtering and freeze dried for 24 h.
To prepare PANI/hypha microfibers, 2.5 g of the hypha filter cake was re-suspended in 100 mL of 0.5 M H2SO4 solution containing 0.04 M aniline by stirring for 20 min at 0 °C. Then, 100 mL of 0.5 M H2SO4 solution containing 0.04 M ammonium persulfate was added slowly to the suspension, and stirred for 2 h. The obtained microfibers were washed three times with sterilized water by vacuum filtering and freeze dried for 24 h.
2.3. Morphology and chemical component characterization
The scanning electron microscopy (SEM) images were taken on a Hitachi S4800 (Hitachi Ltd, Japan) by pasting the samples on conductive tape directly, the energy dispersive spectra (EDS) were obtained from an X-max EDS spectrometer (Oxford, UK), and the X-ray diffraction (XRD) analysis was conducted on a Bruker D8 diffractometer with high-intensity Cu Kα (λ = 1.54 Å). The FT-IR spectra were collected on a Thermo Scientific Nicolet iS50 FT-IR Spectrometer (Thermo Fisher, USA).2.4. Gas sensing test of sensors
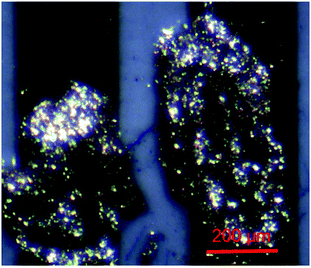
To fabricate a PANI/hypha or PPy/hypha microfiber sensor, 0.5 mg of PANI/hypha microfibers was dispersed in 100 mL water, and 3 μL of the suspension was dropped on a microelectrode. After drying in air, one of the monodispersed microfibers was connected to the electrodes with silver-epoxy adhesive. The prepared microfiber sensor is shown in Fig. 1. To prepare the ZnO/hypha sensor, the suspension was dropped on an interdigitated Au electrode as shown in our previous work,11 dried at room temperature, and then heat treated at 700 °C for 1 h prior to the measurement. The SEM image of the heat treated ZnO/hypha microfibers is shown in Fig. S2,† which still appeared as microfibers.The experimental setup and test process have been described in our previous report.11 Briefly, standard trimethylamine (TMA) gas of 5000 μg L−1 was diluted with air at different flow rates to obtain the preferred concentration, and the resistance of the sensor was measured by using a multimeter (Agilent 34410A, USA) at two-second intervals.
The relative response of the sensor was defined as:
| S = (R − R0)/R0 | (1) |
The ZnO/hypha sensor was tested at 300 °C, and the relative response was defined as:
| S = R0/R | (2) |
The response time was defined as the time taken by the sensor to attain 90% of the maximum variation in resistance on exposure to target gas and the recovery time as the time to restore 90% of the variation when exposed to air atmosphere.12
3. Results and discussion
3.1. Characterization of the coaxial microfibers
The morphology of the P. expansum hyphae and different nanomaterial, including ZnO, Fe3O4, Cu(OH)2, PPy and PANI, coated hyphae is compared in Fig. 2. To better reveal the formation of the outside shell, the images of the microfibers at lower magnification and details of the fiber surface are shown in Fig. S1.† As seen from Fig. 2a and S1a and b,† the uncoated hyphae (slightly shrank during the drying process) exhibited a rather flat, but slightly rough surface and a diameter of about 2 μm. After being covered with different materials, obviously different surface topographies were observed. For ZnO/hypha (see Fig. 2b and S1c and d†) and Fe3O4/hypha (see Fig. 2c and S1e and f†), nanoparticles with a size of ∼100 nm and ∼30 nm, respectively, were attached densely on the hyphal surface to form a shell structure, while, the shell of the Cu(OH)2/hypha microfibers (see Fig. 2d and S1g and h†) was composed of randomly oriented nanorods, which presented a fluffy surface. The PPy/hypha microfibers (see Fig. 2e and S1i and j†) showed a more compact appearance with randomly distributed islands, while the PANI/hypha (see Fig. 2f and S1k and l†) presented a slightly loose, porous structure. Furthermore, the energy dispersive spectrum (EDS) inserted in Fig. 2 preliminarily demonstrated the chemical components of each kind of microfiber.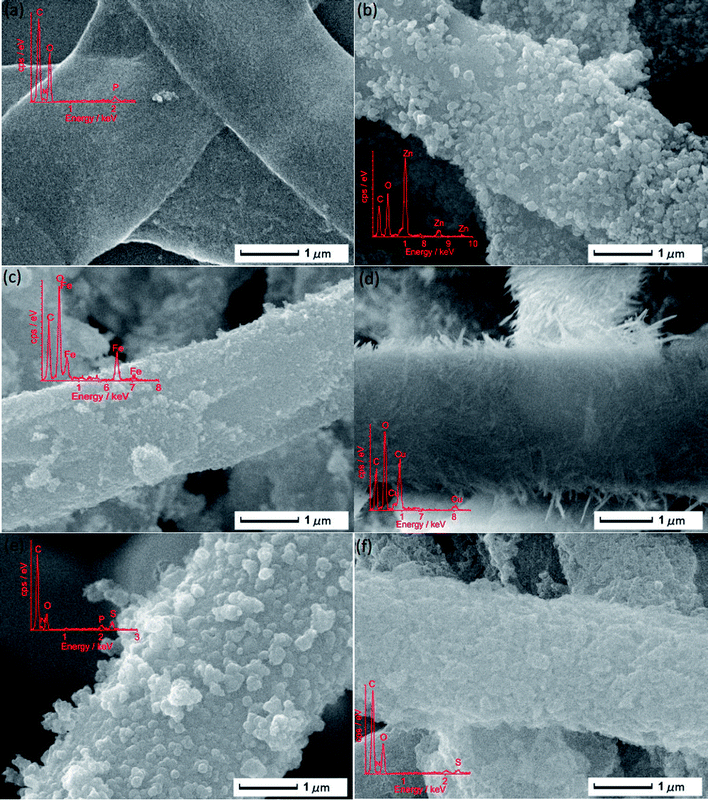 | ||
| Fig. 2 Scanning electron microscope (SEM) images of (a) P. expansum hyphae, (b) ZnO/hypha, (c) Fe3O4/hypha, (d) Cu(OH)2/hypha, (e) PPy/hypha and (f) PANI/hypha. | ||
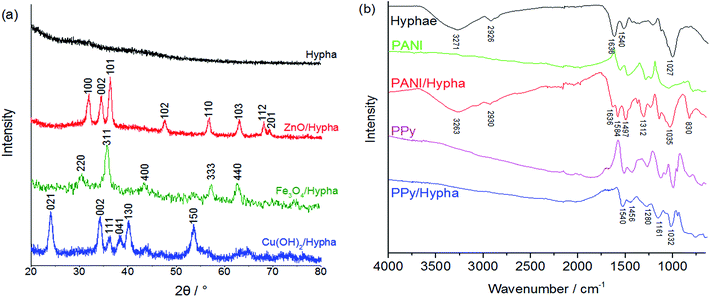
To further confirm the components of the microfibers, the ZnO/hypha, Fe3O4/hypha and Cu(OH)2/hypha were characterized by X-ray diffraction (XRD), and the PPy/hypha and PANI/hypha were characterized by Fourier Transform Infrared Spectroscopy (FT-IR). The corresponding XRD and FT-IR spectra of un-coated hyphae and the five kinds of microfibers are shown in Fig. 3, and the characteristic peaks are summarized in Table S1.† As can be seen, the hyphae showed no obvious crystalline structure, while the XRD patterns of the coated hyphae agreed well with the corresponding JCPDS file and previous work. For instance, the sharp peaks of ZnO/hypha at 2θ values of 31.7 (100), 34.4 (002), 36.3 (101), 47.6 (102), 56.5 (110), 62.7 (103), 68.0 (112) and 68.9 (201) were consistent with the hexagonal phase wurtzite ZnO (JCPDS no. 89-0511), which confirmed the presence of ZnO in the microfibers.13
In the FT-IR spectra in Fig. 2b, the prepared hyphae exhibited typical infrared absorbance of OH groups and absorbed water (3271 and 1636 cm−1), CH groups (2926 cm−1), polypeptide bonds (amide I at 1635 and amide II at 1540 cm−1), and polysaccharide groups (1026 cm−1). The broad plateau between 1500 and 1200 cm−1 composed of several overlapping bands was considered as typical absorbance of fungal agents.14 After being coated with PANI, the mentioned groups still exhibited obvious adsorption peaks with a slight shift. The peaks at 1584, 1497 and 1312 cm−1 in the spectra of PANI/hypha could be assigned to the C![[double bond, length as m-dash]](https://www.rsc.org/images/entities/char_e001.gif) N (quinonoid ring stretching) groups, C
N (quinonoid ring stretching) groups, C![[double bond, length as m-dash]](https://www.rsc.org/images/entities/char_e001.gif) C (aromatic ring stretching) groups and C–H stretching in PANI, respectively.15 Furthermore, a newly appeared peak at 830 cm−1 should correspond to the NH groups in the intermolecular H-bonds, which proved the strong interaction between PANI and the polysaccharide groups on the hyphal surface.16,17 The analysis of other microfibers is shown in Table S1.†
C (aromatic ring stretching) groups and C–H stretching in PANI, respectively.15 Furthermore, a newly appeared peak at 830 cm−1 should correspond to the NH groups in the intermolecular H-bonds, which proved the strong interaction between PANI and the polysaccharide groups on the hyphal surface.16,17 The analysis of other microfibers is shown in Table S1.†
3.2. Synthesis mechanism of the microfibers
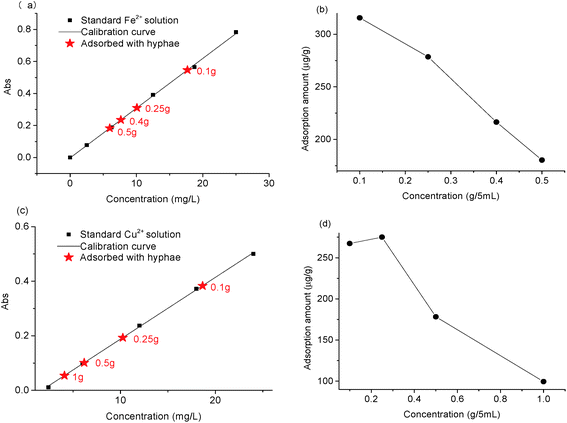
As reported, the cell wall of Penicillium mainly consists of chitin, β-glucans, and chitosan with large amounts of protein and lipid residues.18,19 With the help of the functional groups, including carboxyl, hydroxyl and amino, the surface layer of the cell wall would be possible to bind cations through coordination and electrostatic interactions.20,21 To validate this assumption, an adsorption experiment of Fe2+ and Cu2+ was designed (see details in the ESI†) as examples. As shown in Fig. 4, the residual concentration of metal cations decreased obviously after the standard Fe2+ solution (5 mL, 25 mg L−1) or Cu2+ solution (5 mL, 24 mg L−1) was mixed with different amounts of hyphae and hold for 20 min.This decrease provided strong evidence for the binding of cations on the hyphal surface. The relative adsorption amount of Fe2+ and Cu2+ was up to 315.6 and 267.3 μg g−1, respectively, when 0.1 g of hyphae was used. Furthermore, the relative adsorption amount of the cations generally exhibited a downward trend with the increase of the hypha amount as shown in Fig. 4b and d.
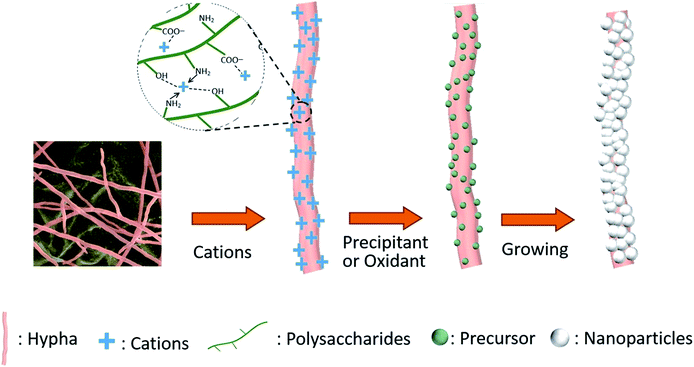
Based on these analyses, the formation mechanism of the coaxial microfibers was proposed as shown in Scheme 1. When the P. expansum hyphae were dispersed in aqueous solution containing cations, the cations would be attached on the hyphal surface through coordination and electrostatic interactions and hydrogen bonding. With the introduction of appropriate precipitation reagents or oxidants, the attached cations would transform to certain precursors, which could be considered as the growth units. These units gradually grew during the aging or growth process, and finally formed a full shell composed of nanoparticles or nanorods outside the hypha. For instance, when the hyphae were dispersed in Zn(CH3COO)2 aqueous solution, the Zn2+ would bind on the hyphal surface through coordination and electrostatic interactions. With the introduction of TEA, the attached Zn2+ transformed to nanoparticles of [Zn(OH)2TEA]n. These nanoparticles gradually grew and decomposed to ZnO particles during the aging process at 90 °C, and formed a ZnO shell outside the hyphae finally.
3.3. Sensing performance of the sensors based on the prepared microfibers
To verify the feasibility of fabricating microsensors using the hypha templated microfibers, microsensors based on PANI/hypha, PPy/hypha and ZnO/hypha microfibers were prepared, and tested with TMA as the model gas.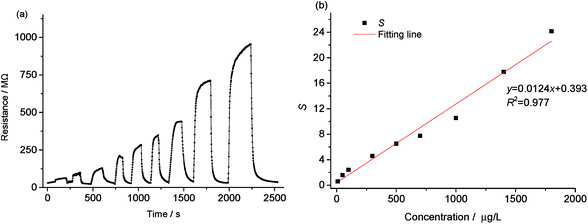 | ||
| Fig. 5 Response transients (a) and sensitivity (b) of the prepared sensor exposed to trimethylamine (TMA) of different concentrations at 25 °C. | ||
Fig. 5b depicts the dependences of the sensor response (S) on the TMA concentration. The sensor response showed a good linear relationship with the TMA concentration, and the regression equation was y = 0.0124x + 0.393 (R2 = 0.977).
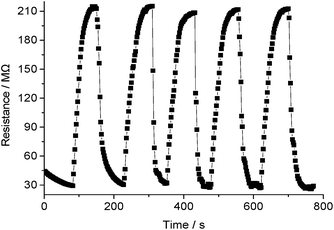
The reproducibility and stability of a sensor affect its reliability significantly. The reproducibility of the PANI/NiTSPc thin film sensor was measured by repeating the response measurement. Fig. 6 depicts the dynamic response transients of the sensor toward TMA of 500 μg L−1 over 5 measurements. The results showed that the response of the material was almost constant with a relative standard deviation of 7.2%, which confirmed the reproducibility of the sensor material. Furthermore, the average response (S) of the PANI/NiTSPc thin film sensor over 3 measurements remained at 93.46% of the initial response after 30 days (see Fig. S4†), which indicated an acceptable long-term stability.
4. Conclusions
Hyphae of Penicillium were demonstrated to be a versatile template for the fabrication of core/shell coaxial microfibers without any surface modification. Five kinds of nanomaterials, including ZnO, Fe3O4, Cu(OH)2, PPy and PANI, were coated on the hyphal surface conveniently. The SEM images, and EDS, XRD and FT-IR spectra revealed that the formed nanomaterials were attached firmly on the hyphal surface and partially connected with each other to form a whole shell. An adsorption experiment showed that cations could be attached on the hyphal surface with the help of related functional groups, including carboxyl, hydroxyl and amino, through coordination and electrostatic interactions, and hydrogen bonding. Such attachment explained well the formation mechanism of the coaxial structure. To show the applicability of the prepared coaxial microfibers, microsensors based on PANI/hypha, PPy/hypha and ZnO/hypha microfibers were fabricated, and tested with TMA as the model gas. The prepared sensors showed a good linear response toward TMA with an R2 higher than 0.977, a relative standard deviation for reproducibility measurement lower than 7.2%, and a fast response–recovery speed.Conflicts of interest
There are no conflicts to declare.Acknowledgements
The authors gratefully acknowledge the financial support provided by the National Science and Technology Support program (2015BAD17B04, 2015BAD19B03), the National Natural Science Foundation of China (61301239, 31601543), the Natural Science Foundation of Jiangsu Province (BK20130505, BK20160506), China Postdoctoral Science Foundation (2013M540422, 2014T70483, 2016M590422, 2017T100334), the Jiangsu Province Science Fund for Distinguished Young Scholars (BK20130010), the Suzhou Science and Technology project (SNG201503), and the Priority Academic Program Development of Jiangsu Higher Education Institutions (PAPD).References
- Y. S. Zhao, H. Fu, A. Peng, Y. Ma, D. Xiao and J. Yao, Adv. Mater., 2008, 20, 2859–2876 CrossRef CAS.
- J. A. Barreto, W. O'Malley, M. Kubeil, B. Graham, H. Stephan and L. Spiccia, Adv. Mater., 2011, 23, H18–H40 CrossRef CAS PubMed.
- S. A. Ibrahim, N. A. Rahman, M. H. Abu Bakar, S. H. Girei, M. H. Yaacob, H. Ahmad and M. A. Mahdi, Opt. Express, 2015, 23, 2837–2845 CrossRef CAS PubMed.
- K. Kim, X. Xu, J. Guo and D. L. Fan, Nat. Commun., 2014, 5, 3632–3640 Search PubMed.
- M. Peng and D. Zou, J. Mater. Chem. A, 2015, 3, 20435–20458 CAS.
- Y. Wang, A. S. Angelatos and F. Caruso, Chem. Mater., 2007, 20, 848–858 CrossRef.
- Y. Tan, J. Gu, X. Zang, W. Xu, K. Shi, L. Xu and D. Zhang, Angew. Chem., 2011, 123, 8457–8461 CrossRef.
- S.-W. Lee and A. M. Belcher, Nano Lett., 2004, 4, 387–390 CrossRef CAS.
- D. Moore, G. D. Robson and A. P. J. Trinci, 21st Century Guidebook to Fungi with CD-ROM, Cambridge University Press, 2011 Search PubMed.
- H.-u. Lee, J. B. Park, H. Lee, K.-S. Chae, D.-M. Han and K.-Y. Jahng, J. Microbiol., 2010, 48, 243–248 CrossRef CAS PubMed.
- L. Zhihua, Z. Xucheng, S. Jiyong, Z. Xiaobo, H. Xiaowei, H. E. Tahir and M. Holmes, Sens. Actuators, B, 2016, 226, 553–562 CrossRef.
- G. D. Khuspe, D. K. Bandgar, S. Sen and V. B. Patil, Synth. Met., 2012, 162, 1822–1827 CrossRef CAS.
- R. Yi, N. Zhang, H. Zhou, R. Shi, G. Qiu and X. Liu, Mater. Sci. Eng. B, 2008, 153, 25–30 CrossRef CAS.
- M. Zotti, A. Ferroni and P. Calvini, Int. Biodeterior. Biodegrad., 2011, 65, 569–578 CrossRef CAS.
- Y. Yu, B. Che, Z. Si, L. Li, W. Chen and G. Xue, Synth. Met., 2005, 150, 271–277 CrossRef CAS.
- M.-P. Gaigeot, N. Leulliot, M. Ghomi, H. Jobic, C. Coulombeau and O. Bouloussa, Chem. Phys., 2000, 261, 217–237 CrossRef CAS.
- G. I. Dovbeshko, V. I. Chegel, N. Y. Gridina, O. P. Repnytska, Y. M. Shirshov, V. P. Tryndiak, I. M. Todor and G. I. Solyanik, Biopolymers, 2002, 67, 470–486 CrossRef CAS PubMed.
- S. Bartnicki-Garcia, Annu. Rev. Microbiol., 1968, 22, 87–108 CrossRef CAS PubMed.
- F. Ruiz-Duenas and M. Martinez, Curr. Microbiol., 1996, 32, 151–155 CrossRef CAS.
- X. Sun, J. Liu and Y. Li, Chem.–Eur. J., 2006, 12, 2039–2047 CrossRef CAS PubMed.
- X. Wang, Y. Du, L. Fan, H. Liu and Y. Hu, Polym. Bull., 2005, 55, 105–113 CrossRef CAS.
- S. Roy and S. Basu, J. Mater. Sci.: Mater. Electron., 2004, 15, 321–326 CrossRef CAS.
Footnotes |
| † Electronic supplementary information (ESI) available. See DOI: 10.1039/c7ay02318a |
| ‡ These authors contributed equally. |
| This journal is © The Royal Society of Chemistry 2018 |

