Histidine-enriched multifunctional peptide vectors with enhanced cellular uptake and endosomal escape for gene delivery†
Zhao
Meng
a,
Liang
Luan
ab,
Ziyao
Kang
a,
Siliang
Feng
a,
Qingbin
Meng
*a and
Keliang
Liu
*a
aState Key Laboratory of Toxicology and Medical Countermeasures, Beijing Institute of Pharmacology and Toxicology, Beijing, 100850, P. R. China. E-mail: keliangliu55@126.com; nankaimqb@sina.com; Fax: +86-10-68211656; Tel: +86-10-68169363
bClinical Laboratory, General Hospital of Shenyang Military Command, Shenyang, 110000, P. R. China
First published on 11th November 2016
Abstract
Peptide vectors offer a promising gene delivery approach because of their biocompatibility and ease of functionalization. This article describes the design and evaluation of a series of multifunctional peptides and their gene delivery abilities. The peptides were composed of a cell-penetrating segment, stearyl moiety, cationic amphiphilic α-helical segment, and cysteine and histidine residues. The proton sponge effect of histidine residues at low pH and the α-helical conformation should improve endosomal escape. Inclusion of D-type amino acids should improve proteolytic stability. The conformation, particle size and zeta potential of peptide/DNA complexes were characterized by circular dichroism and dynamic light scattering. Gene transfection efficiency was investigated by fluorescence-activated cell sorting and confocal microscopy. Transfection efficiencies of the designed peptide vectors were better than those of C18-C(LLKK)3C-TAT and Lipo2000. D-Type peptide C18-c(llhh)3c-tat showed three times higher transfection efficiency at N/P ratios of 6 and 8 than Lipo2000 in NIH-3T3 and 293T cells. All peptides showed lower cytotoxicity than Lipo2000 in NIH-3T3 and 293T cells. In the presence of trypsin or serum in vitro, D-type peptides showed better stability than L-type peptides. Overall, the designed histidine-enriched multifunctional peptide gene vectors promoted cellular uptake, endosomal escape and gene transfection.
Introduction
As a potentially effective method for treating gene disorders, gene therapy has attracted much attention in recent decades,1,2 with successful trials promoting the application of gene therapy to many fields, including cancer and chronic or progressive diseases.3 For gene therapy to be effective, the gene molecules must enter the cell nucleus. Barriers to nuclear entry, such as the processes of cellular uptake, enzymatic hydrolysis and endosomal escape, have been regarded as the Achilles heel of gene therapy.4 A safe and effective gene delivery vector could solve these problems.There are two kinds of gene delivery vectors, viral and nonviral. Current gene therapy approaches typically use viral vectors mainly because of their high transfection efficiency. Nevertheless, viral vectors have many disadvantages, including toxicity, immunogenicity and scale-up limitations.5 Therefore, nonviral vectors were designed and applied to improve safety. Many nonviral vectors, such as cationic lipids, polymers, peptides and multifunctional envelope-type nanodevices, have been explored and used in gene delivery. However, these vectors suffer from poor efficiency of delivery and transfection.6–8 Peptide vectors derived from viral proteins were developed as potential materials for gene therapy. Peptide vectors have the ability to integrate multiple functions, including cell penetration,9 targeting10 and endosomal escape.11,12
Cell-penetrating peptides (CPPs), highly cationic peptides comprised of multiple arginine and lysine residues, are frequently used vectors that have the ability to translocate into almost any living cell.13–16 CPPs derived from the HIV trans-activator of transcription (TAT) protein with the sequence GRKKRRQRRR17 are capable of binding and translocating various cargoes, such as DNA,18 RNA19 and drugs,20 across the plasma membrane via endocytosis. TAT peptide binds DNA by electrostatic interactions and decreases the size of DNA to allow DNA translocation across cell membranes via the endosomal pathway.21,22 However, CPP-mediated endocytosis usually results in localization of the peptide/DNA complexes in endosomes and eventual lysosomal degradation.21,23,24
Efficiency of gene delivery depends, to some extent, on the efficiency of endosomal escape. Therefore, understanding the mechanisms of cargo escape from endosomes is important for improving this efficiency. Vectors with pH-sensitive groups could provide endosomolytic ability, which would improve the endosomal escape ability.25–27 One feasible way to achieve endosomal escape might be through the proton sponge effect, which refers to the high buffering capacity of agents and their ability to swell when protonated. Protonation causes an extensive inflow of ions and water into endosomes, leading to rupture of the endosomal membrane and release of entrapped components.28 Owing to the imidazole ring of histidine, molecules enriched in this amino acid show a proton sponge effect and can lead to the breakup of the endosomal membrane.29,30 Singh et al. found that molecules conjugated with histidine could improve the efficiency of gene delivery by enhancing endosomal escape.31
Cationic amphiphilic antimicrobial peptides with an α-helical conformation exhibit membrane-disrupting properties that could aid in cell endocytosis and endosomal escape.32 In particular, stearylation could provide a hydrophobic environment to promote interactions with the cell membrane and the formation of an α-helical conformation. When a stearyl moiety is added at the N-terminus of an amphiphilic antimicrobial peptide, the α-helical content increases in aqueous solution.33 Increased number of repeat units with α-helical tendency increases the α-helical folding, as indicated by the extent of the negative values of the molecular ellipticity at minimum circular dichroism (CD) detection.34
Peptide vectors generally have better biocompatibility than other nonviral gene carriers, but they are not stable in vivo due to proteolysis. D-Type peptides are often used to improve stability.35 Functionalization of peptide vectors could be achieved by using any reasonable combination of the different functional peptide fragments described above. In this study, several peptide gene-delivery carriers were designed with the intention of enhancing endosomal escape and gene transfection efficiency. These peptides included a CPP segment, which contained positively charged amino acids that could bind DNA; an endo-lysosomal membrane-disrupting (ELMD) segment, which would provide an α-helical conformation and proton sponge effect; and a stearyl segment (Table 1).
| Compounds | Peptide sequence | Molecular weight | |
|---|---|---|---|
| Calculated | Measured | ||
| P-01 | C18-CLLKKLLKKLLKKCHHHHHHGRKKRRQRRR | 4139.3 | 4140.5 |
| P-02 | C18-cllkkllkkllkkchhhhhhgrkkrrqrrr | 4139.3 | 4140.2 |
| P-03 | C18-CLLHHLLHHLLHHCGRKKRRQRRR | 3370.2 | 3371.7 |
| P-04 | C18-cllhhllhhllhhcgrkkrrqrrr | 3370.2 | 3371.3 |
| P-05 | C18-CLLKKLLKKLLKKCGRKKRRQRRR | 3313.5 | 3317.3 |
| P-06 | C18-CLLKKLLKKLLKKC | 1937.8 | 1939.0 |
The stearyl group was conjugated to the N-terminus of the peptide and offered a hydrophobic environment to promote associations with the cellular membrane. Amphiphilic peptides form self-assembled nanostructures, which increase the cationic charge density and protect cargo from enzymolysis during cell entry and transfection. Stearylated vectors could self-assemble into secondary structures, enhancing DNA delivery into cells.36 (LLHH)3 and (LLKK)3-H6 were designed as ELMD segments. Repeat units not only help to increase the α-helical folding to disrupt membranes32 but also bind DNA to increase the efficiency of gene delivery. To increase endosomal escape through the proton sponge effect, histidine residues were inserted or used to replace lysine resides in (LLKK)3.30 Histidine introduction did not influence the α-helical conformation. The incorporation of cysteine residues into peptides can also increase the α-helical content possibly due to the sequence of the peptide molecule. Moreover, the presence of cysteine residues also increases the potential for intermolecular crosslinking to occur via disulfide bonds in acidic endosomes or lysosomes, and improves the stability of peptide/DNA complexes in the extracellular environment. For example, when cysteine residues were added to link low molecular weight peptides via reducible disulfide bonds, cellular uptake and gene transfection efficiency of these peptides were enhanced.37,38 It has been proved in previous work that the presence of cysteine residues affected the gene delivery performance of the conjugates. The transfection of cysteine-containing peptide C18-C(LLKK)3C-TAT was 6.8 times more efficient than the control peptide C18-G(LLKK)3G-TAT.39D-Type amino acids were used to synthesize the same peptide sequences, to improve stability of the vectors in the physiological environment.
It was hypothesized that peptides containing the above functional segments could improve the efficiency of cellular uptake and endosomal escape, and eventually promote gene delivery and transfection. The results of this study indicated that the designed peptide vectors showed high gene transfection efficiency and low cytotoxicity, as expected.
Experimental
Materials
N-Fluorenyl-9-methoxycarbonyl (Fmoc)-protected L- and D-amino acids were purchased from GL Biochem Ltd and CS Bio Ltd (Shanghai, China). Rink amide resin was purchased from Nankai Hecheng (Tianjin, China). 2-(1H-Benzotriazole-1-yl)-1,1,3,3-tetramethyluroniumhexauorophosphate and hydroxybenzotriazole were purchased from GL Biochem Ltd. Diisopropylethylamine, trifluoroacetic acid (TFA), thioanisole, ethandithiol and anisole were purchased from J & K Scientific (Beijing, China). All other solvents were redistilled from drying reagents. Dulbecco's modified Eagle's medium (DMEM) was purchased from Gibco (Thermo Fisher Scientific). Foetal bovine serum (FBS), penicillin–streptomycin, phosphate-buffered saline (PBS), YOYO-1 (491/501) intercalating dye and Lipo2000 were purchased from Invitrogen (CA, USA). The pGL3 control vector, Dual-Glo® Luciferase Assay System, and CellTiter96® AQueous One Solution Cell Proliferation Assay kit were purchased from Promega (WI, USA). The Bradford protein assay kit was purchased from Beijing Solarbio Science & Technology Co. Ltd. (Beijing, China).Peptide synthesis and purification
All peptides were synthesized by solid-phase synthesis using Fmoc chemistry on an automatic Liberty-12-Channel Automated Peptide Synthesizer with an integrated microwave system (CEM, USA). Rink amide resin (0.44 mmol g−1) was used as a solid phase to obtain C-terminally amidated peptides. A 20% solution of piperidine in N,N-dimethylformamide (v/v) was added to the resin for deprotection. Amino acids were coupled to rink amide resin one by one, followed by N-terminal conjugation of stearic acid. The final cleavage was performed using 10 mL of TFA (90%)/thioanisole (5%)/ethandithiol (3%)/anisole (2%) for 3 h at room temperature. Peptides were purified by reversed-phase high-performance liquid chromatography (HPLC) using a C8 column (Waters, USA) and a gradient of acetonitrile and deionized (DI) water containing 0.1% (v/v) TFA. Molecular weights (MWs) of peptides were analysed by matrix-assisted laser desorption/ionization time-of-flight mass spectrometry (MALDI-TOF-MS; BrukerReex, BrukerDaltonics, Inc., CA, USA).CD measurements
Peptide solutions of 50 μmol L−1 were prepared in 50% trifluoroethanol/PBS (v/v) solution to imitate the cell membrane environment. CD experiments were recorded using a Biologic MOS-450 (Claix, France) at room temperature. Experimental conditions were as follows: speed of 50 nm min−1, time response of 2 s, resolution of 0.5 nm, bandwidth of 4.0 nm, and path cell of 1.0 mm. All spectra were converted to a uniform scale after background subtraction. The reported curves were smoothed using standard parameters.Preparation of vector/DNA complexes
Peptide vector/DNA complexes were prepared at various charge ratios (N/P) ranging from 2 to 8 by mixing 1.0 μg of pGL3 control DNA with the corresponding amount of peptide solution in 50 μL of PBS. The mixtures were vortexed for 10 s, incubated at 37 °C for 30 min to form complexes and diluted to 500 μL with serum-free DMEM. As a positive control, Lipo2000/DNA complexes were prepared. Briefly, 1.0 μg of pGL3 control DNA (in 100 μL PBS) was mixed with 2.5 μL of Lipo2000 (1.0 mg mL−1). The mixture was vortexed for 10 s, incubated at 37 °C for 30 min and diluted to 500 μL with serum-free DMEM. As a negative control, 500 μL of serum-free DMEM containing 1.0 μg of pGL3 control DNA were used.Agarose gel electrophoresis assay
Peptide/DNA complexes at N/P ratios ranging from 0 to 3.5 were prepared using 0.1 μg of pGL3 DNA in the peptide solutions. Complexes were diluted to 10 μL with PBS and loaded on a 1% (w/v) agarose gel with tris-acetate-ethylenediaminetetraacetic acid buffer. Electrophoresis was performed at 100 V for 45 min. The gels were stained with 300 μL of ethidium bromide solution (1.0 μg mL−1) for 30 min. Stained DNA was imaged under an ultraviolet lamp using a ChampGel 6000 system (Beijing Sage Creation Science and Technology Co., Ltd, Beijing, China).Dynamic light scattering (DLS) and zeta (ζ) potential measurements
The particle size and zeta potential were measured by DLS at 25 °C by using a Zetasizer Nano ZS90 (Malvern, UK) with a fixed scattering angle of 90°. Peptide/DNA complexes were prepared at N/P ratios of 2 to 8 using 2.0 μg of pGL3 in the corresponding amount of peptide solution. After incubation at 37 °C for 30 min, the peptide/DNA complexes were diluted to 1.0 mL with DI water.Transmission electron microscopy (TEM)
Morphologies of peptide/DNA complexes at different N/P ratios were observed by TEM (Hitachi H-7650, Tokyo, Japan). Complexes were prepared as described above by adding 1.0 μg of pGL3 into the appropriate peptide solution. Mixtures of complexes were diluted to 500 μL with DI water. After incubation for 30 min, peptide/DNA complex solutions were added dropwise onto copper meshes with a volume of about 10 μL per sample. The samples were air dried and examined.Cell culture
NIH-3T3 and 293T cells were grown at 37 °C, 5% CO2 in DMEM with 10% FBS and 1% penicillin–streptomycin (10![[thin space (1/6-em)]](https://www.rsc.org/images/entities/char_2009.gif) 000 U mL−1).
000 U mL−1).
Cytotoxicity assay
Cytotoxicity of peptide/DNA complexes was evaluated in 293T or NIH-3T3 cells by using a CCK-8 kit (Dojindo). Briefly, 1 × 10⁵ cells per mL were seeded into a 96-well plate (Greiner Bio One, Germany) with 100 μL per well. Peptide/DNA complexes were prepared at N/P ratios of 2 to 8 by adding 0.2 μg of DNA into the corresponding peptide solution. The mixture in each well was diluted to 100 μL with FBS-free DMEM. The medium was removed after 24 h, and cells were treated with peptide/DNA complexes at various ratios. The medium was removed after 4 h, and 100 μL of DMEM containing 10% FBS were added to each well. After incubation for 20 h at 37 °C in a 5% CO2 atmosphere, 10 μL of CCK-8 reagent were added to each well. After incubation at 37 °C for 2 h, absorbance values were measured at 450 nm using a SpectraMax® M5 (Molecular Devices, WI, USA). Cells without complexes were used as a negative control. Lipo2000/DNA complexes (prepared as above) were used as a positive control. The experiment was repeated five times for each sample.In vitro transfection
Transfection efficiencies of peptide/DNA complexes were evaluated by the reporter gene method in NIH-3T3 or 293T cells. Cells were seeded into a 24-well plate at about 1 × 10⁵ cells per well in 500 μL of DMEM containing 10% FBS. The medium was removed after 24 h, and cells were cultured with peptide/DNA complexes at various N/P ratios. After 4 h, the medium was replaced with fresh DMEM containing 10% FBS. Cells were incubated for about 44 h before testing. The Lipo2000/DNA complex was used as a positive control.For luciferase assays, the medium was removed, cells were washed three times with PBS, and 100 μL of a cell culture lysis reagent (Promega) were added to each well. The plates were incubated for 15 min at room temperature. The luciferase activity was measured using a luciferase assay kit (Promega) and normalized to the total protein content of each cell lysate, as determined by a Bradford protein assay. Relative light units were read by using a SpectraMax® M5 (Molecular Devices) with a 500 ms read time. For the endocytosis inhibition study, the same steps were used as for luciferase research, except that cells were pre-treated with inhibitors: chlorpromazine hydrochloride (CPZ, 10 μg mL−1), amiloride (50 μM) and methyl-beta-cyclodextrin (MβCD, 5 mM).
Fluorescence-activated cell sorter (FACS) analysis
NIH-3T3 cells were seeded in 6-well plates (2 × 10⁵ cells per well) 24 h before experiments. The pGL3 control plasmid (1.0 μg) was incubated with 2.5 μL of YOYO-1 (10 μM) for 30 min at 37 °C for labelling. Peptide/DNA complexes were added to each well and incubated for 4 h. The medium was removed, and each well was washed thrice with PBS containing 2 mg mL−1 heparin sodium. Cells were treated with 0.25% (w/v) trypsin and 0.02% (w/v) EDTA solution at 200 μL per well until about 80% of cells detached from the plates. Then, 800 μL of DMEM containing 10% FBS were added to each well. The samples were collected into 1.5 mL centrifuge tubes and centrifuged for 5 min, followed by supernatant removal. Immediately before fluorescence analysis, cells were equally distributed into 250 μL of PBS. A minimum of 15![[thin space (1/6-em)]](https://www.rsc.org/images/entities/char_2009.gif) 000 events/sample were analysed by FACS (Becton Dickinson, NJ, USA) at an excitation/emission ratio of 488 nm/530 nm.
000 events/sample were analysed by FACS (Becton Dickinson, NJ, USA) at an excitation/emission ratio of 488 nm/530 nm.
Confocal laser-scanning microscopy (CLSM)
The 293T and NIH-3T3 cells were seeded into 15 mm glass-bottom culture dishes (NEST) with about 3 × 10⁴ cells per well and incubated for 24 h. YOYO-1-labelled DNA/peptide complexes were prepared as described. The medium was removed, and complexes were added and incubated for 4 h. The dishes were washed thrice with PBS, cells were fixed with 4% formaldehyde/PBS solution for 10 min, and then the dishes were washed twice again with PBS, and cell nuclei were stained with DAPI (2.0 μg mL−1, Roche, Switzerland). The dishes were washed again as described. Cells were examined using a Carl Zeiss LSM 510 meta fluorescence microscope (Jena, Germany) with long focal length optics and excitation by He–Ne (543 nm) and argon ion (488 nm) lasers. For live-cell imaging experiments, after incubation of 4 h and washing with PBS, LysoTracker Red (50 nM) was added to the dishes and incubated for 30 min. The dishes were then washed thrice again with PBS, followed by incubation with HOECHST 33258 (1 μg mL−1) for 20 min to stain the nuclei. The dishes were washed again as described. Cells were examined using an Ultra VIEW VoX live-cell imaging system (Perkin Elmer, US) equipped with a modular laser system using a solid-state laser technology.Enzyme stability
Peptides were dissolved in 0.1 mol L−1 NH4HCO3 and diluted to 0.5 mg mL−1. Trypsin solution was prepared by dissolving 2.0 mg of trypsin in 250 mL of 0.1 mol L−1 NH4HCO3. Next, 910 μL of peptide solution were mixed with 90 μL of trypsin solution and incubated at 37 °C. After 0, 5, 15, 30, 60 and 120 min, three 120 μL aliquots were sampled and analysed by HPLC. A peptide solution without trypsin was used as a negative control. The peak area of the peptide on HPLC was recorded as an indicator for calculating the hydrolysis efficiency of the peptide.Serum stability
Peptides were dissolved in PBS and diluted to 1.0 mg mL−1. Female Sprague-Dawley rats (250 ± 20g) were anaesthetized and sacrificed by collecting blood via the abdominal aorta. Blood samples from rats were pooled, homogenized by a Teflon digital homogenizer and centrifuged (10![[thin space (1/6-em)]](https://www.rsc.org/images/entities/char_2009.gif) 000g) for 20 min at 4 °C. The supernatant was diluted five times for stability experiments. The precipitator was prepared by mixing 1.0 mL of TFA and 9.0 mL of acetonitrile. When tested, 500 μL of peptide solution were mixed with 500 μL of serum solution. The reaction was initiated by heating at 37 °C in a water bath. After 0, 5, 15, 30, 60, and 120 min, 120 μL of mixture were withdrawn, and 120 μL of precipitator were added to the samples. The solution was vortexed for 5 s and centrifuged (10
000g) for 20 min at 4 °C. The supernatant was diluted five times for stability experiments. The precipitator was prepared by mixing 1.0 mL of TFA and 9.0 mL of acetonitrile. When tested, 500 μL of peptide solution were mixed with 500 μL of serum solution. The reaction was initiated by heating at 37 °C in a water bath. After 0, 5, 15, 30, 60, and 120 min, 120 μL of mixture were withdrawn, and 120 μL of precipitator were added to the samples. The solution was vortexed for 5 s and centrifuged (10![[thin space (1/6-em)]](https://www.rsc.org/images/entities/char_2009.gif) 000g) for 10 min at 4 °C. Supernatants were analysed by HPLC, with the peak area of the peptide being recorded as an indicator for calculating the hydrolysis efficiency of the peptide.
000g) for 10 min at 4 °C. Supernatants were analysed by HPLC, with the peak area of the peptide being recorded as an indicator for calculating the hydrolysis efficiency of the peptide.
Results and discussion
Design, synthesis and characterization of peptides
The designed peptides contained many functional segments, including a CPP segment (TAT), ELMD segment ((LLKK)3, (LLHH)3 or (LLKK)3-H6) and stearyl segment. The cationic TAT segment was capable of binding DNA and penetrating the cell membrane. The stearyl group offered an α-helical tendency and hydrophobicity for interaction with membranes and molecule self-assembly. The ELMD segment could aid in endosomal escape.40 Vectors were designed so that each functional fragment would play a synergistic role to achieve a relatively high gene transfection efficiency. CPPs could condense negatively charged nucleic acids into nanoparticles due to their positive charges.41L-Peptides P-01, P-03, P-05, P-06 and D-peptides P-02 and P-04 were synthesized by solid-phase synthesis using Fmoc chemistry (sequences in Table 1). Among them, P-01 and P-02 were peptides with histidine added, while P-03 and P-04 were peptides with histidine replaced. P-05 and P-06 were the peptides reported by our group previously,39 which are presented here for comparison. D-Peptides (P-02 and P-04) were prepared to increase the stability of peptides in the physiological environment. All peptides were purified and analysed by HPLC (purity ≥95%). (Fig. S1, ESI†) MWs of the peptides were confirmed by MALDI-TOF-MS (Fig. S2, ESI†).CD spectra
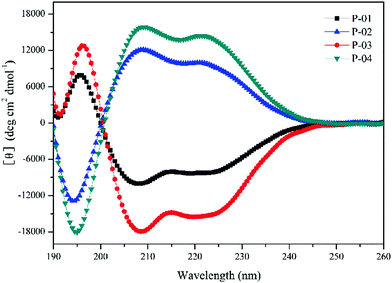
The α-helical conformation has the potential to disrupt endosomal membranes and promote the endosomal escape efficiency of peptide/DNA complexes.42 Thus, the ability of peptides to form an α-helical conformation needs to be examined. CD spectra were measured in a 50% trifluoroethanol/PBS (v/v) solution to imitate the membrane environment. The spectra revealed a minimal absorbance at 208 nm and a pronounced shoulder at 220 nm (Fig. 1), which are typical characteristics of α-helices. Peptides with addition or replacement of histidine residues assembled into similar α-helical conformations compared to the original peptide P-05 without histidine addition or replacement (data not shown).39 The conformation of D-peptides was opposite to that of L-peptides, which is a normal phenomenon for different conformations of amino acids.43 The amphiphilic α-helical conformation was consistent with the observation that peptide/DNA complexes were able to bind DNA and achieve gene transfection.Agarose gel electrophoresis assays
To test the DNA-binding ability of peptides, agarose gel electrophoresis was performed. D- and L-peptides showed different abilities to bind DNA (Fig. 2). L-Peptides, regardless of whether histidine residues were added (P-01) or replaced (P-03), exhibited the same DNA-binding capacity and retarded DNA migration at an N/P ratio of 2.5. D-Peptides displayed different capacities to bind DNA. Histidine replaced peptides (P-04) showed a higher DNA-binding ability than histidine added peptides (P-02). D-Peptides retarded DNA migration at N/P ratios of 2.5 and 3.0, respectively. Thus, histidine replacement did not influence the DNA-binding ability of peptides, and P-04 and P-03 could bind to DNA and form stable complexes at N/P ratios more than 2.5.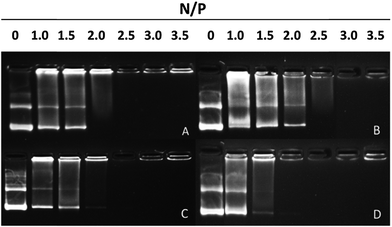 | ||
| Fig. 2 Agarose gel electrophoresis assay of (A) P-01, (B) P-02, (C) P-03 and (D) P-04 at different N/P ratios. | ||
Particle size and zeta potential
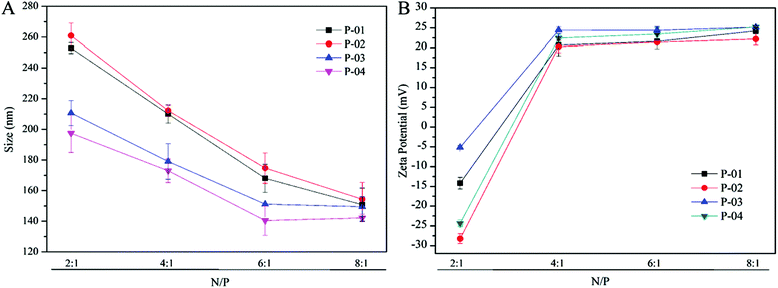
The particle size and zeta potential characteristics of peptide/DNA complexes are important for gene delivery, in terms of influencing cellular uptake, nuclear entry and transfection efficiency.42 The particle sizes of peptide/DNA complexes decreased as the N/P ratio increased up to 6 (Fig. 3A). When the N/P ratio increased from 6 to 8, the sizes of P-01 and P-02 decreased, whereas the sizes of P-03 and P-04 only changed slightly. P-04 at an N/P ratio of 6 was the smallest of the peptides (diameter: 149 nm). These results indicate that most of the peptides could combine and condense DNA when the N/P ratio exceeded 4. This finding is consistent with the results of the agarose gel electrophoresis assay.Positive charges on the surfaces of peptide/DNA complexes affect endocytosis into the cytoplasm and gene transfection efficiency.42 As shown in Fig. 3B, the positive charges of the complex surfaces increased to a constant level as the N/P ratio increased to 4, and then changed slightly when the N/P ratio increased beyond 6. When the ratio was 6, peptides condensed DNA and formed smaller and tighter self-assemblies that could shield most of the positive charges from the redundant peptides. This explanation agrees well with the particle size results. When the N/P ratio increased to 8, the particle sizes of the complexes changed slightly, but the zeta potentials were unchanged.
Morphology
Peptide/DNA complexes at an N/P ratio of 6 were observed by TEM (Fig. 4). The complexes showed a spherical shape. The average size of complexes measured by TEM (30–80 nm) was smaller than the size measured by DLS due to differences in testing conditions. There were two main reasons for the big difference in the particle size between the DLS and TEM results. One was that TEM is performed under dry conditions, whereas DLS is performed in liquid conditions and the DLS size refers to the hydrodynamic diameter. Similar results have been encountered in our previous studies.44 The other reason was that the aggregation of assemblies possibly occurred in aqueous phase. All of the peptide/DNA complexes formed spherical nanoparticles via self-assembly, and the size of these peptides measured by TEM did not show any significant difference.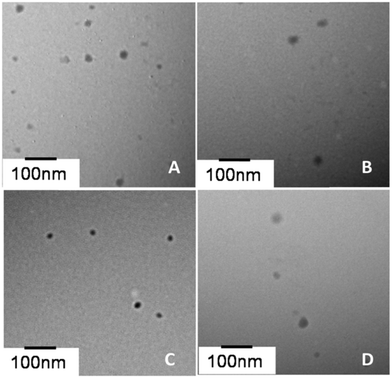 | ||
| Fig. 4 TEM photographs of peptide/DNA complexes at an N/P ratio of 6. (A) P-01, (B) P-02, (C) P-03 and (D) P-04. | ||
Transfection efficiency
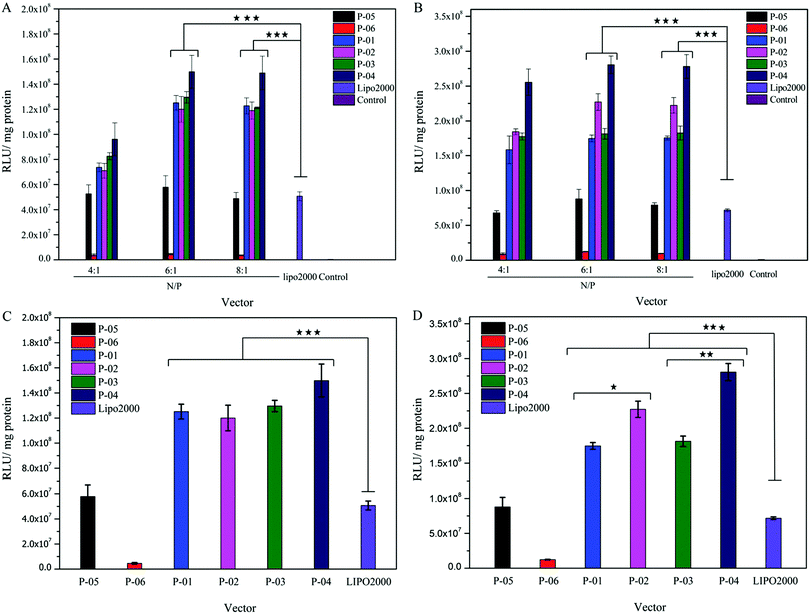
Gene delivery efficiency is influenced by many factors, such as cell-membrane penetration, cellular uptake and endosomal escape. In this study, luciferase assay, FACS and CLSM were used to evaluate the role of vector peptides in DNA delivery. All of the peptide vectors were utilized to deliver the luciferase reporter gene in 293T and NIH-3T3 cells at different N/P ratios. The transfection efficiency of these peptides was compared to the efficiency of Lipo2000 (positive control) and naked plasmid (negative control). Transfection efficiencies were higher in 293T than in 3T3 cells for all peptides due to the difference in species, consistent with previous reports.39 For peptides P-01 to P-04, peptide/DNA complexes had higher transfection efficiencies than the Lipo2000 group in both cell lines (Fig. 5). As a comparison, peptide P-05 showed a similar transfection efficiency to Lipo2000, which agreed well with the results reported.39 Therefore, the designed peptides efficiently delivered reporter genes into cells and successfully achieved transfection.As shown in the Fig. 5, the transfection efficiency trend of all peptide vectors in NIH-3T3 and 293T cells shows dose-dependence in the N/P ratio range of 4–6. When the N/P ratio changed from 4 to 6, the transfection efficiency of all peptide vectors increased, and the transfect efficiency remained almost unchanged when the N/P changed from 6 to 8. It could be explained that the peptide vectors and DNA did not form optimal self-assemblies at an N/P ratio of 4 (see the particle size data in Fig. 3A), although the two components combined completely from the point of view of electrophoresis and potential (Fig. 2 and 3B). When the N/P ratio reached 6, the combination between peptide vectors and DNA was optimal and stable self-assemblies were formed, and the transfection efficiency also achieved the best state. The transfection efficiency of D-peptide P-04 was higher than that of L-peptide P-03 in 293T cells at N/P ratios of 6 and 8 and in NIH-3T3 cells with an N/P ratio of 8 (p < 0.01). Compared with P-01, P-02 only showed higher transfection efficiency in 293T cells at N/P ratios of 6 and 8 (p < 0.05). D-Peptides might prolong the time that complexes stayed in cells.43 One reason was that D-peptides enhanced the stability in lysosomes in the presence of various enzymes. And the other reason might be due to the relatively higher α-helical content of D-peptides than L-peptides, because the α-helical conformation was significant for binding and breaking the membrane of endosomes to help endosomal escape.32 P-04 had the best transfection efficiency in 293T cells at an N/P ratio of 6 and in NIH-3T3 cells at N/P ratios of 6 and 8. Compared with peptide vectors without histidines (P-05),39 peptide vectors P-01, P-02, P-03 and P-04 all showed higher transfection efficiencies. Naked DNA was not substantially delivered into either cell line (blank position in Fig. 5A and B). The peptide with no Tat segment (P-06) showed significantly low gene transfection ability. Transfection efficiency did not vary in an obvious manner with the N/P ratio changing from 6 to 8. This effect was likely because excess peptide had limited contribution to gene delivery and transfection in the context of DNA-binding saturation. Compared to peptide P-02, P-04 showed relatively high transfection efficiencies, especially in 293T cells.
Histidine residues did not affect the α-helix formation (see the CD spectra). Addition of histidine residues might aid in endosomal escape based on the α-helix-mediated membrane disruption and proton sponge effect.45 Among the peptides, P-04 was the most efficient DNA transfection vector; its transfection efficiency was about three-fold higher than that of Lipo2000 and P-05 in both cell lines. As shown in Fig. 5C and D, all histidine-enriched peptides showed obviously higher transfection efficiencies than P-05 and Lipo2000 in both cell lines at an N/P ratio of 6. These results verified that the addition of histidine and use of D-type amino acids could enhance the ability of complexes to deliver genes into cells.
FACS was used to evaluate the cellular uptake of YOYO-1-labelled pGL3 plasmid DNA combined with each peptide. In these experiments, the optimal N/P ratio of 6 was used. All of the vectors similarly delivered YOYO-1-labelled pGL3 plasmid DNA into cells (Fig. 6). The cellular uptake capability for P-06 was relatively lower than that of other peptide vectors due to the lack of the Tat segment which was crucial in the process of cellular uptake. In addition, other peptides P-01–P-05 displayed similar capability of cellular uptake, because they contained the same Tat segment and presented an α-helical conformation which played major roles in the cellular uptake process. Among the peptide vectors, P-01–P-04 showed a slightly better delivery efficiency than P-05 and Lipo2000, especially in NIH-3T3 cells. There were some differences between the results of FACS and the luciferase assay. These differences could be explained by the fact that FACS detects complexes that are delivered into the cytoplasm, whereas the luciferase assay detects genetic expression products. The gene expression was affected by not only cellular uptake but also endosomal escape, so the difference in transfection efficiency is possibly owed to the different endosomal escape capability of the peptide vectors.
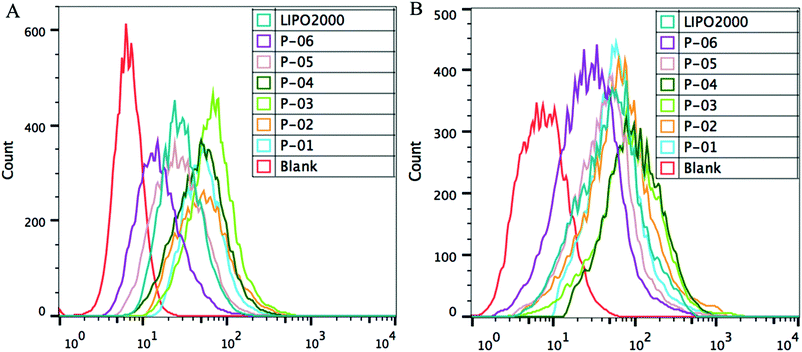 | ||
| Fig. 6 FACS assay of cellular uptake of different peptide/DNA complexes at an N/P ratio of 6 and Lipo2000 in NIH-3T3 cells (A) and 293T cells (B). DNA was labelled with YOYO-1. | ||
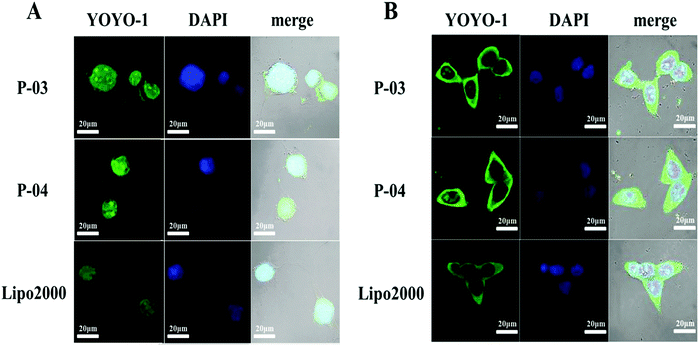
For CLSM observation, YOYO-1-labelled peptide/DNA complexes were incubated with NIH-3T3 and 293T cells for about 4 h. Owing to their better transfection efficiencies among the peptides, P-03 and P-04 were chosen to investigate the cellular uptake of DNA cargo. Both peptide vectors were internalized into treated cells, and some even localized in the nucleus (Fig. 7). P-04 and P-03 displayed a slightly better delivery efficiency than Lipo2000, consistent with the FACS results. The ability of gene delivery carriers to improve cargo entry into the cells is an important characteristic. Histidine-enriched peptides could aid in DNA internalization into the cells and efficient cell transfection.
Cellular uptake pathway
Cellular uptake mechanisms were investigated by using endocytosis-specific inhibitors: CPZ, which inhibits clathrin-mediated endocytosis; MβCD, which inhibits caveolin-mediated endocytosis; and amiloride, which inhibits caveolin-mediated macropinocytosis. Among the inhibitors, MβCD decreased the cellular uptake of the complexes most significantly, although CPZ and amiloride also displayed a little inhibition activity (Fig. 8). These results demonstrate that the peptide/DNA complexes could be internalized by cells in various ways. The relative importance of caveolin-mediated endocytosis might be due to the size of the complexes. Nanoparticles of about 120 nm in diameter are internalized into cells by caveolin-mediated endocytosis,46 particles of 50–70 nm are internalized by clathrin-mediated endocytosis47 and larger particles are internalized by macropinocytosis.48 The average particle size of the complexes detected by DLS was 140–180 nm at an N/P ratio of 6, which possibly aggregated from small particles.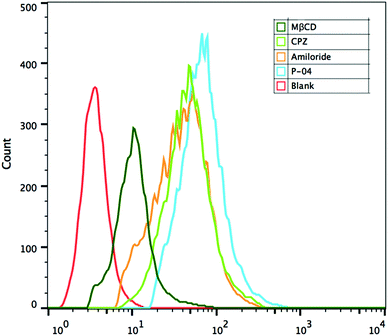 | ||
| Fig. 8 FACS assays of cellular uptake pathways of P-04/DNA complexes at an N/P ratio of 6 in NIH-3T3 cells with endocytosis-specific inhibitors. The pGL3 plasmid was labelled with YOYO-1. | ||
Endosomal escape activity
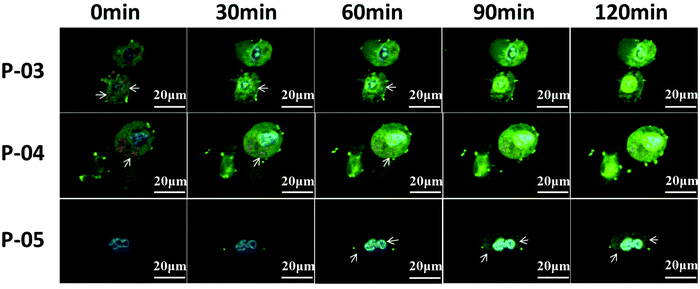
To evaluate the cellular absorbance and endosomal escape of peptide/DNA complexes, CLSM was used. As shown in Fig. 9, NIH-3T3 cells were treated with YOYO-1-labelled DNA/peptide complexes for about 2 h and were observed by CLSM. At the beginning, the green tracker was located together with the red tracker (representing endosomes or lysosomes, which are marked with arrows in the image). Gradually, the green tracker was located in the blue area (representing cell nuclei), which implied that the plasmid DNA has escaped from endosomes and then entered the nucleus. For P-03 and P-04, some complexes were localized in the cytoplasm and a small amount even entered into the nucleus within 1 h. As a comparison, few P-05/DNA complexes were localized in the cytoplasm within 1 h and most of the complexes were located in endosomes or lysosomes. After 2 h, most of the DNA was located in the cytoplasm and a large number of complexes were even internalized in the nucleus for P-03 and P-04, while some P-05/DNA complexes still remained in the endosomes, lysosomes or cytoplasm and only a small part of them were internalized in the nucleus. All of the results prove that histidine-enriched peptides could achieve endosomal escape and translocate plasmid DNA into the cell cytoplasm and nuclei efficiently.Cytotoxicity
A suitable gene vector usually has two advantages: good delivery ability and biocompatibility. To assess the cytotoxicity of peptide/DNA complexes, a CCK-8 kit was used in 293T and NIH-3T3 cells. Lipo2000 and naked plasmid were used as controls. There was no significant cytotoxicity in either cell line for peptide/DNA complexes at relatively low N/P ratios (Fig. 10). When the N/P ratio was more than 6, the complexes showed slight cytotoxicity due to the increased dosage of the vectors with the increasing N/P ratio. Even so, at an N/P ratio of 8, the cytotoxicity of peptide/DNA complexes was lower than that of Lipo2000.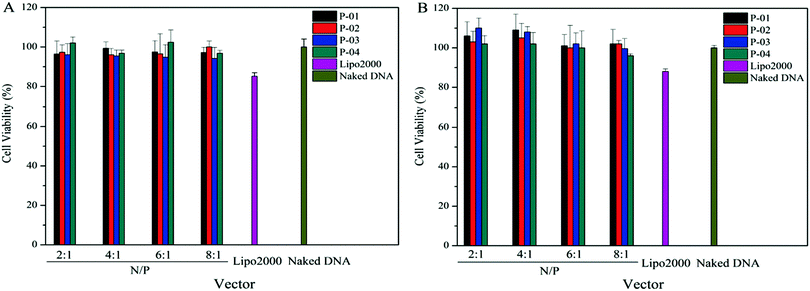 | ||
| Fig. 10 Cell viability of NIH-3T3 cells (A) and 293T cells (B) after treatment with different peptide/DNA complexes at N/Ps of 2 to 8. Data are mean ± SD (n = 5). | ||
Stability
The peptide gene delivery vectors were designed and displayed high transfection efficiency at the cellular level, which was expected to be applied to the body eventually. D-Peptides were designed for their resistance to enzymatic hydrolysis. Therefore, we evaluated the stability of these vectors in plasma. As shown in Fig. 11B, D-form peptide P-04 presented higher stability than L-form P-03 due to the resistance of the D-peptide to enzymatic hydrolysis. In order to investigate whether the D-peptide was more stable than the L-peptide in the presence of a more active enzyme which mainly cleaves at the carboxyl side of positively charged lysine and arginine existing in a certain number in the peptide, the stability of the peptide vector were tested in the presence of trypsin. Trypsin and chymotrypsin are well-known proteases that are omnipresent in vertebrates.49 When incubated with trypsin, the L-peptide degraded completely within 15 min, whereas 20% of the D-peptide remained after 60 min (Fig. 11A). Thus, the D-peptide was more stable than the L-peptide in the presence of trypsin.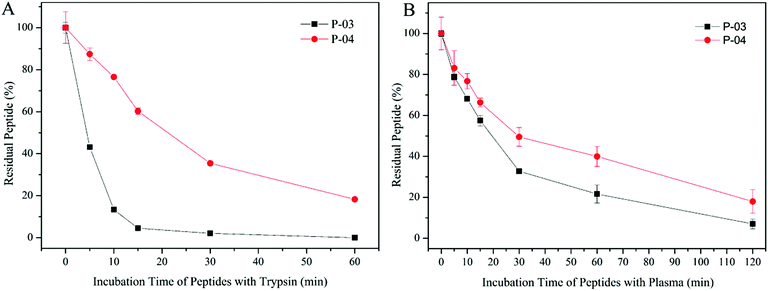 | ||
| Fig. 11 Stability of P-03 and P-04 incubated with trypsin from 0 min to 1 h (A) and incubated with rat plasma from 0 min to 2 h (B). Data are mean ± SD (n = 3). | ||
Conclusion
L- and D-peptides containing various functional segments, including cell-penetration, histidine-enriched endosomal escape, DNA-binding and stearyl group segments were designed and synthesized. Introduction of six histidine residues by addition or replacement of lysine residues in a (LLKK)3 segment improved the efficiency of gene delivery and transfection of the pGL3 plasmid in NIH-3T3 and 293T cells. D-Peptides showed greater stability than L-peptides in either trypsin solution or plasma. When the N/P ratio was 6, the D-peptide P-04 exhibited the highest transfection efficiency, which was about three times that of the positive control (Lipo2000). These findings might facilitate the use of peptide vectors in the treatment of genetic diseases.Acknowledgements
This work was supported by the National Natural Science Foundation of China (81573354, 81202465, and 81373266) and the National Key Technologies R & D Program for New Drugs of China (2012ZX09301003).References
- L. Naldini, Nature, 2015, 526, 351–360 CrossRef CAS PubMed.
- J. R. Kane, J. Miska, J. S. Young, D. Kanojia, J. W. Kim and M. S. Lesniak, Neuro Oncol., 2015, 17, 24–36 CrossRef PubMed.
- K. B. Kaufmann, H. Büning, A. Galy, A. Schambach and M. Grez, EMBO Mol. Med., 2013, 5, 1642–1661 CrossRef CAS PubMed.
- I. M. Verma and N. Somia, Nature, 1997, 389, 239–242 CrossRef CAS PubMed.
- M. A. Mintzer and E. E. Simanek, Chem. Rev., 2009, 109, 259–302 CrossRef CAS PubMed.
- C. Oliveira, I. Silveira, F. Veiga and A. J. Ribeiro, Expert Opin. Drug Delivery, 2015, 12, 27–39 CrossRef CAS PubMed.
- Y. Nakamura, K. Kogure, S. Futaki and H. Harashima, J. Controlled Release, 2007, 119, 360–367 CrossRef CAS PubMed.
- I. S. Zuhorn, J. B. F. N. Engberts and D. Hoekstra, Eur. Biophys. J., 2007, 36, 349–362 CrossRef CAS PubMed.
- D. M. Copolovici, K. Langel, E. Eriste and Ü. Langel, ACS Nano, 2014, 8, 1972–1994 CrossRef CAS PubMed.
- Y. S. Cho, G. Y. Lee, H. K. Sajja, W. Qian, Z. Cao, W. He, P. Karna, X. Chen, H. Mao, Y. A. Wang and L. Yang, Small, 2013, 9, 1964–1973 CrossRef CAS PubMed.
- N. Ferrer-Miralles, E. Vázquez and A. Villaverde, Trends Biotechnol., 2008, 26, 267–275 CrossRef CAS PubMed.
- F. Salomone, F. Cardarelli, M. Di Luca, C. Boccardi, R. Nifosì, G. Bardi, L. Di Bari, M. Serresi and F. Beltram, J. Controlled Release, 2012, 163, 293–303 CrossRef CAS PubMed.
- I. Nakase, H. Akita, K. Kogure, A. Gräslund, Ü. Langel, H. Harashima and S. Futaki, Acc. Chem. Res., 2012, 45, 1132–1139 CrossRef CAS PubMed.
- K. M. Patil, R. J. Naik, Rajpal, M. Fernandes, M. Ganguli and V. A. Kumar, J. Am. Chem. Soc., 2012, 134, 7196–7199 CrossRef CAS PubMed.
- L. Li, J. Ge, H. Wu, Q. H. Xu and S. Q. Yao, J. Am. Chem. Soc., 2012, 134, 12157–12167 CrossRef CAS PubMed.
- E. Ruoslahti, Adv. Mater., 2012, 24, 3747–3756 CrossRef CAS PubMed.
- E. Vivès, P. Brodin and B. Lebleu, J. Biol. Chem., 1997, 272, 16010–16017 CrossRef.
- T. Shiraishi and P. E. Nielsen, Nat. Protoc., 2006, 1, 633–636 CrossRef CAS PubMed.
- J. Hoyer and I. Neundorf, Acc. Chem. Res., 2011, 45, 1048–1056 CrossRef PubMed.
- E. L. Snyder and S. F. Dowdy, Pharm. Res., 2004, 21, 389–393 CrossRef CAS PubMed.
- A. Renigunta, G. Krasteva, P. König, F. Rose, W. Klepetko, F. Grimminger, W. Seeger and J. Hänze, Bioconjugate Chem., 2006, 17, 327–334 CrossRef CAS PubMed.
- V. P. Torchilin, Adv. Drug Delivery Rev., 2008, 60, 548–558 CrossRef CAS PubMed.
- T. I. Kim, T. Rothmund, T. Kissel and S. W. Kim, J. Controlled Release, 2011, 152, 110–119 CrossRef CAS PubMed.
- R. Li, L. Jiang, Q. Meng, J. Gao, H. Li, Q. Tang, M. He, W. Hu, Y. Liu and D. Zhu, Adv. Mater., 2009, 21, 4492–4495 CrossRef CAS.
- H. S. Hwang, J. Hu, K. Na and Y. H. Bae, Biomacromolecules, 2014, 15, 3577–3586 CrossRef CAS PubMed.
- A. J. Convertine, C. Diab, M. Prieve, A. Paschal, A. S. Hoffman, P. H. Johnson and P. S. Stayto, Biomacromolecules, 2010, 11, 2904–2911 CrossRef CAS PubMed.
- W. Gu, Z. Jia, N. P. Truong, I. Prasadam, Y. Xiao and M. J. Monteiro, Biomacromolecules, 2013, 14, 3386–3389 CrossRef CAS PubMed.
- A. K. Varkouhi, M. Scholte, G. Storm and H. J. Haisma, J. Controlled Release, 2011, 151, 220–228 CrossRef CAS PubMed.
- D. W. Pack, D. Putnam and R. Langer, Biotechnol. Bioeng., 1999, 67, 217–223 CrossRef.
- C. Moreira, H. Oliveira, L. R. Pires, S. Simões, M. A. Barbosa and A. P. Pêgo, Acta Biomater., 2009, 5, 2995–3006 CrossRef CAS PubMed.
- R. S. Singh, C. Gonçalves, P. Sandrin, C. Pichon, P. Midoux and A. Chaudhuri, Chem. Biol., 2004, 11, 713–723 CrossRef CAS PubMed.
- N. Ferrer-Miralles, E. Vázquez and A. Villaverde, Trends Biotechnol., 2008, 26, 267–275 CrossRef CAS PubMed.
- Y. C. Yu, M. Tirrell and G. B. Fields, J. Am. Chem. Soc., 1998, 120, 9979–9987 CrossRef CAS.
- J. Hu, C. Chen, S. Zhang, X. Zhao, H. Xu and J. R. Lu, Biomacromolecules, 2011, 12, 3839–3843 CrossRef CAS PubMed.
- J. Li, Y. Gao, Y. Kuang, J. Shi, X. Du, J. Zhou, H. Wang, Z. Yang and B. Xu, J. Am. Chem. Soc., 2013, 135, 9907–9914 CrossRef CAS PubMed.
- Rajpal, A. Mann, R. Khanduri, R. J. Naik and M. Ganguli, J. Controlled Release, 2012, 157, 260–271 CrossRef CAS PubMed.
- J. Yang, H.-Y. Wang, W.-J. Yi, Y.-H. Gong, X. Zhou, R.-X. Zhuo and X.-Z. Zhang, Adv. Healthcare Mater., 2013, 2, 481–489 CrossRef CAS PubMed.
- S. L. Lo and S. Wang, Biomaterials, 2008, 29, 2408–2414 CrossRef CAS PubMed.
- L. Luan, Q. B. Meng, L. Xu, Z. Meng, H. S. Yan and K. L. Liu, J. Mater. Chem. B, 2015, 3, 1068–1078 RSC.
- L. Crombez, M. C. Morris, S. Deshayes, F. Heitz and G. Divita, Curr. Pharm. Des., 2008, 14, 3656–3665 CrossRef CAS PubMed.
- A. Fittipaldi, A. Ferrari, M. Zoppé, C. Arcangeli, V. Pellegrini, F. Beltram and M. Giacca, J. Biol. Chem., 2003, 278, 34141–34149 CrossRef CAS PubMed.
- J. P. Richard, K. Melikov, E. Vives, C. Ramos, B. Verbeure, M. J. Gait, L. V. Chernomordik and B. Lebleu, J. Biol. Chem., 2003, 278, 585–590 CrossRef CAS PubMed.
- C. Ghosh, G. B. Manjunath, P. Akkapeddi, V. Yarlagadda, J. Hoque, D. S. S. M. Uppu, M. M. Konai and J. Haldar, J. Med. Chem., 2014, 57, 1428–1436 CrossRef CAS PubMed.
- Q. Meng, Y. Kou, X. Ma, Y. Liang, L. Guo, C. Ni and K. Liu, Langmuir, 2012, 28, 5017–5022 CrossRef CAS PubMed.
- N. Wiradharma, U. Khoe, C. A. E. Hauser, S. V. Seow, S. Zhang and Y. Y. Yang, Biomaterials, 2011, 32, 2204–2212 CrossRef CAS PubMed.
- J. Wang, K. W. Liu and S. L. Biswal, Anal. Chem., 2014, 86, 10084–10090 CrossRef CAS PubMed.
- C. Yang, L. Chu, Y. Zhang, Y. Shi, J. Liu, Q. Liu, S. Fan, Z. Yang, D. Ding, D. Kong and J. Liu, ACS Appl. Mater. Interfaces, 2015, 7, 2735–2744 CAS.
- I. M. Kaplan, J. S. Wadia and S. F. Dowdy, J. Controlled Release, 2005, 102, 247–253 CrossRef CAS PubMed.
- N. Wiradharma, M. Khan, L. K. Yong, C. A. E. Hauser, S. V. Seow, S. Zhang and Y. Y. Yang, Biomaterials, 2011, 32, 9100–9108 CrossRef CAS PubMed.
Footnote |
| † Electronic supplementary information (ESI) available. See DOI: 10.1039/c6tb02862d |
| This journal is © The Royal Society of Chemistry 2017 |

