
Acidochromic fibrous polymer composites for rapid gas detection†
Maria Erminia
Genovese
*ab,
Elena
Colusso
c,
Massimo
Colombo
 d,
Alessandro
Martucci
c,
Athanassia
Athanassiou
a and
Despina
Fragouli
*a
d,
Alessandro
Martucci
c,
Athanassia
Athanassiou
a and
Despina
Fragouli
*a
aSmart Materials, Istituto Italiano di Tecnologia, via Morego 30, 16163 Genova, Italy. E-mail: maria.genovese@iit.it; despina.fragouli@iit.it
bDIBRIS Department, University of Genova, Viale Causa 13, 16145, Genova, Italy
cDepartment of Industrial Engineering, University of Padova, via Marzolo 9, 35131, Padova, Italy
dDepartment of Nanochemistry, Istituto Italiano di Tecnologia, via Morego 30, 16163, Genova, Italy
First published on 1st December 2016
Abstract
The fabrication of spiropyran-doped poly(vinylidene fluoride-co-hexafluoropropylene) electrospun fibers and the investigation of their optochemosensing properties when exposed to organic acid vapors are reported. The system is first activated through the conversion of the spiropyran molecules dispersed within the polymer to their fluorescent merocyanine photoisomers upon UV irradiation. The latter undergo protonation in the presence of acid vapors, giving rise to an evident colorimetric transition of the composite from purple to yellow and to a concurrent quenching in the spectral emission. Upon gas depletion under ambient conditions, the reversible interactions with the acid molecules lead to a spontaneous recovery of the free merocyanine form and, thus, of the initial materials' color and emission signal. Consistent with their higher surface to volume ratio, the nanofibrous mats exhibit a reduction in the response and recovery times by 25% and by more than 90% compared to composite fibers and films of the same material. The efficient vapor permeation/desorption confers a fast optical detection, which is linear with the acid concentration, and an outstanding reusability for over 40 protonation/recovery cycles. Therefore, the photoswitchable acidochromism of spiropyrans combined with the high specific surface area of the nanofibrous polymeric support provides a photoactivated fast optical and visual acid recognition suitable for integration within portable and reusable platforms targeting the real-time detection of acidic vapors for industrial and environmental applications.
Introduction
In recent years, an increasing demand has arisen towards the development of efficient acid vapor sensing platforms for numerous applications including monitoring the levels of toxic gaseous acidic pollutants for environmental protection, revealing spoilage and bacterial contamination for food quality assessment and controlling the exposure to chemical hazards in industrial production processes and technologies.1,2 To this end, optical chemosensing materials are especially advantageous compared to current analytical techniques, such as gas chromatography, since they can yield a fast read-out signal that does not require expensive instrumentation and long analysis. On top of that, such systems are not affected by the drawbacks of other common sensing devices such as oxide semiconductors that necessitate high operating temperatures,3,4 and many types of electronic nose technologies that typically offer poor reliability due to physical and chemical interference.5,6Although much progress has been achieved in this research area, real time optical sensing of acidic gaseous species still remains challenging owing to the scarce availability of sensory platforms suitable for the detection, which is mainly confined to acidoresponsive systems in the solution phase. Recently, a few fluorescent solid-state probes have been reported ranging from thin films of organoplatinum complexes deposited on glass7 to solid-supported functionalized rhodamine8 and porphyrin derivatives.9 Unfortunately, such approaches require lengthy synthetic protocols and are further limited by low reproducibility and impractical recovery through vacuum or chemical treatment with a base after vapor exposure. Moreover, although responsive coatings on transparent rigid substrates are ideal for optical measurements, self-standing and flexible materials with a high specific surface area are more desirable for on-line fast detection in portable or miniaturized high-performance devices. As demonstrated by numerous reports,10,11 the development of nanostructured fibrous sensing membranes is emerging as an alternative approach due to their excellent mechanical strength and flexibility combined with their high surface to volume ratio, which allows for faster responses and higher sensitivities by two or three orders of magnitude with respect to conventional films of the same material.12 Although such fibrous nanomaterials can encompass most of the stimuli used in common sensing techniques such as acoustic wave, chemiresistive, photoelectric, electrochemical, optical and amperometric methods, the detection of gaseous analytes has relied mainly on resistive and acoustic wave responses,13,14 whereas only a few optical sensing probes have been developed.15–17 In our previous work, we proposed photochromic poly(dimethylsiloxane) films doped with spiropyrans for the on-demand detection of vapors of both organic and inorganic acids18 as a cost-effective and expedient way to achieve an unbiased real time response, in combination with easy processability, flexibility and reusability. The acid vapor recognition was exerted through the optical changes associated with the reversible interaction of the polar red merocyanine (MC) molecules dispersed in the material, generated by the photoconversion of the apolar spiropyran (SP) upon UV irradiation, with the protons of the acid gas diffusing through the polymer, giving rise to the formation of the yellow protonated merocyanine (MCH) counterpart.19,20 The deprotonation of MCH occurred spontaneously, upon acid evaporation, or by restoring the SP species photochemically by visible light irradiation. Although the response times of the composite films were relatively fast upon exposure to a saturated atmosphere of strong inorganic acid vapors, they became remarkably slower when in contact with vapors of organic acids, requiring several minutes to observe a clear change in the optical signal.
To accelerate the response time and to increase the sensitivity of such types of systems, herein, we propose a novel sensing platform for the detection of organic acid vapors based on polymeric electrospun nanofibrous mats doped with photochromic SPs. Although SPs have been studied extensively in composite films for data recording and storage,21 bio- and chemo-sensing,22 photocontrolled microactuation,23,24 surface adhesion25 and wettability,26 incorporation of these organic dyes into fibrous polymer membranes is emerging as a promising approach for the further implementation of the performances of such photochromic systems coupled with miniaturization. For instance, a reversible photoswitchability at the microsecond timescale and associated photo-induced wettability changes of SP-doped organic nanofibers more than eight times larger with respect to the corresponding films were demonstrated by Di Benedetto et al.27 Similarly, an outstanding contact angle difference by almost 70 degrees was reported by Shuiping et al.28 upon photoconversion of photochromic cellulose nanofibers.
Moreover, the majority of acidoresponsive materials have been proposed for the detection of vapors of very strong acids such as hydrogen chloride,15,29 trifluoroacetic acid30 and nitric acid,5,6 whereas sensing of acetic and formic acid vapors has been scarcely documented and, to the best of our knowledge, no previous studies have investigated the acetic and formic acid gas sensing performances of fibers and nanofibers. To this aim, we fabricate poly(vinylidene fluoride-co-hexafluoropropylene)–spiropyran (PVDF-HFP/SP) fibers and investigate the effect imparted by the surface morphology to the reversible acidochromic response of the material. In this way, we demonstrate that the detection and recovery times upon protonation with vapors of organic acids are significantly lower in the case of nanofibrous mats compared to those obtained for PVDF-HFP/SP fibers with a greater mean diameter and compact films, thus achieving a tunable surface dependent response. The efficient vapor diffusion through the PVDF-HFP/SP nanofibrous networks allows, in fact, a highly sensitive and fast optical sensing as well as a clear colorimetric response at different analyte concentrations. Therefore, the proposed sensing system couples a rapid instrumental optical output with a handy visual detection in situ and provides a switch on function through an easily controlled light stimulus, as well as reusability for over 40 protonation/recovery cycles, and integration at the micro-/nanoscale level. Such features render this material versatile for broad industrial, biotechnological and environmental optochemosensing applications.
Experimental section
Materials
1-(2-Hydroxyethyl)-3,3-dimethylindolino-6′-nitrobenzopyrylospiran (SP) (C20H20N2O4, MW = 352.39 g mol−1) was purchased from TCI. N,N-Dimethylformamide (DMF), acetone, formic acid (95% w/w), acetic acid (99.7% w/w) and poly(vinylidene fluoride-co-hexafluoropropylene) (PVDF-HFP) pellets were purchased from Sigma-Aldrich. All materials were used without further purification.Preparation of the PVDF-HFP/SP films
PVDF-HFP was dissolved in a DMF/acetone mixture (3![[thin space (1/6-em)]](https://www.rsc.org/images/entities/char_2009.gif) :1 v/v) and heated at 70 °C for 2 h under magnetic stirring to obtain a transparent 30% wt solution. After cooling to room temperature, 200 μl of an acetone solution containing 1% wt of SP with respect to the polymer were introduced and the final solution was then cast onto a PTFE Petri dish to allow evaporation of the solvents. The resulting films had an average thickness of 250 ± 40 μm.
:1 v/v) and heated at 70 °C for 2 h under magnetic stirring to obtain a transparent 30% wt solution. After cooling to room temperature, 200 μl of an acetone solution containing 1% wt of SP with respect to the polymer were introduced and the final solution was then cast onto a PTFE Petri dish to allow evaporation of the solvents. The resulting films had an average thickness of 250 ± 40 μm.
Fabrication of PVDF-HFP/SP electrospun fibers
Solutions with polymer concentrations of 20, 22, 25, 27 and 30% wt and 1% wt of SP with respect to the polymer were prepared as described above and loaded in a 3 ml syringe connected to a 21-gauge needle and mounted onto a syringe pump (NE-1000, New Era Pump Systems, Inc). Fibrous mats were then electrospun at 20 °C with a humidity of 45% and collected on an aluminum foil. In particular, fibers with an average diameter of 800 ± 70 nm (d = 800 nm) were obtained from the 30% wt PVDF-HFP solution by applying a voltage of 12 kV, by setting the distance from the needle to the collector to 12 cm and by adjusting the flow rate to 1 ml h−1. PVDF-HFP/SP nanofibers with an average diameter of 250 ± 44 nm (d = 250 nm) were obtained from a 25% wt PVDF-HFP solution by adjusting the electrospinning parameters to 15 kV, 23 cm and 0.2 ml h−1.Morphological characterization
The fiber morphology was determined by scanning electron microscopy (SEM) using a JEOL JSM-6490LA microscope operated in high vacuum with an acceleration voltage of 10 kV on samples sputter coated with a 10 nm-thick Au layer using a Cressington 208HR high resolution sputter coater (Cressington Scientific Instrument Ltd, U.K.). The fibers' mean diameter was calculated through the Image J software as the average of 100 fibers' diameters.Brunauer–Emmett–Teller (BET) measurements
Specific surface area measurements were carried out by nitrogen physisorption at 77 K on Quantachrome equipment, model Autosorb iQ. The specific surface areas were calculated using the multi-point BET (Brunauer–Emmett–Teller) model, considering 11 equally spaced points in the P/P0 range from 0.05 to 0.35, with P and P0 being the nitrogen pressure in the cell and the nitrogen vapor pressure at the temperature of liquid nitrogen (77 K) respectively. Prior to measurements, the samples were degassed for 3 hours at 50 °C under vacuum to eliminate weakly adsorbed species.Irradiation of samples
UV irradiation was performed through a 280 nm UV LED (UVB280-HL18M, Roithner LaserTechnik, Austria) using a power intensity of 1 mW cm−2.Absorption measurements
Absorption spectra were collected in the dark using a UV-visible-NIR spectrophotometer (Cary 6000i-Varian) operated in the spectral range between 300 and 700 nm. The absorption spectra of undoped PVDF-HFP fibrous mats and films were used as references for baseline correction. Absorption measurements were performed for each sample after exposure to UV light for 0–7 minutes to monitor the conversion from SP to MC and at intervals of 5 minutes for 60 minutes to investigate the photostability of the MC species.Emission measurements
Time resolved emission spectra and images of 1% wt SP doped PVDF-HFP films, fibers and nanofibers during and after exposure to acidic vapors of acetic and formic acid were acquired through a Confocal resonant microscope (A1R, Nikon, Japan). In order to collect the emission intensity, each sample (5 mg, containing 0.005 mg of SP) was first placed inside a glass chamber, then, liquid droplets of acetic or formic acid were dispensed and the cell was closed, allowing contact of the materials with the acidic vapors generated from the evaporation of the corresponding acid (ca. 10000 ppm). Excitation at 560 nm with an energy of 2.6 × 10⁻⁴ mJ μm−2 on a spot area of 0.12 μm2 was carried out through the laser unit integrated within the microscope and fluorescence was collected by a 4-PMT 32-channel spectral detector using a 20× objective, a resolution of 512 × 512 pixels and a bi-directional scanning speed of 1 fps operated by using a Galvano scanner. To monitor the kinetics of protonation and deprotonation, high-speed acquisitions were obtained at 4 fps at intervals of 500 ms with a resolution of 128 × 128 pixels and a pixel dwell time of 8 μs.
Gas sensing experiments
Emission measurements at different concentrations of gaseous acetic acid were carried out under ambient conditions (T = 20 °C) using a spectrofluorometer (Jasco FP-6300) operated in the 580–680 nm spectral range, at a scanning rate of 1000 nm min−1 and with a data pitch of 1 nm. The λex was fixed at 520 nm and the excitation and emission bandwidths at 5 and 10 nm respectively. The emission intensity at 623 nm before (I0) and after (I) a 10 minute exposure of PVDF-HFP/SP nanofibers to acetic acid vapors was monitored. Four different concentrations of vapors ranging from 750 to 4500 ppm were generated by means of a bubbler from four respective acetic acid aqueous solutions, as reported in the literature,2 and were then directed to a sealed homemade cell equipped with a quartz window where the sample had been placed at a constant flow of 0.4 l min−1 using N2 as the carrier gas. The gas flux was monitored through a flowmeter (Brooks Instrument division, Emerson electric co, USA). After exposure to each concentration of vapor, N2 was fluxed in the cell for 10 minutes in order to allow desorption of the gas and recovery of free MC.Results and discussion
PVDF-HFP is a fluorinated polymer widely used for organophilic pervaporation, filtration membranes, wound dressing and tissue engineering.31 It was selected as the polymeric matrix since it is easily electrospun into fibers, inert to acids, biocompatible, resistant to UV degradation and it possesses good mechanical stability.32,33 The specific SP was chosen owing to its acidochromic properties, which are enhanced by the hydroxyethyl substituent on the indolic nitrogen, as we previously assessed through computational modeling18 in agreement with other studies reported in the literature.34In order to fabricate electrospun fibers with two significantly different diameters, solutions with various concentrations of PVDF-HFP doped with 1% wt of SP with respect to the polymer were tested. Fibers with an average diameter of 800 ± 70 nm (Fig. 1a and b) and nanofibers with an average diameter of 250 ± 44 nm (Fig. 1c and d) were obtained by using 30% wt and 25% wt PVDF-HFP concentrations respectively, whereas 27% wt electrospinning solutions produced fibers with a broad size distribution and d = 400 nm, while lower concentrations of the polymer, such as 20 and 22% wt, yielded beaded fibers (Fig. S1, Table S1, ESI†). On the other hand, by casting a 30% wt solution on a PTFE substrate, compact homogeneous films with a thickness of 250 ± 40 μm were obtained.
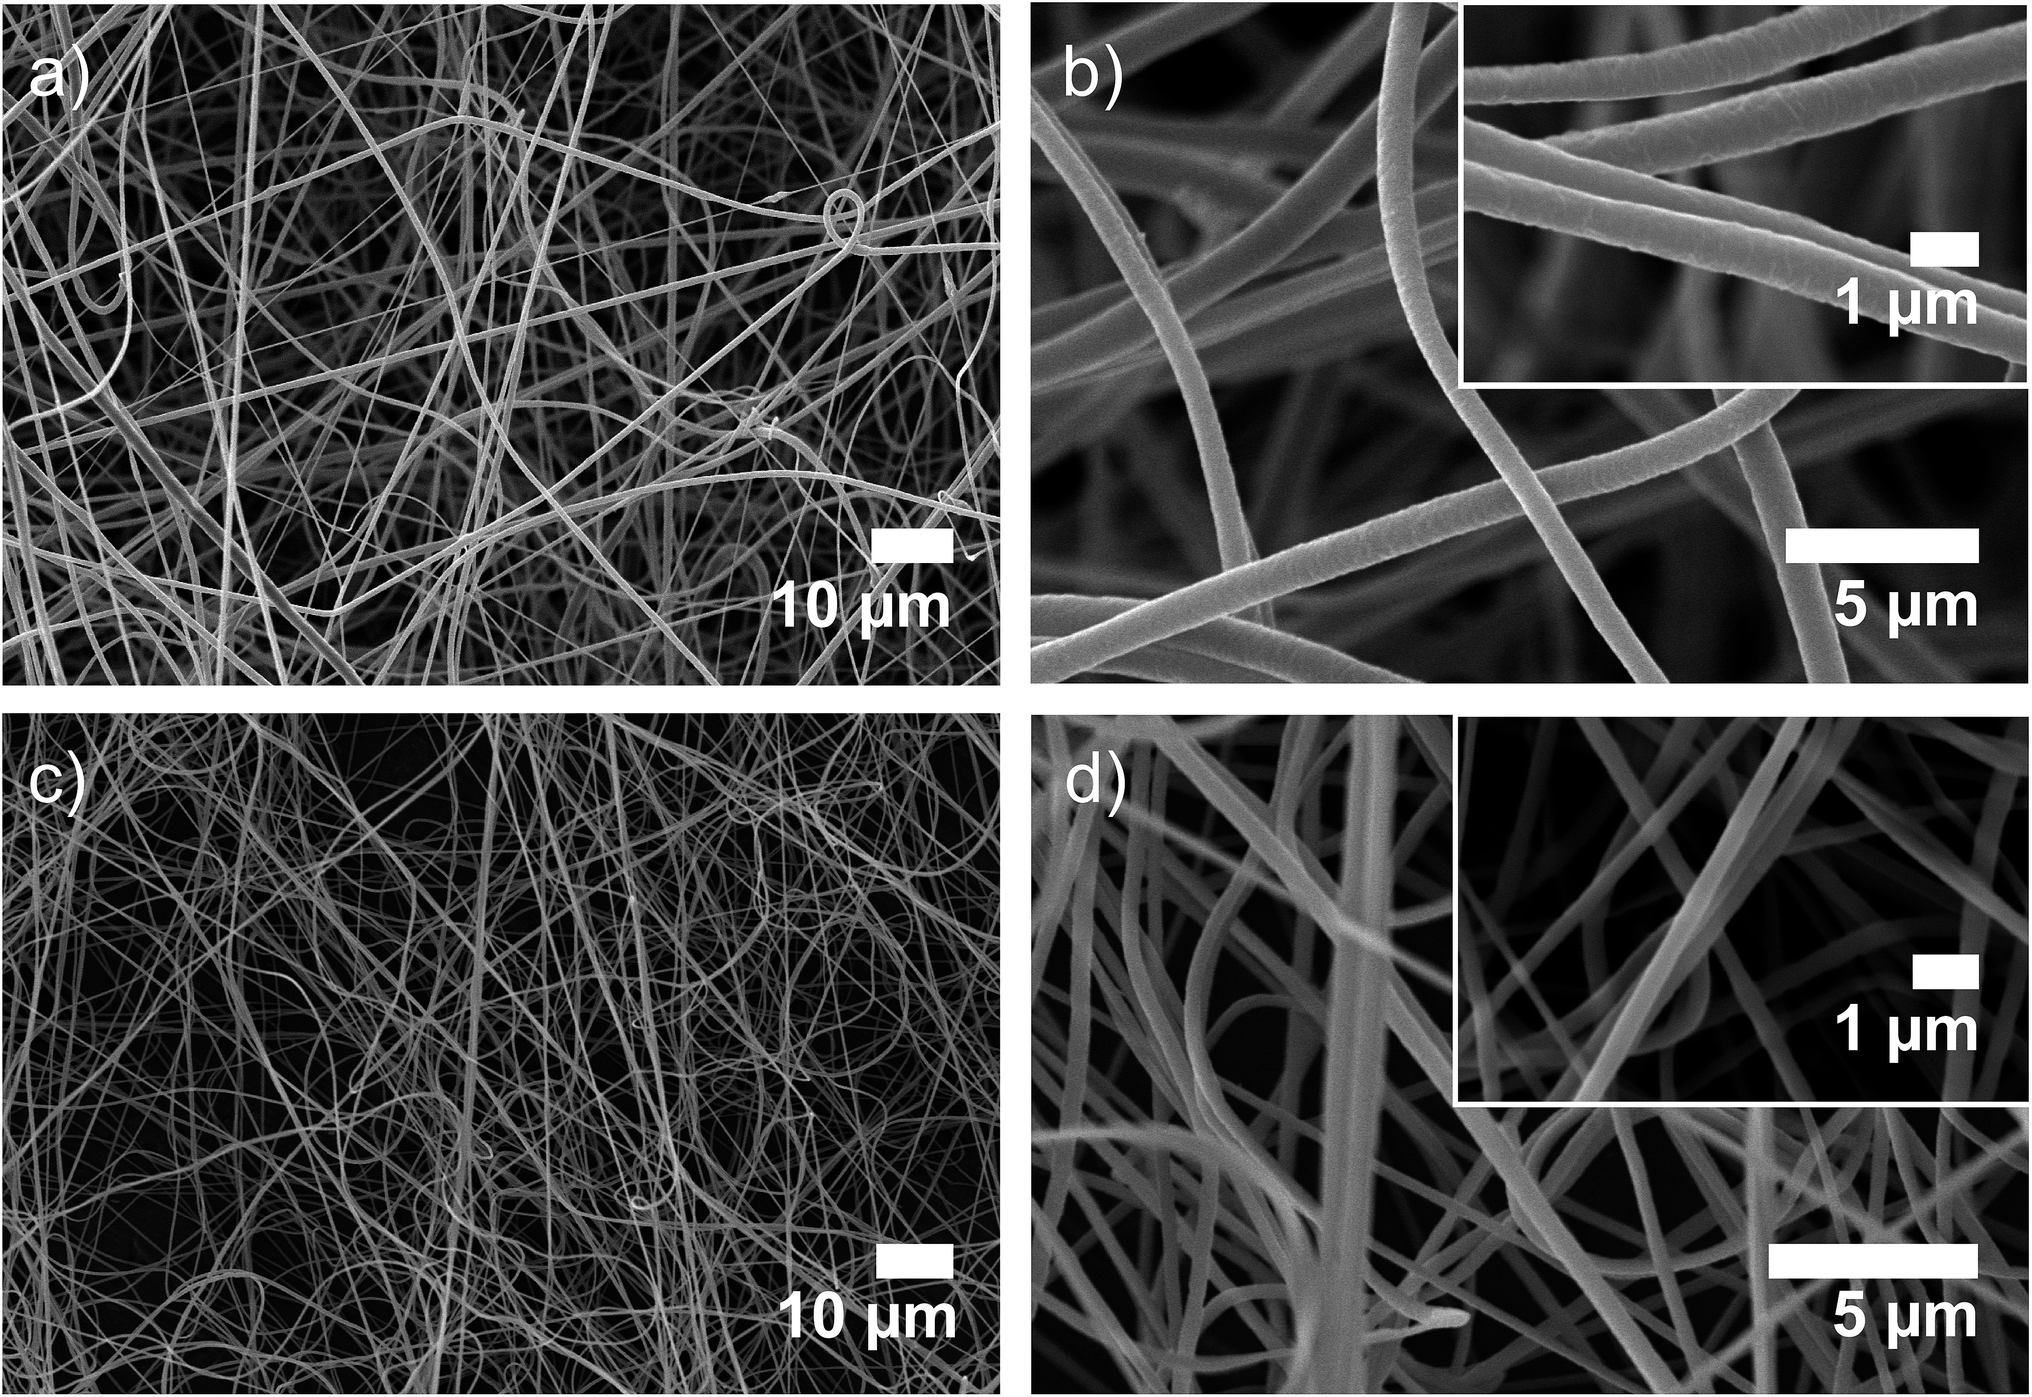 | ||
| Fig. 1 (a) and (b) SEM images of PVDF-HFP/SP fibers with an average diameter of 800 ± 70 nm at three different magnifications. (c) and (d) SEM images of PVDF-HFP/SP nanofibers with an average diameter of 250 ± 44 nm at different magnifications. | ||
The SP doped PVDF-HFP nanofibers, fibers and films were irradiated with UV light and then exposed to acidic vapors to ascertain both the photochromic and acidochromic properties of the materials. Before irradiation, the photochromic molecules were predominantly in the SP form, which does not have any absorption band in the visible region of the electromagnetic spectrum, as shown in Fig. 2a. After the UV stimulated conversion to the MC purple isomer, the structural modifications produced a zwitterionic conjugated system and a new absorption peak at 550 nm,24 characteristic of the MC, appeared. The maximal yield of MC photoconversion for the specific irradiation conditions used in this work was reached within 5 minutes in all systems, as revealed by monitoring the spectral changes at different UV irradiation times ranging from 0 to 7 minutes (Fig. S2, ESI†). Subsequently, upon exposure to gaseous acetic acid, the reduced charge delocalization, due to the formation of the protonated MC species,35 originated an absorption peak centered at around 417 nm accompanied by a color change of the fibrous mats and films from purple to yellow. In the emission spectrum, only the MC form was found to be fluorescent, with an emission peak centered at 623 nm (Fig. 2b). The emission quenching arising from the interaction with the acid could, thus, be exploited for real time signaling of acidic vapors for sensing applications. To this aim, the emission intensity at 623 nm of the UV irradiated films, fibers (d = 800 nm) and nanofibers (d = 250 nm) upon exposure to 10000 ppm of two different organic acids, namely acetic and formic acid, was monitored through confocal microscopy. The confocal images collected for each sample revealed a progressive decrease in the emission of MC as the conversion to the non-fluorescent MCH species proceeded, owing to the permeation of the acidic gas into the free volume of the polymer and through the entangled structure of the fibrous mats (Fig. 3). In fact, before any exposure to the acid vapors, the surface of the film and the structure of the fibers can be easily identified in the emission images due to their homogeneous emission. Upon exposure to the acid vapors, in contrast, the features of the confocal images indicative of the structure of the substrates become less evident until their complete extinction when all the MC molecules are protonated. It has to be noted that in the timeframe of the performed experiments, the competitive spontaneous isomerization of MC to the non-fluorescent SP form is negligible since the MC signal was found to be stable for at least 60 minutes after UV irradiation (Fig. S3a and b, ESI†).
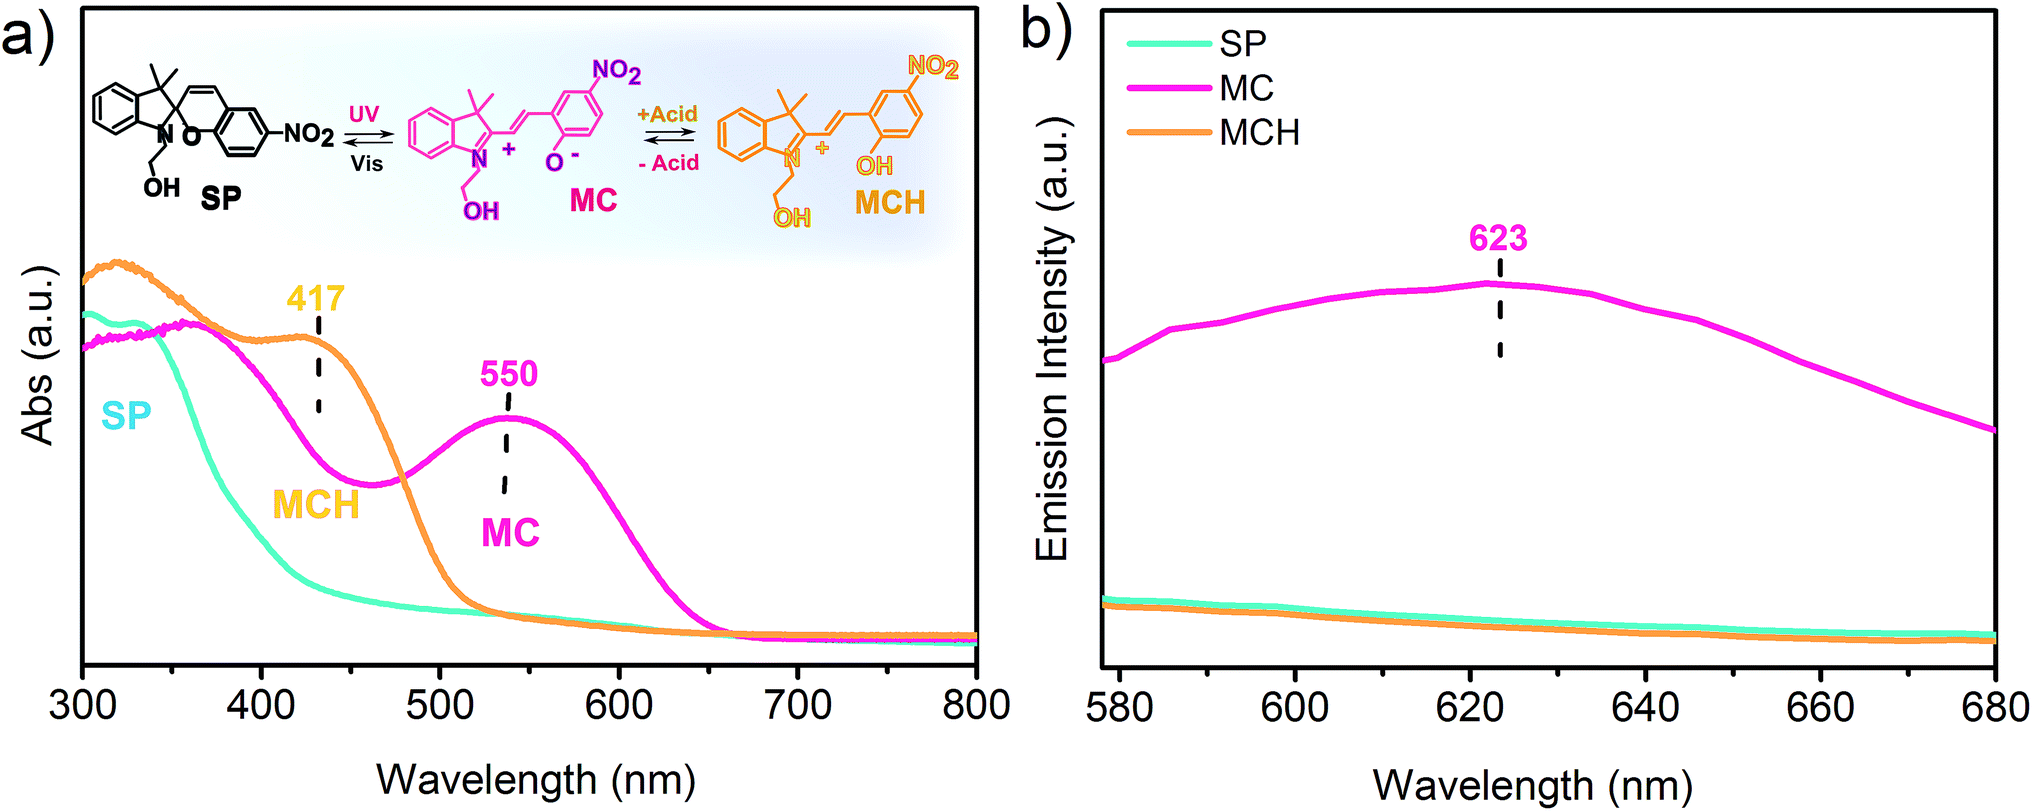 | ||
| Fig. 2 (a) Absorption spectra of SP (blue line), MC (pink line) and MCH (yellow line) embedded in PVDF-HFP nanofibers. The SP isomer is photoconverted to the MC counterpart by UV irradiation and the latter is then protonated upon exposure to acidic vapors of acetic acid. Inset: reversible interconversion between SP, MC and MCH upon light irradiation and acid vapor exposure/depletion. (b) Corresponding emission spectra of the aforementioned photochromic species, SP (blue line), MC (pink line) and MCH (yellow line). Similar spectra were obtained for PVDF-HFP/SP fibers and PVDF-HFP/SP films. | ||
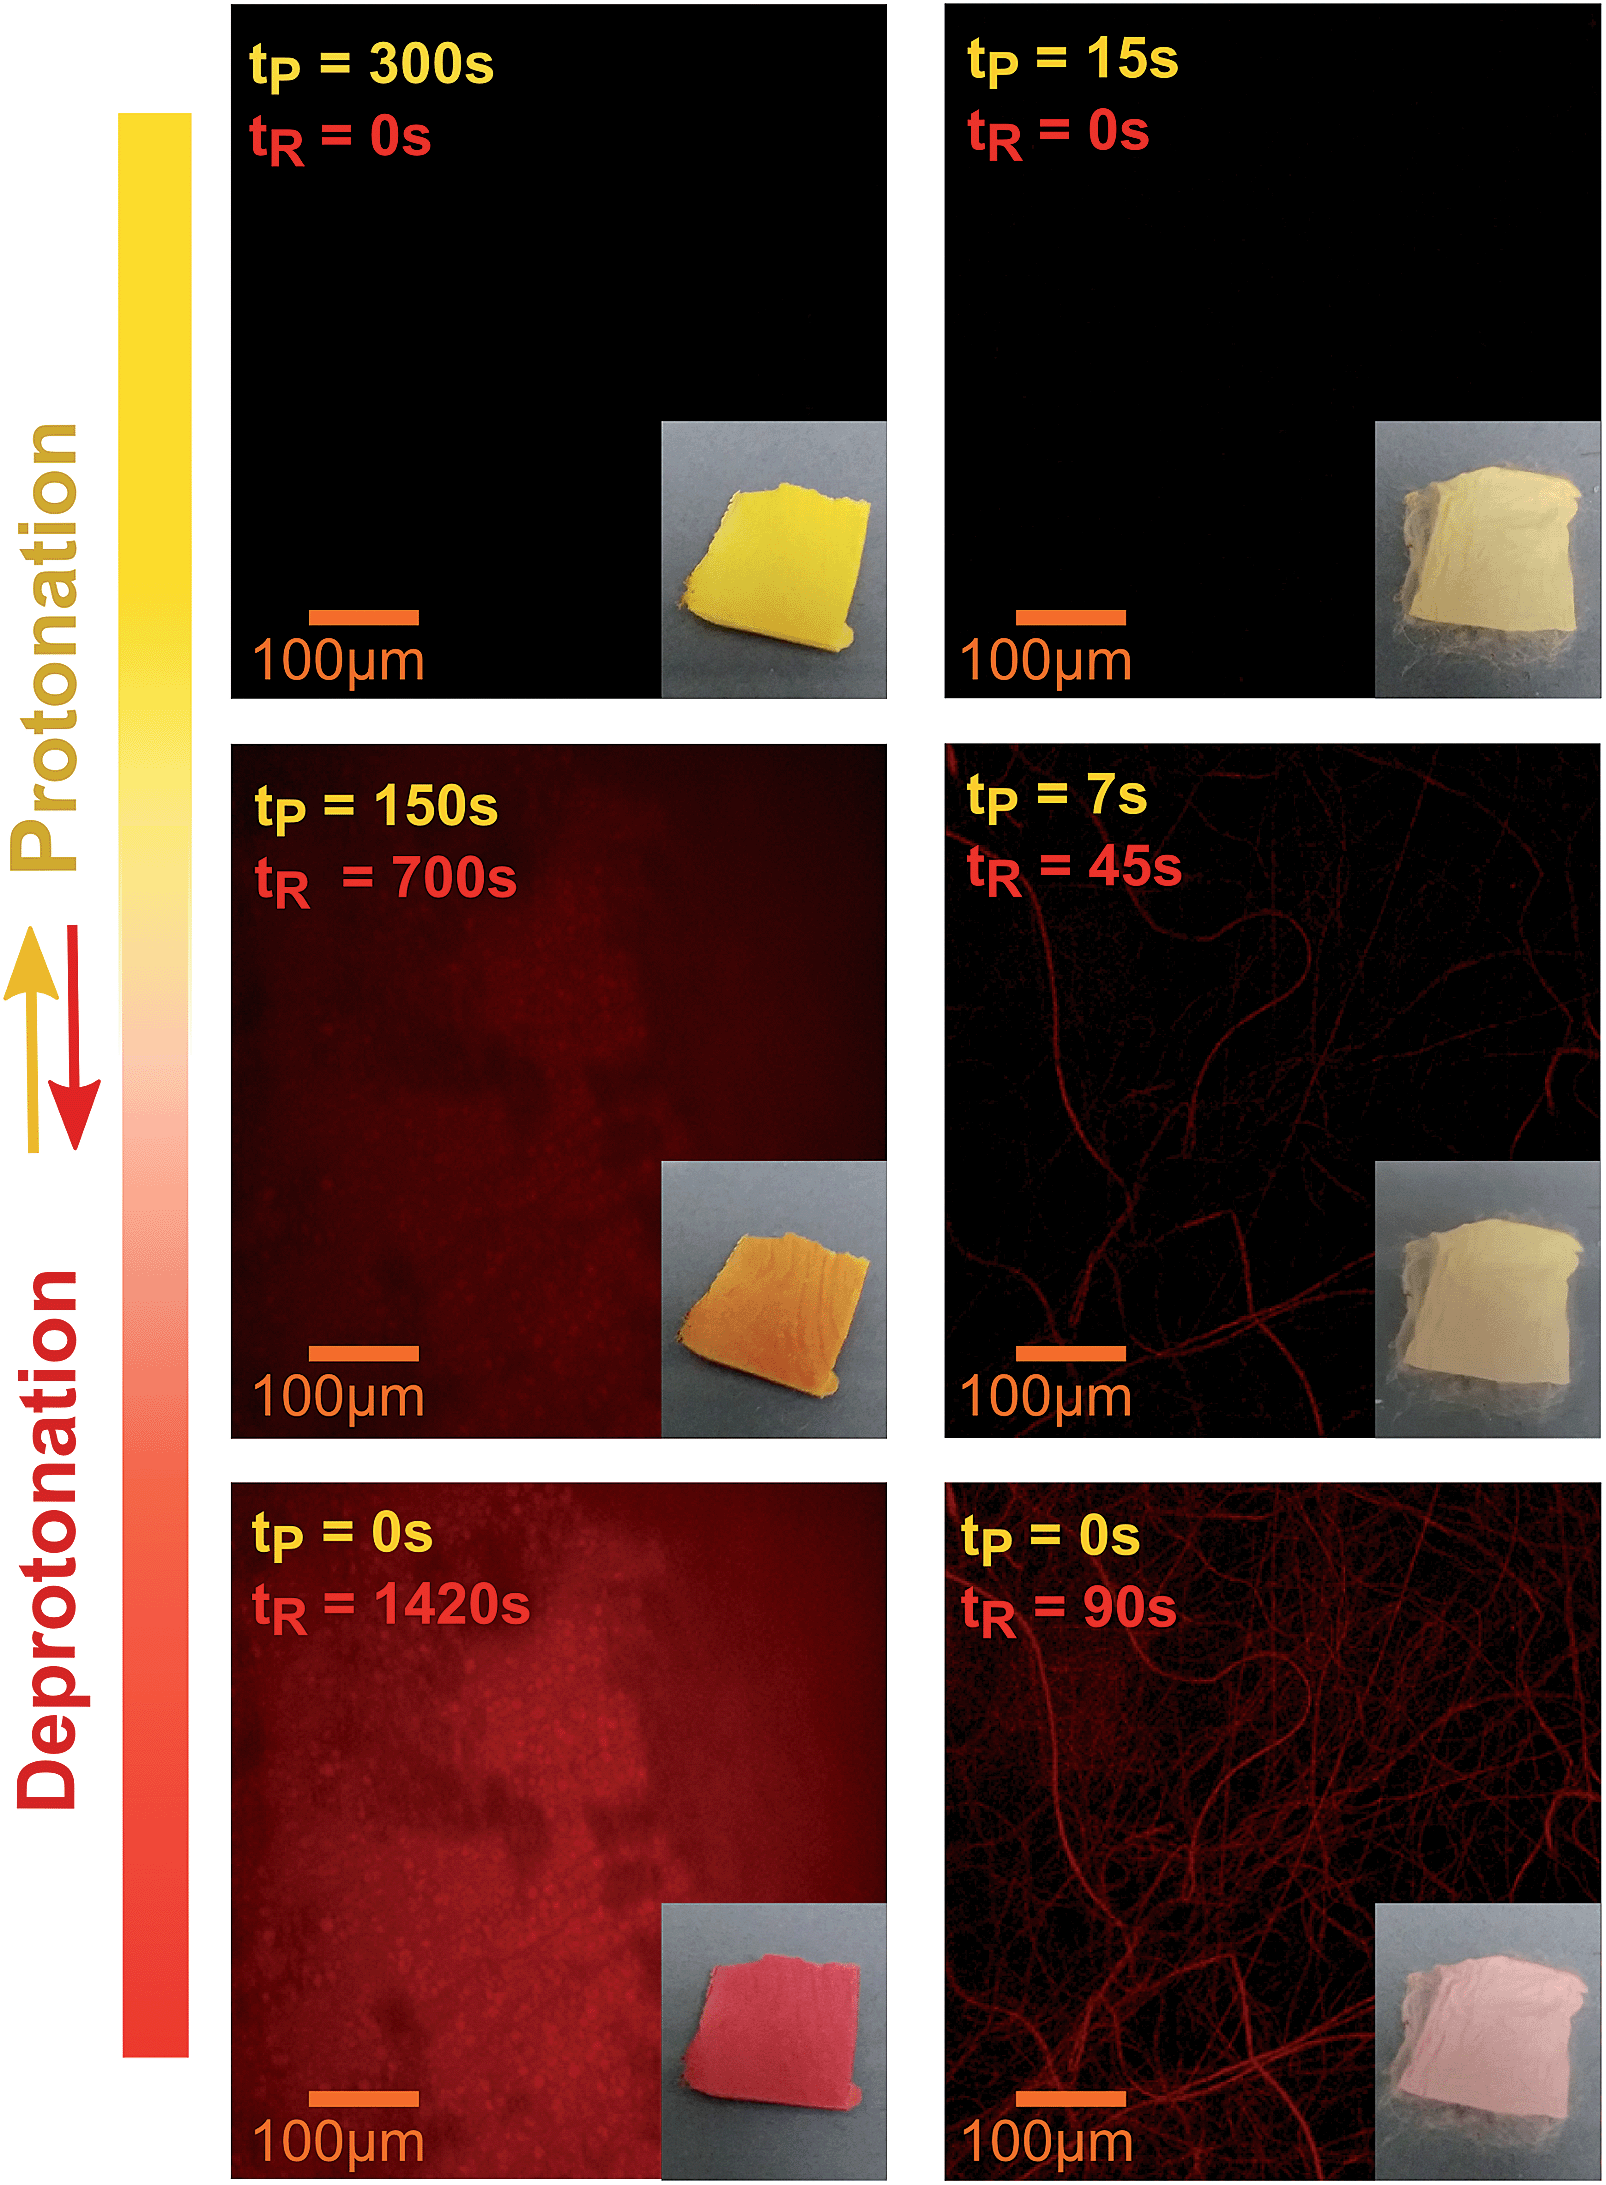 | ||
| Fig. 3 Confocal images of a PVDF-HFP/SP film (left column) and a PVDF-HFP/SP nanofibrous mat (right column) during progressive protonation upon exposure to acidic vapors of acetic acid. It can be observed that fluorescence is quenched in the presence of the acid and recovered as soon as the acid is depleted from the system. The specific protonation (tP) and recovery (tR) times associated with each image are also indicated. Insets: photographs of the corresponding samples undergoing a reversible color transition from purple to yellow upon protonation. | ||
Therefore, it can be safely concluded that the observed fluorescence quenching is solely attributed to the MCH form, due to the presence of the acid vapors, and not to the spontaneous reconversion to the SP form.
In parallel, the ongoing protonation can also be detected visually through a clear chromic transition in the substrates which turned from purple to pale orange and finally to yellow when all the MC molecules dispersed in the polymer matrix are converted to the MCH form (insets of Fig. 3).
Interestingly, as shown in Fig. 3, after removing the samples from the acidic environment, a spontaneous recovery of the emission signal was registered, which can be attributed to the restoring of the MC form as the gas molecules are released from the composites. This finding was further confirmed by the progressive chromic reversion from yellow, indicative of the MCH species, to purple, indicative of the free MC. Thus, it can be concluded that although the interactions with the acid are strong enough to give rise to distinctive optical and visual variations associated with the structural and electronic reorganization within the photochromic molecules, the regeneration of the pristine MC is not impeded under ambient conditions. Specifically, a spontaneous recovery to the initial state would be ideal in assembled complex sensing devices that could be damaged by chemical or thermal acid depletion treatments.
In order to investigate the effect of the substrate surface morphology on the kinetics of protonation of the PVDF-HFP/SP composites, the variation in the emission intensity at 623 nm upon exposure to acetic and formic acid was recorded through high speed acquisition spectra for each system and compared. During protonation with acetic acid (Fig. 4a and S4a–c, ESI†), a 90% decay in the optical emission signal was observed for the nanofibers after 15 seconds of exposure to the acid vapors. This time is 25% and 95% shorter than the corresponding times registered for the fibers (20 seconds) and for the film (300 seconds) respectively, indicating a faster protonation.
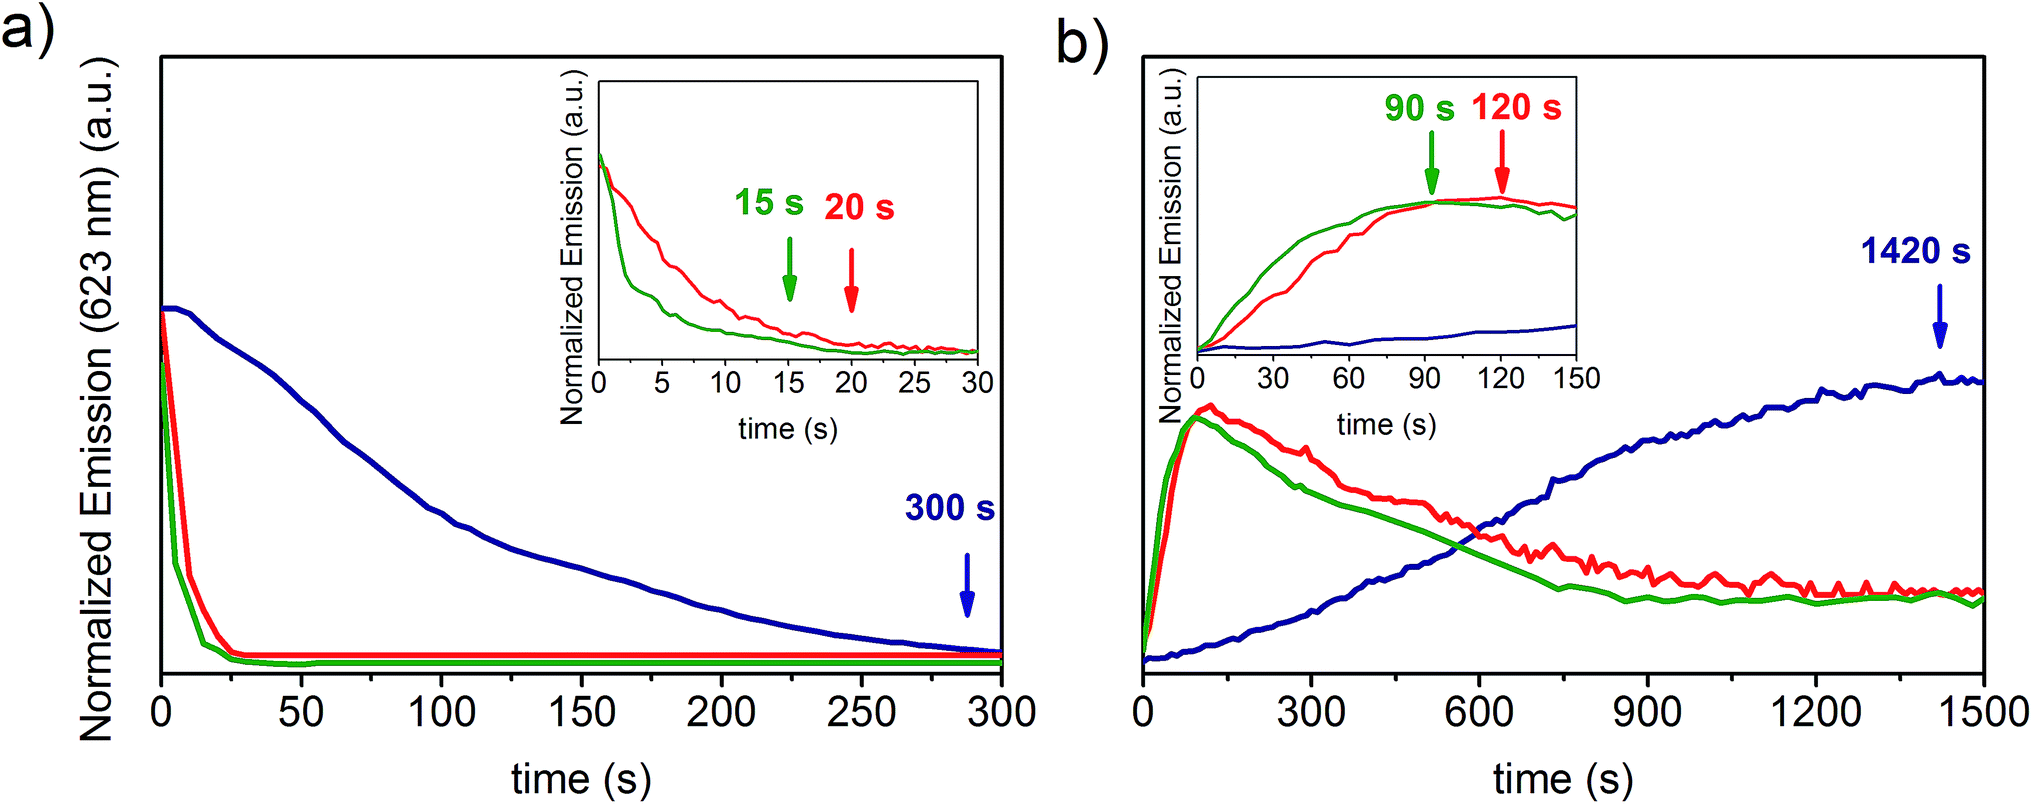 | ||
| Fig. 4 (a) Variation of the emission intensity at 623 nm of the PVDF-HFP/SP film (blue line), d = 800 nm fibers (red line) and d = 250 nm nanofibers (green line) during protonation with acetic acid. Inset: zoom-in of the emission intensity up to 30 s. (b) Variation of the emission at 623 nm of the PVDF-HFP/SP film (blue line), d = 800 nm fibers (red line) and d = 250 nm nanofibers (green line) upon spontaneous deprotonation of MCH previously generated by exposure to acetic acid. Inset: zoom-in of the emission intensity up to 150 s. | ||
When formic acid was used, a similar reduction in the response times was determined for nanofibers compared to fibers (30%) and films (98%) (Fig. S5a, ESI†). Nonetheless, the protonation process with formic acid was much faster in all samples (3.5, 5.0, and 200.0 seconds for nanofibers, fibers and films respectively) compared to acetic acid. The general enhancement of the protonation rate upon exposure to formic acid can be ascribed to its slightly higher acidity.18 However, even though the film exhibited a 50% faster protonation with formic acid in comparison to that with acetic acid, a more significant difference (ca. 300%) was found for both the fibrous samples, suggesting that other factors may be invoked to explain these two different kinetic profiles, in addition to the effect attributed to the acidity. Specifically, during the performed experiments, the vapors were produced by means of the evaporation of liquid acid and, given the almost 200% higher vapor pressure of formic acid (35.00 mmHg) with respect to acetic acid (11.87 mmHg) at 20 °C,36 the higher volatility of the former generates a much more rapid protonation as more molecules are available in the gas phase to interact with the material. Therefore, the remarkably faster optochemical response associated with protonation with formic acid in fibers and nanofibers arises from such dependence on the evaporation rate of the acid. This effect prevails among other factors since the expected high surface area of fibrous systems allows efficient vapor exposure, increasing, in turn, the possibility for MC molecules to interact with the acid on a timescale comparable to that of the vapor formation. On the other hand, for systems that respond 1 to 2 orders of magnitude more slowly, such as films, the contribution of the vapor volatility to the kinetics is reasonably negligible, and, as a result, the difference in the protonation rates registered for the two acids is notably reduced.
In this case, in contrast to what was observed for fibers, protonation appears to be primarily governed by the diffusion of the vapors through the bulk material and, in fact, the acid dependent variation in the response times reflects the corresponding vapor diffusivity within the polymer matrix, which is higher for formic acid due to its 37% smaller critical volume37 (106.5 cm3 mol−1) with respect to the value reported for acetic acid (171.1 cm3 mol−1).38 After exposure to either acetic acid or formic acid, a signal recovery of 80% was measured in all samples. During the desorption of acetic acid, the timescale for the maximal regeneration of the free MC species incorporated into the nanofibers was 90 seconds. This deprotonation time is 25% and 94% shorter relative to that of fibers (120 seconds) and films (1420 seconds) respectively (Fig. 4b and S6a–c, ESI†), according to what was observed for protonation. Although a similar decrease in the deprotonation times of nanofibers compared to the fibers and films was obtained when desorption of formic acid occurred, the process was slightly slower with regard to acetic acid as it required 91.6 seconds, 121.6 seconds and 1491.6 seconds respectively (Fig. S5b, ESI†). The slower deprotonation rate of formic acid vapors with respect to acetic acid, similar for all systems, further confirms that the former possibly interacts more strongly with the MC molecules due to its higher acidity, thus leading to a longer retention time within the material.
Finally, it has to be noted that the decay in the emission intensity observed in the fibrous samples after the maximal recovery of MC was reached is due to the reconversion to the non-fluorescent SP isomer generated upon continuous and extensive exposure to the excitation green light. In fact, the fluorescence intensity could be restored upon UV irradiation.
Comparing the responses of the three systems exposed to either formic or acetic acid, the faster protonation and deprotonation observed for the nanofibers with respect to the films and to the fibers (d = 800 nm) can be attributed to the enhanced vapor diffusion and desorption arising from the surface area dictated by both the surface morphology and the average fiber diameter. More specifically, the continuous three-dimensional, entangled nanofibrous network allows a more effective vapor permeation in contrast to the denser film morphology and to the longer diffusion paths of the gas molecules within the fibers (d = 800 nm).11 To confirm this, BET measurements were performed in order to quantify the specific surface area for each type of sample. Consistent with the kinetic profiles, as shown in Fig. 5 and S7, ESI† a higher specific surface area, 7 m2 g−1, was determined for the nanofibers, whereas two times and eight times lower values, 3.4 and 0.826 m2 g−1, were obtained for the d = 800 nm fibers and the film respectively (Table S2, ESI†).
 | ||
| Fig. 5 Protonation time as a function of the specific surface area of a PVDF-HFP/SP film and of d = 800 and d = 250 nm fibrous mats upon exposure to acid vapors of formic (blue triangles) and acetic acid (green dots). Inset: zoom-in for protonation times up to 30 s. | ||
As previously documented,39 nanofibrous mats exhibit a higher specific surface area by one or two orders of magnitude relative to films of the same material. This allows a more efficient and homogeneous vapor adsorption and diffusion,40 thus enhancing the interaction between the acid gas molecules and the MC sites dispersed in the polymer matrix. In this way, by simply tuning the surface morphology and the fiber diameter of the composite systems it is possible to achieve very fast responses to acidic vapors and recovery times without modifying the actual composition and the inherent properties of the developed material.
To study the reversibility of the interactions between the photochromic dopant embedded in the polymer matrix and the acid molecules, extensive cycles of protonation and recovery were performed on the nanofibers, given their superior performance in terms of protonation–deprotonation rate with respect to the other systems.
As shown in Fig. 6, the nanofibers exhibited outstanding reproducibility in their functionality, as more than 40 protonation/deprotonation sequences were performed by alternate exposure to acidic vapors of acetic acid for 30 seconds followed by a 90 second spontaneous recovery of MC in the dark, with no significant losses (<2%) in the emission signal in the first 2–10 cycles and minimal variations by less than 5% in the successive cycles up to the 25th cycle. Afterwards, the observed progressive decrease in the emission intensity upon repeated protonation and deprotonation is not due to chemical degradation processes induced by the acidic vapors but it results from the partial photoreconversion to SP in combination with possible photodegradation phenomena generated by the extensive exposure to green light at the excitation wavelength during the acquisition of the emission spectra, as demonstrated by the similar behavior revealed under the same conditions in the absence of the acidic environment (Fig. S8, ESI†).
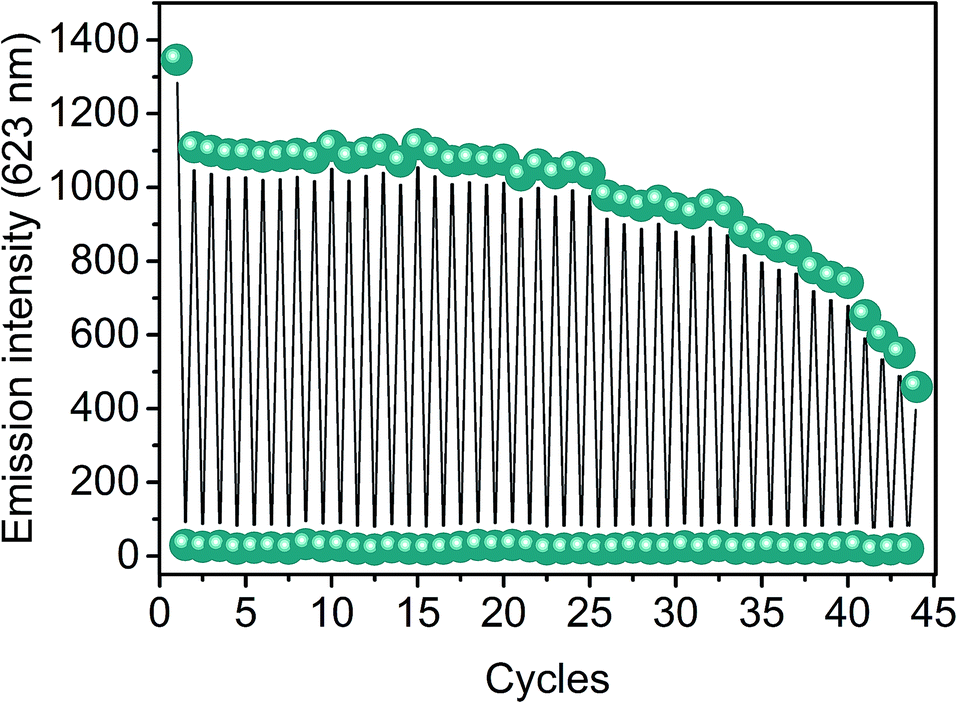 | ||
| Fig. 6 Cycles of protonation of PVDF-HFP/SP nanofibers exposed to vapors of acetic acid for 30 seconds and subsequent spontaneous deprotonation to the MC species (90 seconds). | ||
It should be mentioned that at the first cycle, the 20% fall-off in the emission with respect to the signal acquired before the first protonation is attributed to the complex photochemistry of the SPs, and may originate from different photochemical processes. Among other effects, one possible explanation, as demonstrated by Markworth et al.,41 relies on the coexistence of both cis and trans MC isomers after UV irradiation of the SP. Both types of isomers undergo protonation upon exposure to acidic vapors to yield the corresponding cis and trans MCH isomers. Upon acid desorption, deprotonation of the latter, which are predominant, regenerates the stable fluorescent trans MC, whereas the cis MCH isomers reconvert to less stable cis MC species, which then isomerize spontaneously to non-fluorescent SPs, resulting in a loss of the emission signal. The remaining trans MC species could then undergo protonation again in the successive cycles, ensuring a total reversibility of the acidochromic performance in terms of protonation and recovery. Similar results but on longer protonation–deprotonating timescales were obtained for films and fibers (d = 800 nm). Therefore, the high reusability renders these nanofibrous composites ideal for vapor sensing applications performed routinely that require a fast and reversible detection.
Compared to the spiropyran elastomeric films described elsewhere,18 all the presented PVDF-HFP/SP systems exhibit a more sensitive and rapid optical response (more than two times faster for films and 1–2 orders of magnitude faster for fibers) towards both acetic and formic acid vapors. Furthermore, for the spiropyran elastomeric films18 the acid vapor desorption and subsequent deprotonation of the photochromic dopant required a thermal treatment at 120° in contrast to the presented materials that can be processed at room temperature.
The acidochromic response of the PVDF-HFP/SP nanofibers was further investigated addressing the sensitivity of the material to different concentrations of gaseous acetic acid. As shown in Fig. 7, the sensory system exhibited a highly linear response upon increasing the concentration of the analyte in the range between 750 and 4500 ppm. Since the ratio of the emission intensity before (I0) and after (I) exposure to acidic vapors was found to vary in direct proportion to the concentration of acetic acid, a bimolecular quenching process holds under these conditions and it is described by the Stern–Volmer relation (eqn (1))42–44
| I0/I = 1 + Ksv[Q] | (1) |
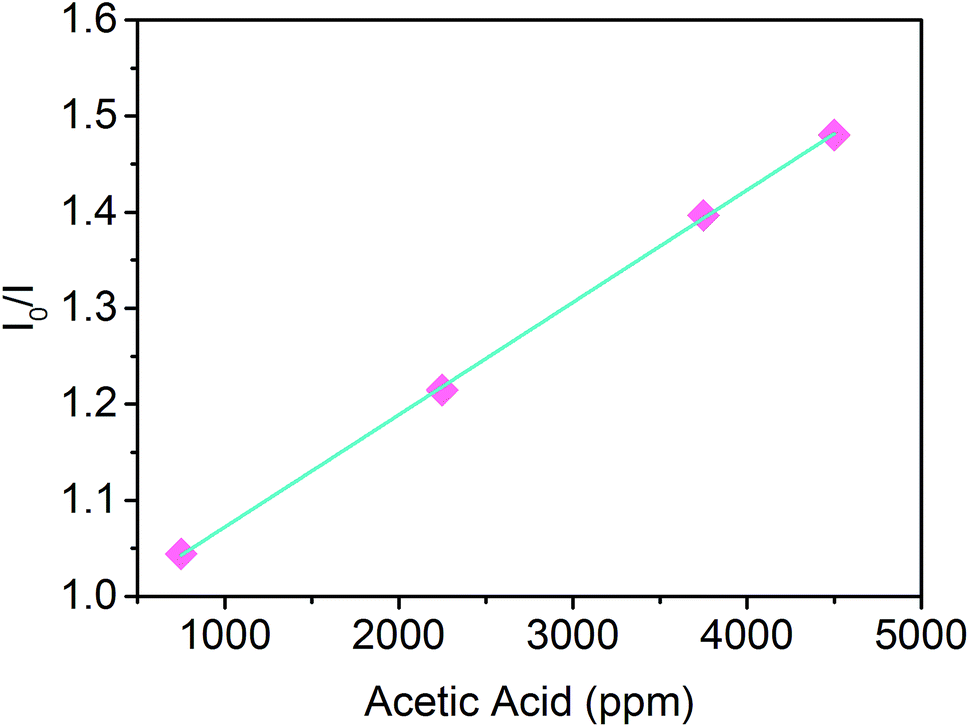 | ||
| Fig. 7 Stern–Volmer plot of the PVDF-HFP/SP nanofibers exposed to four different concentrations of acetic acid vapors. | ||
Specifically, Ksv defines the quenching efficiency and the higher its value the more sensitive the material. From the slope (Ksv) of the linear plot of I0/I versus the concentration of the gas, it could be observed that the nanofibers exhibited a sensitivity of 1.17 × 10⁻⁴ ppm−1. The linearity and sensitivity of the optical variation demonstrate, thus, the feasibility of fibrous composites based on SPs for sensing applications for the first time, rendering such materials promising for the development of photochromic sensing probes with a fast and tunable response.
Compared to the most recent acetic acid gas sensors reported in the literature (Table S3, ESI†), the presented PVDF-HFP/SP fibers and nanofibers, apart from the possibility to be activated on demand upon light irradiation, also show a better sensing performance. In particular, other polymeric sensors filled with acidoresponsive dyes as well as some semiconductor layered systems exhibit slower gas detection2,18,45,46 (from 25 s to more than 10 min) and system recovery (from a few minutes to a few hours).2,18,46 Although other approaches based on sensing layers of metal oxide nanomaterials on solid substrates could provide similar or even more rapid response and recovery,47–49 they require time-consuming fabrication protocols and high operating temperatures (300–350 °C), which, coupled with lack of flexibility, would not be ideal for on-line detection in portable devices. On top of that, unlike spiropyrans, such sensors do not respond selectively to acidic vapors since they also strongly interact with diverse organic solvents.48,49 Therefore, the herein presented PVDF-HFP/SP systems are overall more versatile as they offer naked eye detection, processing under ambient conditions and unprecedented reusability. In fact, we demonstrate that the proposed composites can perform more than 40 adsorption/desorption cycles, in contrast to previous studies where, typically, repeated measurements on the acid gas sensors are not investigated beyond 4–6 cycles.2,18,47
Conclusions
In summary, the acidochromic behavior of a photochromic nanofibrous PVDF-HFP/SP composite exposed to acidic vapors of organic acids was investigated for the first time. Specifically, the fluorescence quenching associated with the protonation of the photogenerated merocyanine embedded in the polymer matrix in contact with vapors of acetic acid was found to be proportional to the analyte concentration in accordance with the Stern–Volmer model. Moreover, the interactions with the acid were observed to be reversible even at a high vapor concentration with a very robust re-usability. The system exhibited a remarkably faster detection and regeneration of the pristine status with respect to fibers and films of the same material, consistent with the enhanced vapor exposure imparted by the higher specific surface area of the small fibrous structure. Overall, these results indicate that PVDF-HFP/SP composite fibrous membranes can serve as platforms for real time visual and optical detection of acidic gaseous species for optochemosensing applications based on emission spectroscopy and that the response of the photochromic SP dopant can be controlled by opportune selection of the material morphology and surface area. Such features could be modified, for instance, by varying the electrospinning parameters and processing conditions of the fiber fabrication protocol or by imparting a specific porosity on films by opportunely changing the solvent and the temperature of drying. We propose, thus, an alternative approach for real time acid gas sensing that is simple, cost-effective and suitable for micro-/nanoscale integration within more complex engineered functional systems for environmental and industrial applications.Acknowledgements
The authors acknowledge M. Scotto for his assistance with the emission measurements and A. Davis, Dr G. Caputo and Dr G. Perotto for their helpful comments and fruitful conversation.References
-
J. W. Gardner and P. N. Bartlett, Electronic Noses Principles and Applications, Oxford University Press, New York, NY, USA, 1999 Search PubMed
.
- T. Prakash, R. Jayaprakash, D. Sathya Raj, S. Kumar, N. Donato, D. Spadaro and G. Neri, Sens. Actuators, B, 2013, 176, 560–568 CrossRef CAS
- C. Wang, S. Ma, A. Sun, R. Qin, F. Yang, X. Li, F. Li and X. Yang, Sens. Actuators, B, 2014, 193, 326–333 CrossRef CAS
- T. T. Wang, S. Y. Ma, L. Cheng, X. L. Xu, J. Luo, X. H. Jiang, W. Q. Li, W. X. Jin and X. X. Sun, Mater. Lett., 2015, 142, 141–144 CrossRef CAS
- S. H. Lim, L. Feng, J. W. Kemling, C. J. Musto and K. S. Suslick, Nat. Chem., 2009, 1, 562–567 CrossRef CAS PubMed
- L. Feng, C. J. Musto, J. W. Kemling, S. H. Lim and K. S. Suslick, Chem. Commun., 2010, 46, 2037–2039 RSC
- K. Li, Y. Chen, W. Lu, N. Zhu and C. M. Che, Chem.–Eur. J., 2011, 17, 4109–4112 CrossRef CAS PubMed
- S. Kang, S. Kim, Y. K. Yang, S. Bae and J. Tae, Tetrahedron Lett., 2009, 50, 2010–2012 CrossRef CAS
- P. Muthukumar and S. Abraham John, Sens. Actuators, B, 2011, 159, 238–244 CrossRef CAS
- Z. Ouyang, J. Li, J. Wang, Q. Li, T. Ni, X. Zhang, H. Wang, Q. Li, Z. Su and G. Wei, J. Mater. Chem. B, 2013, 1, 2415–2424 RSC
- C. Wolf, M. Tscherner and S. Köstler, Sens. Actuators, B, 2015, 209, 1064–1069 CrossRef CAS
- X. Wang, Y. G. Kim, C. Drew, B. C. Ku, J. Kumar and L. A. Samuelson, Nano Lett., 2004, 4, 331–334 CrossRef CAS
- B. Ding, M. Wang, X. Wang, J. Yu and G. Sun, Mater. Today, 2010, 13, 16–27 CrossRef CAS
- Y. Zhang, J. J. Kim, D. Chen, H. L. Tuller and G. C. Rutledge, Adv. Funct. Mater., 2014, 24, 4005–4014 CrossRef CAS
- S. Virji, J. Huang, R. B. Kaner and B. H. Weiller, Nano Lett., 2004, 4, 491–496 CrossRef CAS
- R. P. Xue, P. Behera, J. Xu, M. S. Viapiano and J. J. Lannutti, Sens. Actuators, B, 2014, 192, 697–707 CrossRef CAS PubMed
- M. Hu, W. Kang, B. Cheng, Z. Li, Y. Zhao and L. Li, Microchim. Acta, 2016, 183, 1713–1720 CrossRef CAS
- M. E. Genovese, A. Athanassiou and D. Fragouli, J. Mater. Chem. A, 2015, 3, 22441–22447 CAS
- R. Klajn, Chem. Soc. Rev., 2014, 43, 148–184 RSC
- Y. Nam, I. Yoo, O. Yarimaga, I. S. Park, D. H. Park, S. Song, J. M. Kim and C. W. Lee, Chem. Commun., 2014, 50, 4251–4254 RSC
- G. Berkovic, V. Krongauz and V. Weiss, Chem. Rev., 2000, 100, 1741–1754 CrossRef CAS PubMed
- S. V. Paramonov, V. Lokshin and O. A. Fedorova, J. Photochem. Photobiol., C, 2011, 12, 209–236 CrossRef CAS
- A. Athanassiou, M. Kalyva, K. Labiotaki, S. Georgiou and C. Fotakis, Adv. Mater., 2005, 17, 988–992 CrossRef CAS
- D. Fragouli, L. Persano, G. Paladini, D. Pisignano, R. Carzino, F. Pignatelli, R. Cingolani and A. Athanassiou, Adv. Funct. Mater., 2008, 18, 1617–1623 CrossRef CAS
- P. Tannouri, K. M. Arafeh, J. M. Krahn, S. L. Beauprè, C. Menon and N. R. Branda, Chem. Mater., 2014, 26, 4330–4333 CrossRef CAS
- A. Athanassiou, M. I. Lygeraki, D. Pisignano, K. Lakiotaki, M. Varda, E. Mele, C. Fotakis, R. Cingolani and S. H. Anastasiadis, Langmuir, 2006, 22, 2329–2333 CrossRef CAS PubMed
- F. Di Benedetto, E. Mele, A. Camposeo, A. Athanassiou, R. Cingolani and D. Pisignano, Adv. Mater., 2008, 20, 314–318 CrossRef CAS
- B. L. Shuiping, T. Lianjiang, H. Weili, L. Xiaoqiang and C. Yanmo, Mater. Lett., 2010, 64, 2427–2430 CrossRef
- S. C. K. Misra, P. Mathur, M. Yadav, M. K. Tiwari, S. C. Garg and P. Tripathi, Polymer, 2004, 45, 8623–8628 CrossRef CAS
- J. Sun, P. Xue, J. Sun, P. Gong, P. Wang and R. Lu, J. Mater. Chem. C, 2015, 3, 8888–8894 RSC
- F. Ahmed, N. R. Choudhury, N. K. Dutta, S. Brito Abreu, A. Zannettino and E. Duncan, Biomacromolecules, 2014, 15, 744–755 CrossRef CAS PubMed
- M. Wang, S. A. Vail, A. E. Keirstead, M. Marquez, D. Gust and A. A. Garcia, Polymer, 2009, 50, 3974–3980 CrossRef CAS
- C. Yao, X. Li, K. G. Neoh, Z. Shi and E. T. Kang, Appl. Surf. Sci., 2009, 255, 3854–3858 CrossRef CAS
- A. Radu, R. Byrne, N. Alhashimy, M. Fusaro, S. Scarmagnani and D. Diamond, J. Photochem. Photobiol. A, 2009, 206, 109–115 CrossRef CAS
- T. A. Darwish, R. A. Evans, M. James and T. L. Hanley, Chem.–Eur. J., 2011, 17, 11399–11404 CrossRef CAS PubMed
-
J. Speight, Lange's Handbook of Chemistry, McGraw-Hill Education LLC, 16th edn, 2005 Search PubMed
- T. C. Merkel, V. I. Bondar, K. Nagai, B. D. Freeman and I. Pinnau, J. Polym. Sci., Part B: Polym. Phys., 2000, 38, 415–434 CrossRef CAS
- Wiley Infotherm thermophysical properties database.
- B. Ding, M. Wang, X. Wang, J. Yu and G. Sun, Sensors, 2009, 9, 1609–1624 CrossRef CAS PubMed
- Y. Che, X. Yang, S. Loser and L. Zang, Nano Lett., 2008, 8, 2219–2223 CrossRef CAS PubMed
- P. B. Markworth, B. D. Adamson, N. J. A. Coughlan, L. Goerigk and E. J. Bieske, Phys. Chem. Chem. Phys., 2015, 17, 25676–25688 RSC
- X. Wang, C. Drew, S. H. Lee, K. J. Senecal, J. Kumar and L. A. Samuelson, Nano Lett., 2002, 2, 1273–1275 CrossRef CAS
- T. M. A. Razek, S. Spear, S. S. M. Hassan and M. A. Arnold, Talanta, 1999, 48, 269–275 CrossRef CAS PubMed
- M. E. K. Wahba, N. El-Enany and F. Belal, Anal. Methods, 2015, 7, 10445–10451 RSC
- M. R. R. Khan, B. H. Kang, S. W. Lee, S. H. Kim, S. H. Yeom, S. H. Lee and S. W. Kang, Opt. Express, 2013, 21, 20119–20130 CrossRef PubMed
- L. E. Norena-Franco and F. Kvasnik, Analyst, 1996, 121, 1115–1118 RSC
- N. Song, H. Jiang, T. Cui, L. Chang and X. Wang, Micro Nano Lett., 2012, 7, 943–946 Search PubMed
- L. Cheng, S. Y. Ma, T. T. Wang, J. Luo, X. B. Li, W. Q. Li, Y. Z. Mao and D. J. Gz, Mater. Lett., 2014, 137, 265–268 CrossRef CAS
- C. Zhiming, Z. Sumei, C. Tongyun, D. Yongping, Z. Wangbing and C. Xiangfeng, J. Semicond., 2012, 33, 112003 CrossRef
Footnote |
| † Electronic supplementary information (ESI) available: SEM micrographs of PVDF-HFP/SP fibers electrospun using different polymer concentrations, table listing the effect of polymer concentration on the fiber morphology, absorption spectra of PVDF-HFP/SP composites at different UV irradiation times, absorption spectra of PVDF-HFP/SP nanofibers at different times after UV irradiation, spectral variation of PVDF-HFP/SP composites upon protonation with acetic acid vapors and vapor desorption, kinetics of protonation and recovery of PVDF-HFP/SP composites exposed to formic acid vapors, recovery time of PVDF-HFP/SP composites as a function of the specific surface area, table listing the specific surface areas of PVDF-HFP/SP composites and the corresponding correlation coefficients of the BET fit, cycles of green light irradiation and dark storage of PVDF-HFP/SP nanofibers, and table reporting the performance of acetic acid vapor sensors. See DOI: 10.1039/c6ta08793k |
| This journal is © The Royal Society of Chemistry 2017 |