
Facile hydrothermal fabrication of ZnO–graphene hybrid anode materials with excellent lithium storage properties†
Yan
Feng
 *ab,
Yuliang
Zhang
a,
Xiangyun
Song
b,
Yuzhen
Wei
a and
Vincent S.
Battaglia
b
*ab,
Yuliang
Zhang
a,
Xiangyun
Song
b,
Yuzhen
Wei
a and
Vincent S.
Battaglia
b
aKey Laboratory of Inorganic–Organic Hybrid Functional Materials Chemistry, Ministry of Education, Tianjin Key Laboratory of Structure and Performance for Functional Molecules, College of Chemistry, Tianjin Normal University, Tianjin 300387, P. R. China. E-mail: hxxyfy@mail.tjnu.edu.cn
bEnergy Storage and Distributed Resources Division, Energy Technologies Area, Lawrence Berkeley National Laboratory, Berkeley, California 94720, USA
First published on 31st March 2017
Abstract
ZnO–graphene hybrid materials were successfully synthesized from graphene oxide (GO) and zinc acetate by a facile hydrothermal fabrication method. Three composites of ZnO–graphene hybrids with different graphene incorporation amounts were prepared by changing the dosage of GO. The chemical composition, morphology, and structural characterization reveal that the wurtzite-phase ZnO particles with diameters less than 10 nm were uniformly anchored on the graphene sheets to form ZnO–graphene hybrid materials. The ZnO–graphene hybrids were utilized as anodes in the construction of high-performance lithium-ion batteries. One of the hybrids, the ZnO–HG composite with 71.5 wt% graphene content, exhibits a high reversible specific capacity (749.2 mA h g−1), excellent cycle stability over 100 cycles (70.3% retention), and good rate performance at a high current density of 2 A g−1 (354.1 mA h g−1). Additionally, to further investigate the anodes for practical use in full Li-ion cells, we for the first time, tested the ZnO–graphene anodes at different cut-off voltages. The results show that even at the low cut-off voltage of 0.01–1.0 V, the ZnO–HG anode can still deliver the reversible capacity of 240 mA h g−1, which is qualified for use as an anode material in Li-ion full cells. The excellent performances are attributed to the presence of graphene which has an important role as the ZnO nucleation substrate during preparation, highly conductive agent, and volume expansion buffer during prolonged charge/discharge cycling.
1. Introduction
State-of-the-art rechargeable lithium ion batteries have attracted tremendous attention in the past few decades due to their promising application for energy storage and conversion.1,2 Major challenges for anode materials in lithium ion batteries, such as the current graphite anode, including a relatively low Li-storage capacity of 372 mA h g−1, low kinetics at high charge–discharge rates, and potential safety issues,3,4 require solutions to achieve practical application in current platforms such as electric vehicles (EVs), hybrid EVs, electricity grid storage devices, and so on.5,6 Therefore, there is an urgent need to extensively explore even higher capacity and cycling stability anode materials for next-generation lithium ion batteries.7As one of the alternative anode materials, zinc oxide (ZnO) stands out from versatile novel anode materials owing to its low cost, wide availability, and especially higher theoretical specific capacity (978 mA h g−1).8 Unfortunately, it suffers from low electrical conductivity, low lithium ion diffusivity, a large initial irreversible capacity loss and poor cycling stability caused by the large volume changes during lithiation/delithiation processes.9,10 To overcome these issues, some effective methods have been developed, including the fabrication of nanoscale materials (ZnO nanorods,11–14 nanoflowers,15,16 nanosponges,17 microspheres,18 nanotubes,19 nanofibers,20–22 nanowires,23 and nanosheets24,25), coating ZnO with other oxides,11,26–34 doping transition metal elements (Co,35–37 Fe,10,38–40 and Ge9) in ZnO matrices, preparation of ZnO–metal (Si,41 Cu,42 and Se43) composites, and preparation of carbon-based composites (ZnO–porous carbon,44–49 ZnO–carbon nanotubes,19,50,51 ZnO–carbon fibers,52,53 and ZnO–graphene54–60). In all the above methods, it is believed that hybridization of ZnO with carbonaceous materials can most effectively limit the growth of the ZnO particles and accommodate their volume change during Li-ion intercalation and deintercalation processes.
Graphene, as a novel two-dimensional carbon matrix, is preferable to hybridize with ZnO due to its marvelous properties such as high electrical conductivities, superior mechanical properties and large specific surface areas.61–63 When incorporated with other active materials as anodes for lithium ion batteries, graphene can enhance the electronic conductivity of the composite electrode and significantly limit the growth of particle sizes of active materials on the surface of graphene sheets, and serve as a buffer to alleviate the effects of volume expansion and contraction during charge–discharge cycling.64–68 Furthermore, our recent studies have suggested that metal oxide/graphene composites69 and zinc-based graphene composites70 display dramatically improved performance in terms of cycling stability and rate capability. Therefore, incorporation of graphene into ZnO is an effective way to improve the electrochemical properties of ZnO anodes.
Although all the above methods improve the electrochemical performance of ZnO anodes decently, the specific capacity and capability of the ZnO/graphene can still be further improved to meet the needs of the high-capacity and high-power energy storage devices. In particular, the desirable anodes should work at voltages below 1.0 V or even lower for practical use in full Li-ion cells (cathodes are traditional LiCoO2, LiMnO4, or Li–Mn–Ni–Co oxide materials). However to the best of our knowledge, no research work has been reported so far on the ZnO/graphene anode testing at voltages below 1.0 V which we believe needs to be done urgently.
Here in the current work, we report a simple, facile, and single-step hydrothermal fabrication of ZnO–graphene hybrid materials consisting of nanocrystal ZnO clusters anchored on electrically conductive graphene sheets. The significance of this work is that we for the first time, tested the electrochemical performance of ZnO–graphene anodes at different cut-off voltages, which is very valuable for their practical use in lithium-ion batteries. Graphene with a large surface area provides rich lithium-storage sites, large electrode/electrolyte interfaces for high lithium ion flux across and absorption/desorption on the interfaces, and reduced paths both for Li+ and electron diffusion. Moreover, the typical structure of graphene sheets provides an additional free volume to alleviate the structural strain associated with repeated Li+ intercalation/deintercalation processes to some extent, thus leading to enhanced cycling ability even at large current rates.
2. Experimental section
2.1. Chemicals and reagents
KMnO4, concentrated H2SO4 (98 wt%), aqueous HCl (3 wt%), H2O2 (30 wt%), aqueous ammonia (25 wt%), Zn(Ac)2·2H2O, and graphite were purchased from Tianjin Kewei Corporation, China. Acetylene black (AB) was purchased from Denka, Japan. Polyvinylidene fluoride (PVDF) was purchased from Kureha America Corporation, USA. N-Methyl-2-pyrrolidone (NMP, anhydrous, 99.5 wt%) was purchased from Sigma-Aldrich Corporation, USA. The separator (Celgard 2400) was obtained from Celgard Corporation, USA. The lithium-ion electrolyte was purchased from BASF Corporation, USA, including 1.2 mol L−1 LiPF6 in ethylene carbonate, and diethyl carbonate (EC/DEC = 3/7 w/w) containing 30 wt% fluoroethylene carbonate (FEC). Lithium foil was purchased from FMC-Lithium Corporation, USA. All the reagents and chemicals were used without further purification.2.2. Synthesis of the ZnO–graphene hybrid material
0.2, 1.0, and 1.8 g graphene oxide (GO, the preparation of GO we have reported previously)71 were respectively added to 20 mL of deionized water and ultrasonically dispersed for 30 min (KQ2200DE, Kunshan Ultrasonic Instruments Corporation, China) to obtain three GO dispersions. Then 0.2 g of Zn(Ac)2·2H2O (0.92 mmol) was added to each of the GO dispersions and stirred for 10 min. Meanwhile, aqueous ammonia (25 wt%) was added dropwise slowly into the mixed solution until the pH was between 9.0 and 10.0. The mixtures were then stirred continuously for 30 min. After that, 20 mL of the above mixtures were respectively transferred to a Teflon-lined stainless steel autoclave. Heating was performed at 180 °C for 12 h under autogenous pressure, followed by cooling by natural convection to room temperature. The precipitates were collected by centrifugation and washed thoroughly with alcohol and deionized water several times. Finally, the as-prepared material was dried at 80 °C under vacuum overnight. For experimental comparison, a blank ZnO material was prepared following the same procedure but without the addition of GO. For convenience, the samples prepared with low, middle, and high GO contents of 0.2, 1.0, and 1.8 g are labeled ZnO–LG, ZnO–MG, and ZnO–HG, respectively. The actual graphene weight ratios in the ZnO–graphene hybrid materials were estimated from the results of thermogravimetric analysis (TGA).2.3. Material characterization
Thermogravimetric analysis (TGA) was performed under oxygen using a TGA Q600 system (TA Instruments, USA). The sample was heated from room temperature to 800 °C at a ramp rate of 10 °C min−1. X-ray diffraction (XRD) measurements were taken on a Bruker D8A X-ray diffractometer (Bruker, Germany) using CuKα radiation (λ = 0.154 nm). Fourier transform infrared (FTIR) spectra were obtained on a Nicolet IR200 automatic infrared (FTIR) spectrometer (Thermo, USA). Raman measurements were performed on an inVia Raman microscope (Renishaw, England) with the excitation of a 514 nm laser beam. N2 adsorption–desorption isotherms were collected at liquid nitrogen temperatures using a TriStar II 3020 surface area and porosity analyzer (Micromeritics Instrument Corporation, USA). The pore size distribution was determined by the Barrett–Joyner–Halenda (BJH) method. The morphologies of the materials were characterized using a field-emission scanning electron microscope (SEM, JSM-7500F at the National Center for Electron Microscopy at Lawrence Berkeley National Laboratory) and a transmission electron microscope (TEM, FEI Tecnai G2 F20, Philips, Eindhoven, Nertherlands). The XPS measurements were performed on an X-ray photoelectron spectrometer (PHI-5000, USA) using a monochromatic AlKα (1486.7 eV) source at a voltage of 15 kV and an emission current of 10 mA.2.4. Electrode fabrication and cell assembly
The as-prepared ZnO–graphene composites were used as anode materials for lithium ion batteries. In detail, PVDF was first dissolved in NMP. Upon complete dissolution, the ZnO–graphene composites and AB were added to the binder–solvent solution. The weight ratio of ZnO–graphene, AB, and PVDF was set at 80![[thin space (1/6-em)]](https://www.rsc.org/images/entities/char_2009.gif) :10:10. The mixture was subject to mechanical stirring for 2 h to form a uniform slurry. The slurry was then coated on a 18 μm-thick battery grade copper sheet using a Mitutoyo doctor blade and an Elcometer motorized film applicator. After the NMP dried off, the electrode laminate was further dried in a vacuum at 50 °C overnight. The specific capacity of the electrode is based on the total mass of the ZnO–graphene composite. The typical mass loading of the active material was about 1.5 mg cm−2 of ZnO–graphene.
:10:10. The mixture was subject to mechanical stirring for 2 h to form a uniform slurry. The slurry was then coated on a 18 μm-thick battery grade copper sheet using a Mitutoyo doctor blade and an Elcometer motorized film applicator. After the NMP dried off, the electrode laminate was further dried in a vacuum at 50 °C overnight. The specific capacity of the electrode is based on the total mass of the ZnO–graphene composite. The typical mass loading of the active material was about 1.5 mg cm−2 of ZnO–graphene.
2325-type coin cells (parts from National Research Council of Canada) were assembled in an argon-filled glovebox with an oxygen concentration of 0.1 ppm and a dew point of −70 °C. The ZnO–graphene electrode was punched to 9/16′′ OD and the counter electrode was a lithium metal disk of 11/16′′ OD. A polypropylene film (Celgard 2400) separator and 1.2 mol L−1 LiPF6 in 3:7 EC/DEC (by weight) containing 30 wt% FEC.
2.5. Cell testing
Galvanostatic cycling tests were performed on a Maccor Series 4000 Battery Test System in a thermal chamber at 30 °C. The cut-off potential of cell testing was set at 0.01 V to 1.0, 1.5, 2.0, 2.5, and 3.0 V. Cyclic voltammetry (CV) test was performed on a VMP galvanostat/potentiostat workstation (Bio-Logic Corporation, USA) at a scan rate of 0.02 mV s−1 at a potential interval between 0.01 and 3.0 V. Electrochemical impedance spectroscopy (EIS) was also conducted on a VMP workstation in the frequency range of 100 kHz to 10 mHz. Cells were cycled at a current density of 100 mA g−1 for the 1st cycle, then brought to half lithiation for the 2nd cycle and allowed to stand for 4 h before EIS measurements were carried out.3. Results and discussion
The preparation process of ZnO–graphene hybrids is illustrated in Fig. 1. The ZnO–graphene hybrid structures are synthesised via a hydrothermal method using zinc acetate as the zinc source material. First, the surface of GO sheets was negatively charged by adjusting the pH of the solution to 9–10. Then the positive Zn2+ in the solution bonded with the negative oxygen-containing group on the surface of the GO sheets via van der Waals forces. During the hydrothermal synthesis, the ZnO nanoparticles were formed on the surfaces of graphene layers. In the whole preparation process, the graphene sheets provide the ZnO nucleation sites, resulting in the formation of a uniform dispersion of nanosized ZnO particles on their surface. This is because the graphene sheets effectively prevent the aggregation of ZnO nanoparticles. Meanwhile, the excellent electrical conductivity of graphene sheets benefits the conversion of the ZnO particles. From the photos of ZnO and ZnO–graphene samples in the lower left corner of Fig. 1, it can be observed that the pure ZnO sample is white in color, however, with the addition of GO, the color of the ZnO–graphene becomes dark black.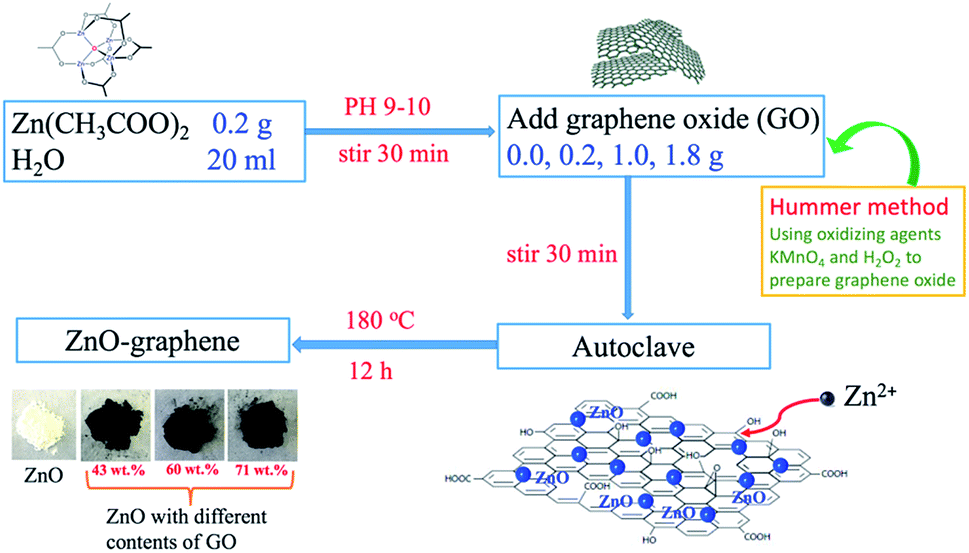 | ||
| Fig. 1 Mechanism of the preparation of the ZnO–graphene hybrid materials by hydrothermal synthesis. | ||
To quantify the amount of graphene or GO in the ZnO–graphene hybrids, TGA was carried out under oxygen. As indicated by TGA curves in Fig. 2a, the weight loss observed below 250 °C most likely corresponds to the loss of water which is desorption of physically absorbed water on the materials. The weight loss between 250 and 550 °C is attributed to the removal of carbon-containing groups of GO or graphene sheets (see Fig. S1 in theESI,† TGA of graphene oxide under oxygen at a rate of 10 °C min−1). And as the fraction of graphene in the hybrids increases, the amount of weight loss increases. However, there is no weight loss in this temperature range for the pure ZnO. Accordingly, the weight of graphene or GO in the ZnO–graphene hybrid is equal to the total weight loss minus the fraction of absorbed water. Correspondingly, the calculated weights of graphene in the final hybrid composites are 43.08 wt% (ZnO–LG), 60.11 wt% (ZnO–MG), and 71.45 wt% (ZnO–HG), respectively. A comparison of the estimates from the TGA with the measured amounts of graphene in the composites is provided in Table 1.
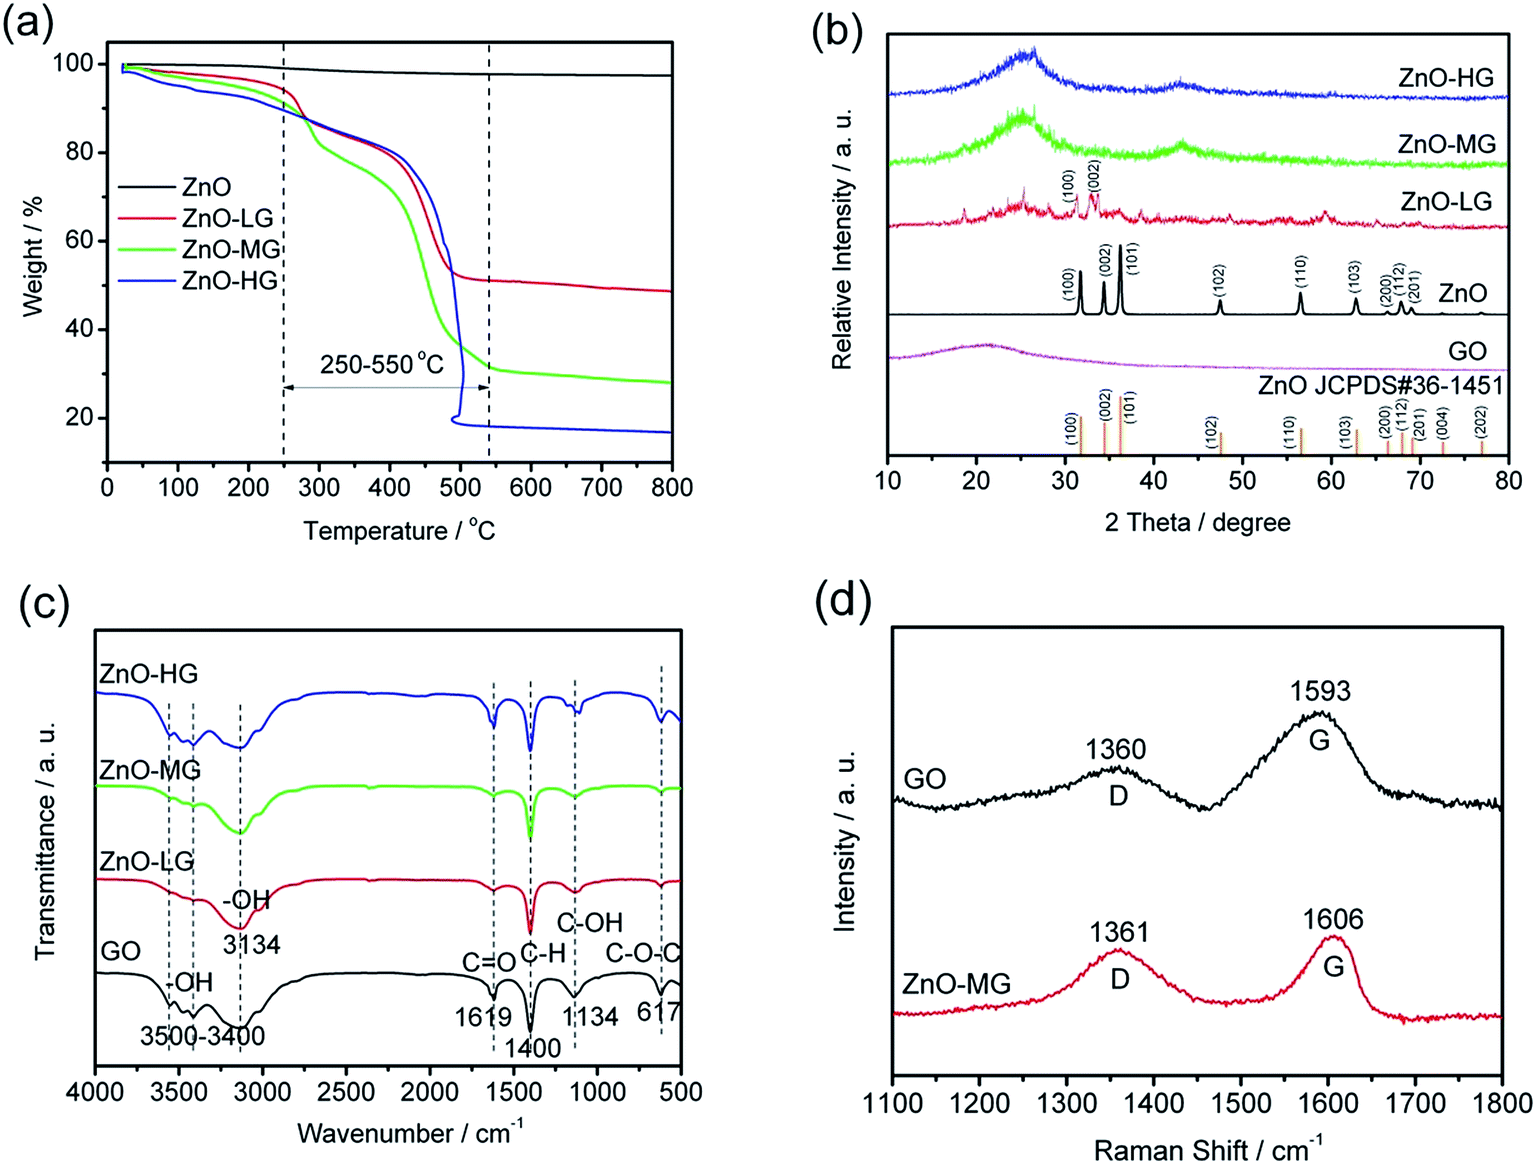 | ||
| Fig. 2 Characteristics of the ZnO and ZnO–graphene hybrid materials: (a) TGA curves in oxygen at a heating rate of 10 °C min−1; (b) XRD patterns; (c) FTIR spectra; (d) Raman spectra. | ||
| Samples | GO contents (in preparation)/mg | Graphene contents (in final products)/wt% |
|---|---|---|
| ZnO | 0.0 | 0.00 |
| ZnO–LG | 0.2 | 43.08 |
| ZnO–MG | 1.0 | 61.11 |
| ZnO–HG | 1.8 | 71.45 |
The XRD patterns of the pure ZnO and ZnO–graphene hybrids with different weights of graphene are shown in Fig. 2b. The diffraction peaks in the XRD pattern of pure ZnO are indexed to the hexagonal wurtzite structure (JCPDS#36-1451). There is no distinct peak in the XRD pattern of GO, which indicates a low crystallized or amorphous structure. With the increasing of the graphene weight in ZnO–graphene composites, the XRD peaks become broad, from a low crystallization (ZnO–LG) to amorphous structure (ZnO–MG, and ZnO–HG), which indicates the nanocrystallinity of ZnO in these hybrid composites. There is no characteristic peak corresponding to GO in those composites, which is probably because of the unstacked exfoliated graphene sheets.
The FTIR spectra of GO, ZnO–LG, ZnO–MG, and ZnO–HG composites are shown in Fig. 2c. For the GO sample, the strong and broad absorption peak located at around 3500–3400 cm−1 can be assigned to the stretching vibrations of the –OH bond.71 The peaks at 1619 and 1134 cm−1 are attributed to the characteristic stretching vibrations of C![[double bond, length as m-dash]](https://www.rsc.org/images/entities/char_e001.gif) O, C–OH, and epoxide C–O–C.72,73 The absorption peaks at around 617 cm−1 are due to the epoxide groups situated at the edge of the GO sheets.74 However for the ZnO–LG, ZnO–MG, and ZnO–HG composites, the absorption peaks at 3134 and 1400 cm−1 are respectively attributed to the stretching vibration of –OH and C–H bonds. Compared with the absorption peaks of GO, there are no CO and epoxide C–O–C peaks in the ZnO with low weights of graphene (ZnO–LG and ZnO–MG), and decreased intensity of absorption peaks of them in the ZnO with a high weight of graphene (ZnO–HG). This indicates that the hydrothermal reaction process has removed most of the oxygen containing groups from GO, and the majority of GO has been reduced to graphene during the hydrothermal reduction.
O, C–OH, and epoxide C–O–C.72,73 The absorption peaks at around 617 cm−1 are due to the epoxide groups situated at the edge of the GO sheets.74 However for the ZnO–LG, ZnO–MG, and ZnO–HG composites, the absorption peaks at 3134 and 1400 cm−1 are respectively attributed to the stretching vibration of –OH and C–H bonds. Compared with the absorption peaks of GO, there are no CO and epoxide C–O–C peaks in the ZnO with low weights of graphene (ZnO–LG and ZnO–MG), and decreased intensity of absorption peaks of them in the ZnO with a high weight of graphene (ZnO–HG). This indicates that the hydrothermal reaction process has removed most of the oxygen containing groups from GO, and the majority of GO has been reduced to graphene during the hydrothermal reduction.
The Raman spectra of GO and ZnO–MG are shown in Fig. 2d. The ZnO–MG exhibits two characteristic bands: the G band at 1606 cm−1, and the D band at 1361 cm−1; while the GO shows the G band at 1593 cm−1 and D band at 1360 cm−1. It is known that the G band is the response of the in-plane stretching motion of the symmetric sp2 C–C bond, whereas the D band results from the disruption of the symmetrical hexagonal graphitic lattice.75,76 Compared with GO, the ZnO–MG displays an increase in ID/IG (1.5134 vs. 0.8606), which is regarded as a decrease in the size of sp2 domains upon reduction and interaction between ZnO and the graphene sheets.
The porosity of the ZnO and ZnO–graphene composites was estimated by N2 adsorption–desorption analysis, as shown in Fig. 3a. All the samples demonstrate no hysteresis loop in the relative pressure range of 0.8 to 1.0, which suggests that the materials have homogeneous pores.77,78 The pore size distribution curves of the ZnO and ZnO–graphene composites, calculated from the adsorption branch by the BJH method, are shown in Fig. 3b. The BET surface areas of the samples are shown in Table 2. Both the BET surface area and the BJH adsorption average pore size of the ZnO–graphene composites are larger than those of the pure ZnO, which indicates that the ZnO–graphene composites can provide larger interfaces to enhance the contact between the electrolyte and the active material, resulting in facilitating the charge transfer of lithium ion intercalation and deintercalation. The increased BET surface area and average pore size are attributed to the amount of graphene added in the preparation process. There are a lot of defects and porous structure on the rough surface of graphene sheets in the samples of ZnO–graphene hybrid materials, which leads to a higher surface area compared with that of pure ZnO material.79 Among the three ZnO–graphene composites, the ZnO–HG has the largest pore size, which further benefits the Li+ intercalation and deintercalation processes.
 | ||
| Fig. 3 (a) N2 adsorption and desorption isotherms of the ZnO and ZnO–graphene hybrid materials; (b) BJH pore-size distribution plots. | ||
| Samples | BET surface area/m2 g−1 | BJH adsorption average pore diameter/nm |
|---|---|---|
| ZnO | 4.56 | 15.49 |
| ZnO–LG | 9.11 | 20.53 |
| ZnO–MG | 14.32 | 22.34 |
| ZnO–HG | 23.76 | 27.36 |
The morphologies of the ZnO and ZnO–graphene hybrids were characterized by SEM with the images shown in Fig. 4. As for the pure ZnO (Fig. 4a), the synthesized product mainly consists of irregular rod-shaped crystal structures. The lengths of the ZnO rods are generated in a size range from 1 to 5 μm with their diameters varying within 250–900 nm. Fig. 4b–d give the SEM images of ZnO–graphene hybrids with different graphene contents. It is seen that the ZnO particles are well dispersed on the surface of the graphene sheets or wrapped by the graphene sheets. With the increase in graphene contents, the amount of ZnO particles gets less and the particle sizes decrease to the nanoscale. This indicates that the transformation of the morphology from pure ZnO micrometer rods to nanoparticles in the ZnO–graphene composites may be ascribed to the existence of graphene sheets. The graphene sheets increase the number of nucleation sites for ZnO which leads to the formation of ZnO nanoparticles. Meanwhile, the dispersion of ZnO nanoparticles hinders the collapse and restacking of graphene sheets during the hydrothermal reduction process. In detail, the ZnO particles tightly cover the entire surface of the graphene sheets, which indicates a good interfacial contact between the ZnO particles and the two-dimensional graphene sheets. To confirm its elemental information, the corresponding element energy diffraction spectrum (EDS) mapping of ZnO–MG is revealed in Fig. 4e–h, from which the uniform distribution of Zn, C and O elements can be observed clearly. This further confirms that the ZnO particles are uniformly anchored on the graphene sheets in the hybrid composites, and two of them exhibit an intimate contact with each other. It is worth pointing out that the intimate contact of the different components in the composites plays a key role in obtaining good electron and lithium ion transfer during charge and discharge cycling.
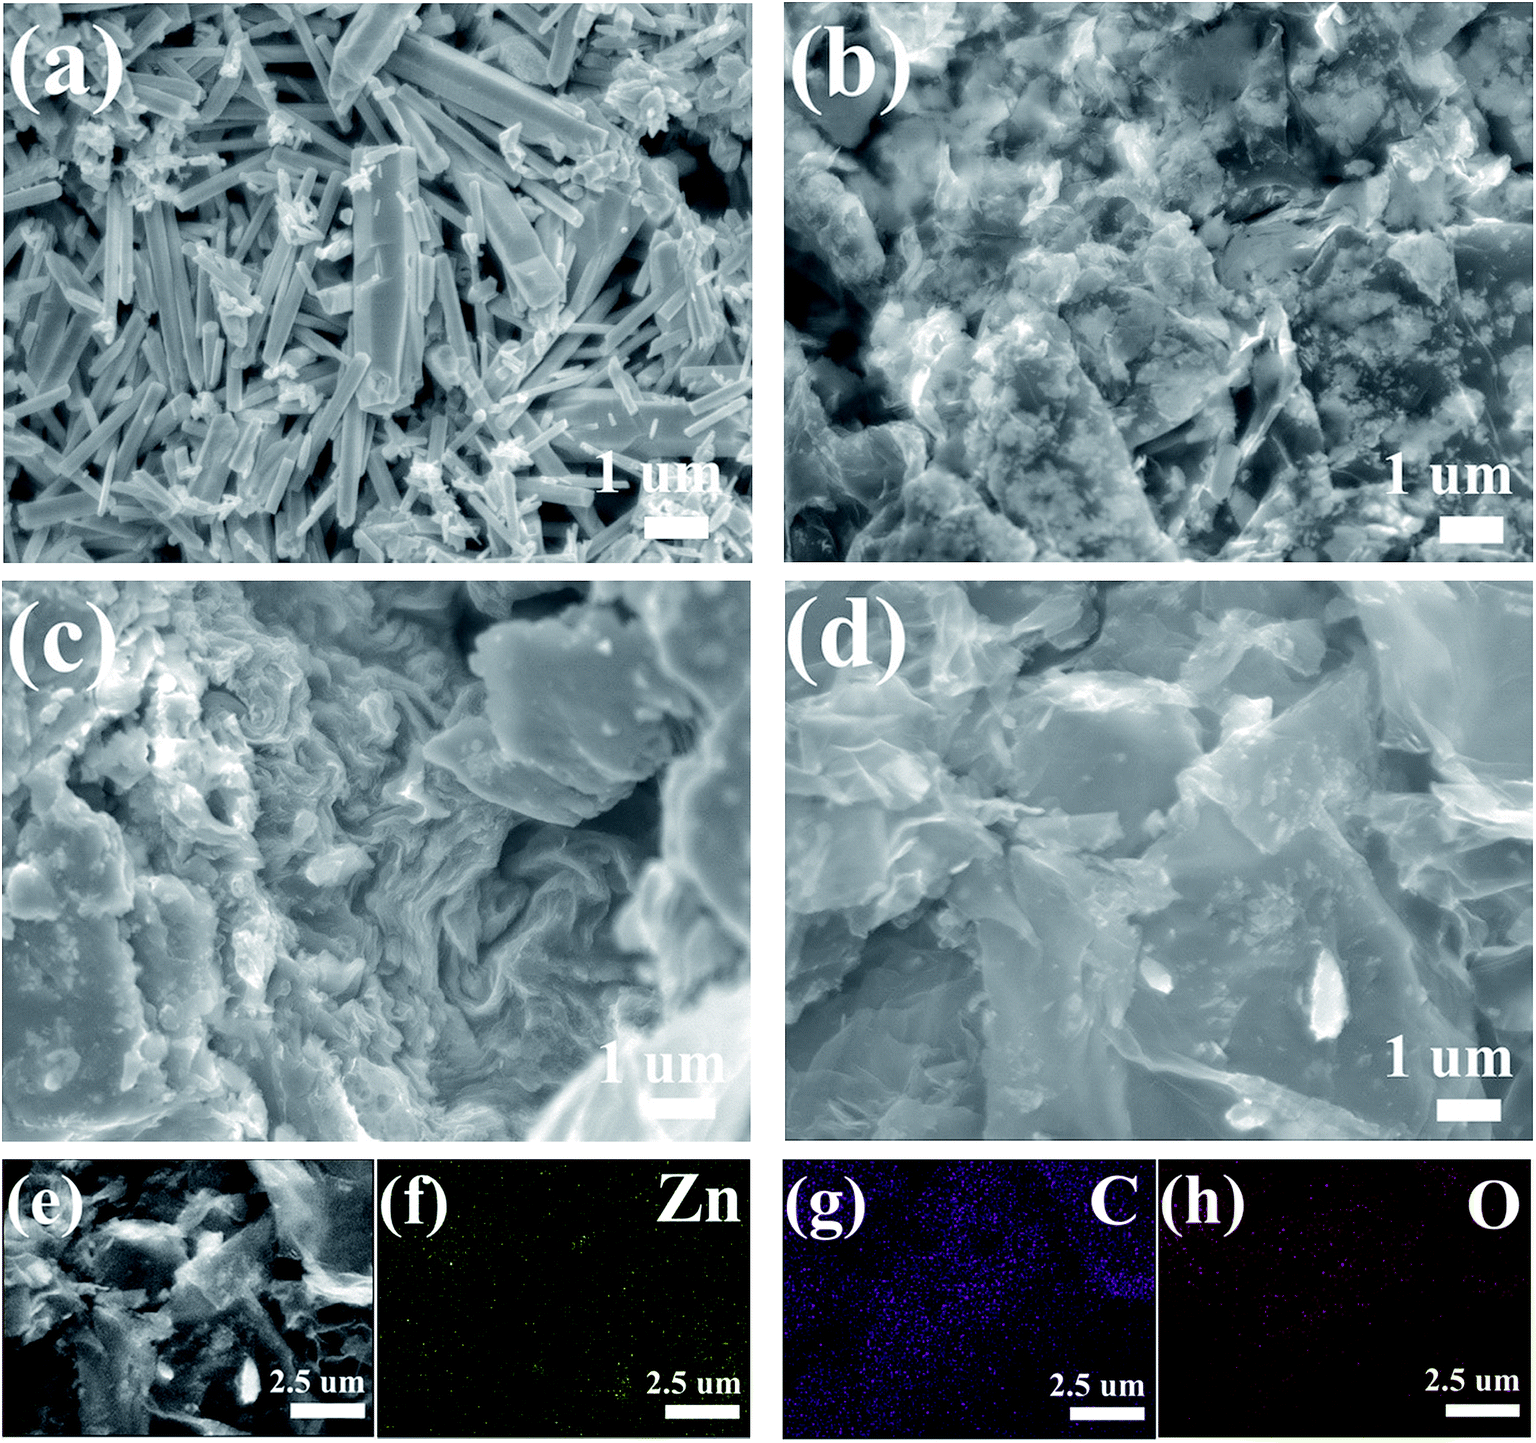 | ||
| Fig. 4 SEM images of the ZnO (a), ZnO–LG (b), ZnO–MG (c), and ZnO–HG (d), Zn–MG (e) and its elemental mapping of Zn (f), C (g), and O (h). | ||
To further characterize the microscopic morphology and structural information, high-resolution TEM analysis of the ZnO–MG hybrids was performed, as shown in Fig. 4. From the low-magnification TEM image (Fig. 5a), the two-dimensional structure of the graphene sheets with many waves and wrinkles is demonstrated, which reveals that the graphene has been well reduced in the hydrothermal process. In addition, the nanosized ZnO particles are distinguished and tightly dispersed on the surface of the graphene sheets (Fig. 5b), which is consistent with the results of SEM observation and elemental mapping. From the high-magnification TEM image (Fig. 5c), a large number of embedded crystal lattices can be clearly observed. The marked interplanar distance (0.25 nm) corresponds to the (101) lattice planes of hexagonal wurtzite ZnO, while the surrounding phase shows a lattice spacing of 0.34 nm, corresponding to the d spacing of the (002) planes of graphite. The result strongly confirms that the ZnO particles anchor on the graphene sheets with a strong interaction between them. The selected area electron diffraction (SAED) pattern in Fig. 5d shows prominent reflection rings which are attributed to (100), (102), and (101) planes for wurtzite-type ZnO, further confirming the ZnO nanocrystals on the graphene sheets.
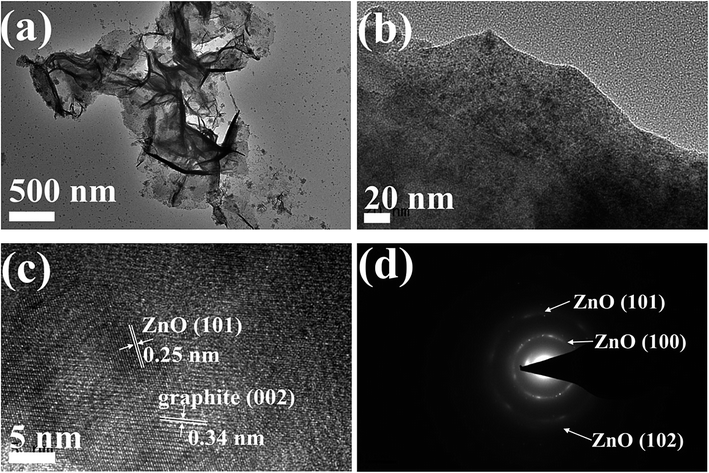 | ||
| Fig. 5 Low-magnification TEM images (a and b), high-resolution TEM image (c), and SAED pattern (d) of the ZnO–MG. | ||
XPS measurements were carried out to further identify the chemical status of the ZnO–graphene hybrids, as shown in Fig. 6. Fig. 6a provides the XPS survey spectra of the ZnO–MG sample in which the peaks of Zn2p, O1s, and C1s can be clearly observed. As shown in Fig. 6b, the C1s spectrum of the sample exhibits three peaks that correspond to carbon atoms in different functional groups. The independent peaks with binding energies of 283.9, 284.9, and 289.0 eV are attributed to the extensively delocalized sp2-hybridized C–C, C–O, and O–CO groups, respectively,65 which reveals that the oxygen-containing groups have not been completely removed from the GO during hydrothermal synthesis. The Zn2p3 spectrum of ZnO–MG, as shown in Fig. 6c, displays characteristic peaks at 1022.2 and 1045.3 eV corresponding to the Zn2p3/2 and Zn2p1/2 spin orbits of the ZnO phase. Their binding energies are close to the reference values.19,80 As for the O1s spectrum of ZnO–MG hybrids, there are two peaks shown in Fig. 6d, which reveals two kinds of O species in the composites. The peak with the lower binding energy of 532.0 eV corresponds to O2− in normal wurtzite ZnO single crystals, whereas the peak with the higher binding energy of 532.0 eV can be assigned to the oxygen in C–OH/C–O–C on the surfaces of the graphene sheets in the ZnO–MG composite.81 As XPS analysis provides elemental information only at the surface depth <5 nm,21 the above results from the high resolution XPS spectra demonstrated the formation of ZnO at the surface of the graphene sheets. Combined with the results of SEM and TEM, we can confirm that most of the oxygen-containing groups of GO have been removed during the hydrothermal reduction process and the ZnO particles are formed on the surface of graphene simultaneously.
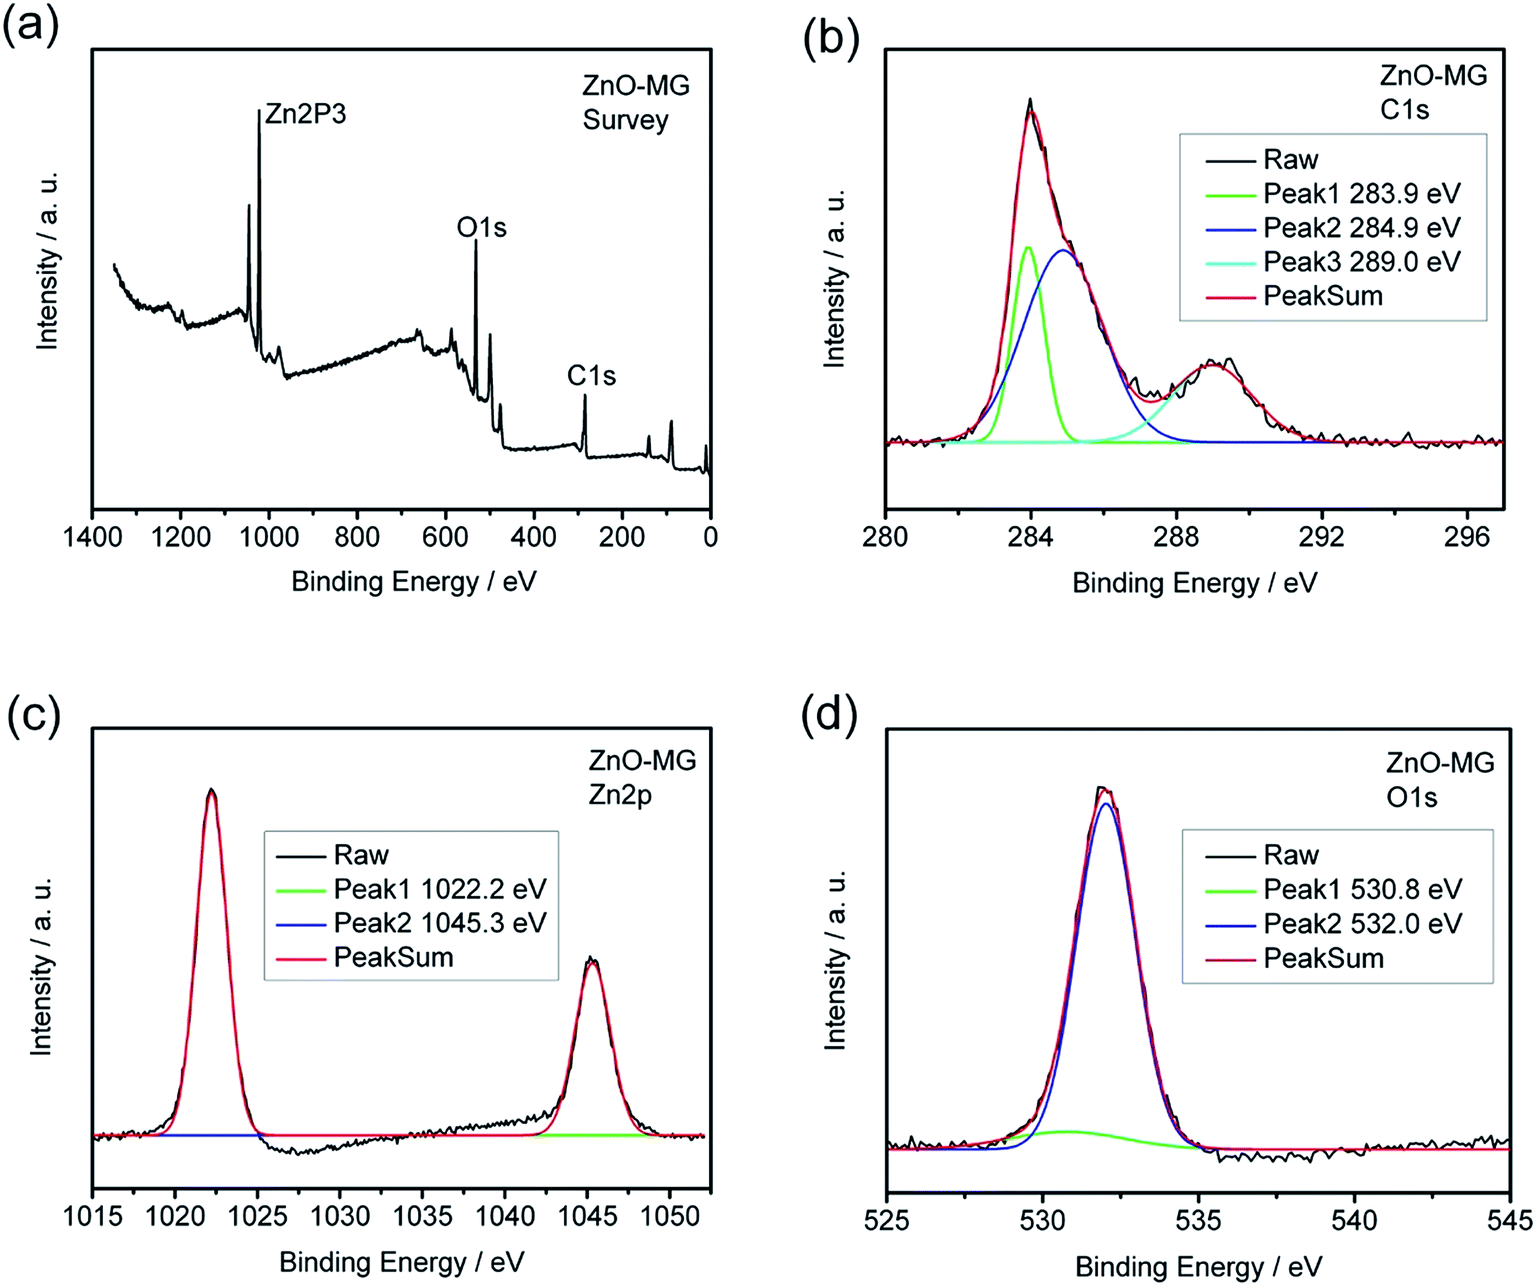 | ||
| Fig. 6 XPS spectra of the ZnO–MG composite (a) survey; (b) C1s; (c) Zn2p; (d) O1s. | ||
Fig. 7a shows the cycle performances of the pure ZnO, ZnO–graphene, and GO anodes at a charge and discharge current density of 100 mA g−1 with a cut-off voltage of 0.01–3.0 V. After 100 charge and discharge cycles, the specific delithiation capacities of the ZnO–graphene hybrid anodes in the order of increasing graphene remain at 327.93, 489.20, and 749.20 mA h g−1. The cycle stability of the pure ZnO anode is less satisfactory, as the delithiation capacity drops to 104.88 mA h g−1 at the 100th cycle. This indicates that the addition of graphene clearly improves the cycle stability of the ZnO–graphene hybrid anodes. The ZnO–graphene anodes show outstanding performance, among which, the ZnO–HG anode exhibits the best cycle stability and reversible capacity. From the 1st to 5th cycles, the delithiation capacity decay of the ZnO–LG anode is an astonishing 61.34% lower than that of the pure ZnO anode over the same cycle range. The total capacity retention from the 1st cycle to the 100th cycle of the ZnO–HG is 55.69% much higher than that of the pure ZnO. The excellent cycle stability of the ZnO–graphene hybrid anodes is attributed to the graphene in the hybrids which not only acts as an alleviation buffer for preventing the electrode structure from collapsing, but also as a provider of uninterrupted electronic conduction during Li+ intercalation and deintercalation processes.
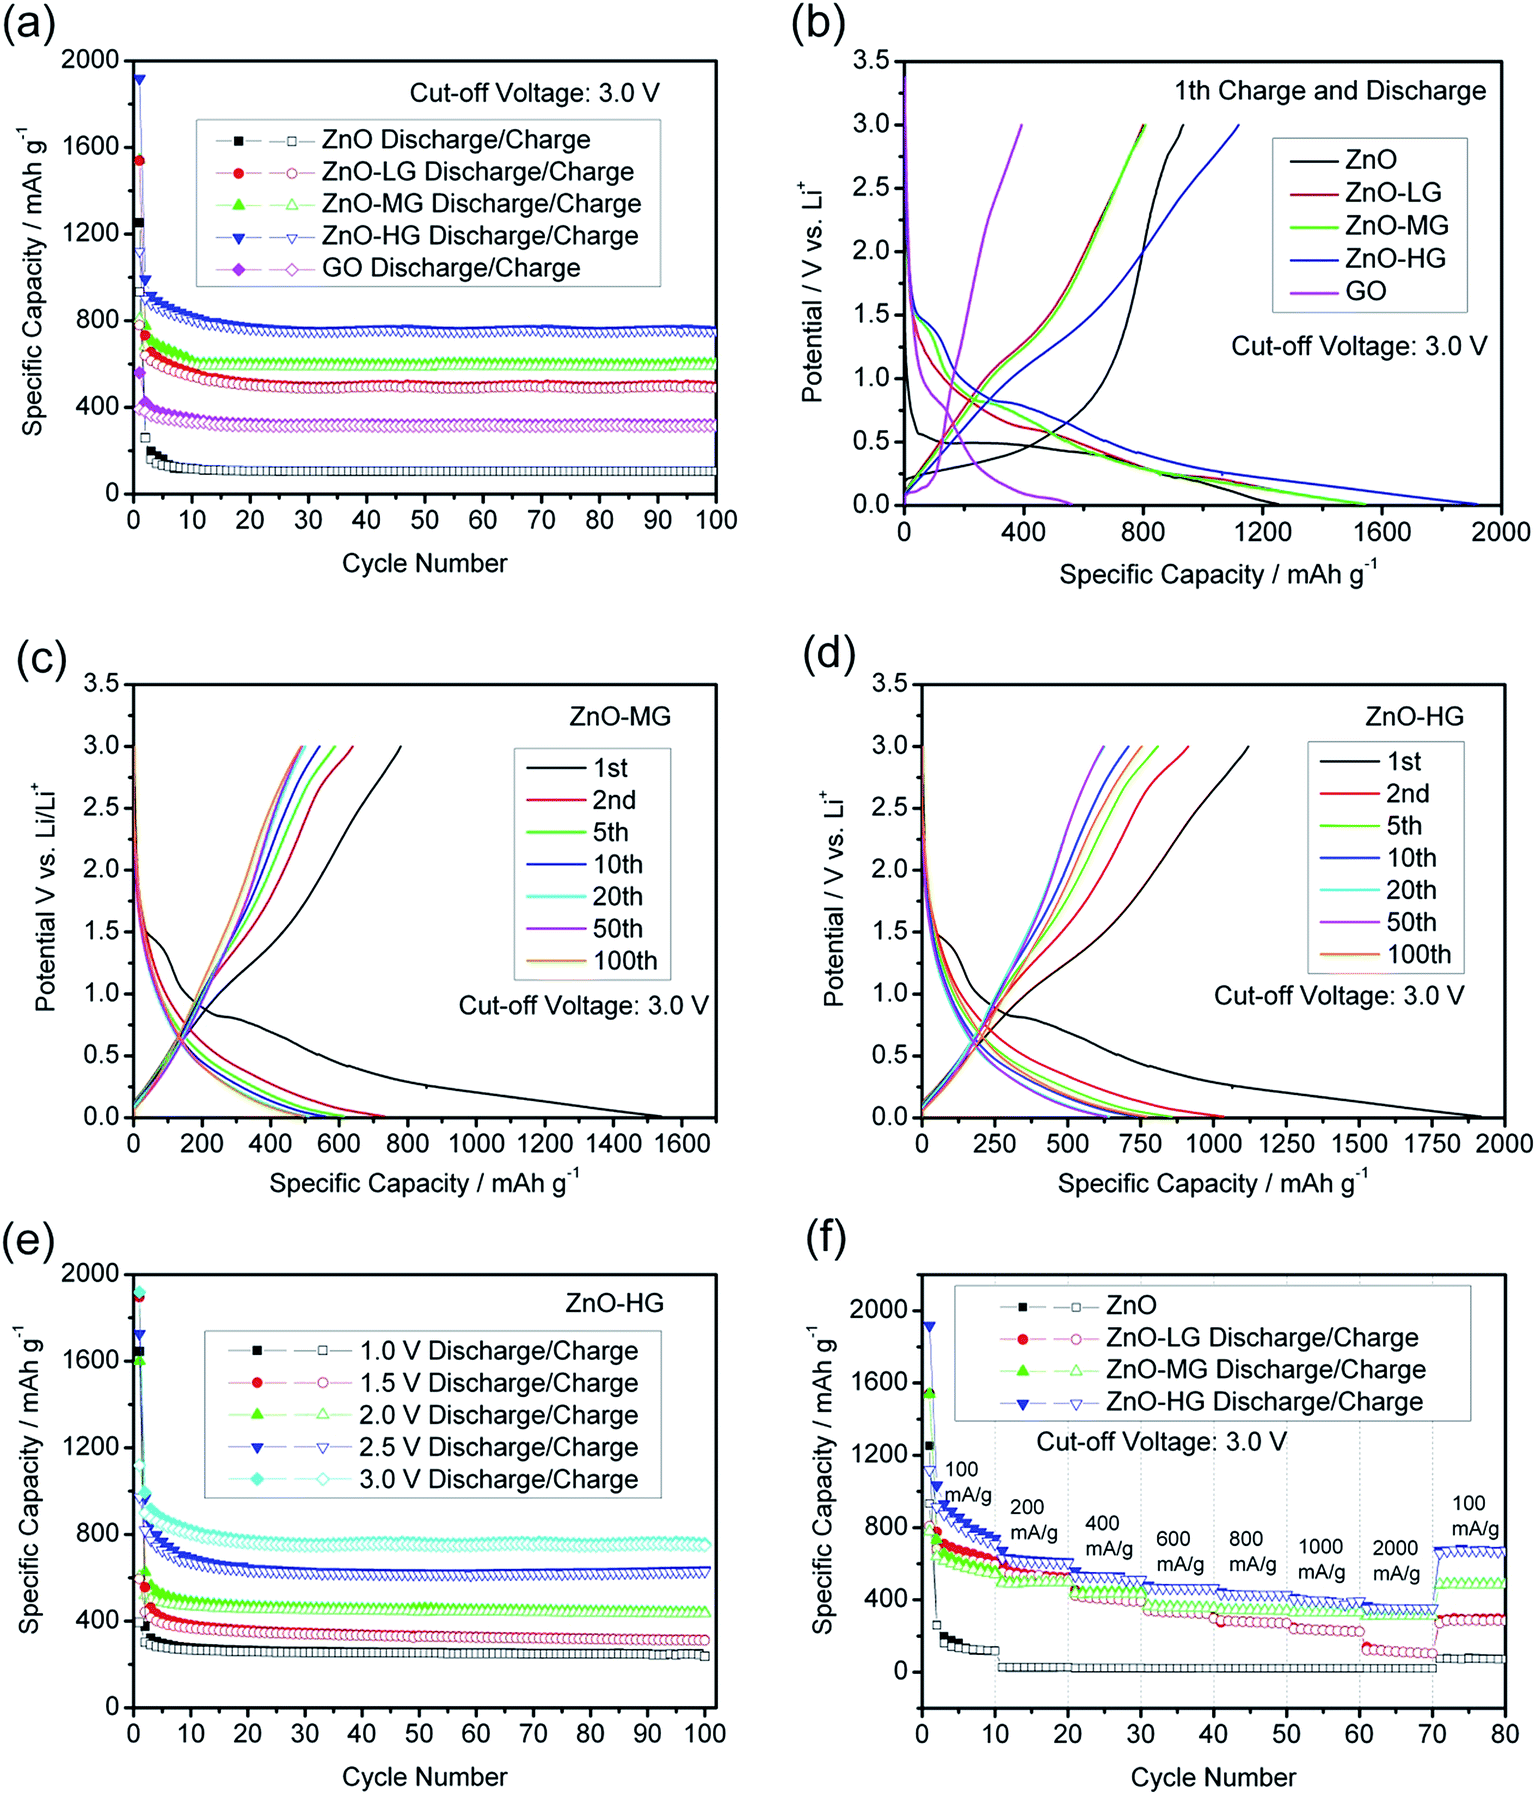 | ||
| Fig. 7 (a) Cycle performances of the ZnO, ZnO–graphene, and GO anodes at a current density of 100 mA g−1; (b) the specific capacity–potential curves of the first cycle for the ZnO, ZnO–graphene, and GO anodes at a current density of 100 mA g−1; (c) the specific capacity–potential curves of the ZnO–MG anode at different cycles; (d) the specific capacity–potential curves of the ZnO–HG anode at different cycles; (e) cycle performance of the ZnO–HG anode at a current density of 100 mA g−1 with the cut-off voltage of 0.01–1.0, 1.5, 2.0, 2.5, and 3.0 V; (f) high-rate performances of the ZnO–graphene anodes compared with the ZnO anode at the charge–discharge current density of 100, 200, 400, 600, 800, 1000, and 2000 mA g−1. | ||
Fig. 7b shows the first cycle performance of the pure ZnO and ZnO–graphene hybrid anodes at a current density of 100 mA g−1 with the cut-off voltage of 0.01 to 3.0 V. As shown, the charge and discharge potential plateaus of the pure ZnO anode and ZnO–graphene anodes are significantly longer than those of GO anodes, which reflects that the most part of the first specific capacities of hybrid anodes comes from the ZnO component. Among the ZnO–graphene hybrid anodes, the ZnO–HG anode has the highest initial capacity which is about 20% greater than that of the pure ZnO.
Fig. 7c and d respectively show the specific capacity–potential curves of the ZnO–MG and ZnO–HG anodes at different cycles. In the first cycle, there are faint plateaus at about 1.0–1.5 V for both of the hybrid anodes. This may be attributed to the formation of the solid electrolyte interphase (SEI) which is a common exhibit in most of the carbon-based anodes.82 The SEI is formed by the reaction of the electrode material and the electrolyte, and usually occurs on the electrode surface in the first charge–discharge cycle, resulting in irreversible capacity.83 Except the first cycle, the curve shapes in the following cycles are almost similar, which become shorter and shorter with the increase in the number of cycles. This reflects the capacity decay with increasing cycles. In addition, the curves of both anodes display gentle slopes with no distinct voltage platform, which demonstrates the amorphous structures, consistent with their XRD patterns in Fig. 2b.
In lithium ion full cells, to obtain the available voltage gap between the cathode and anode, the anode must work at low voltages. Therefore, we tested the ZnO–graphene anodes under different cut-off voltages. Fig. 7e shows the cycle performance of the ZnO–HG anode under the same charge and discharge conditions with different cut-off voltages. The performances of ZnO–LG in Fig. S2a,† and ZnO–MG in Fig. S2b are shown in the ESI.† As shown in Fig. 7e, the specific reversible capacities of the ZnO–HG anode are approximately 200, 230, 250, 330, 490 mA h g−1 corresponding to the cut-off voltage range of 0.01 to 1.0, 1.5, 2.0, 2.5, and 3.0 V, respectively. This reveals that even at the low cut-off voltage of 0.01–1.0 V, the ZnO–HG anode can still deliver the reversible capacity of 240 mA h g−1, which is qualified for use as an anode material in Li-ion full cells.
Fig. 7f shows the high-rate performance of the pure ZnO and ZnO–graphene anodes at different current densities between the cut-off voltage of 0.01 and 3.0 V. As shown, the high-rate performances of ZnO–graphene anodes are better than that of pure ZnO anodes. Among them, the ZnO–HG anode has the best performance, delivering the highest capacity at each of the applied current densities of 100, 200, 400, 600, 800, 1000, and 2000 mA g−1, and shows good recovery of the first cycle capacity of around 671.23 mA h g−1 when the current rate was brought back to 100 mA h g−1. In contrast, the pure ZnO anode shows a less satisfactory capacity under the same charge and discharge rates, and is 8.5 times lower than that of the ZnO–MG anode. From these results, it is demonstrated that graphene addition greatly improves the high-rate capability of ZnO. This is because the graphene sheets in the hybrid materials have excellent electrical conductivity which can facilitate Li+ transportation during cycling under high-rate charge and discharge conditions.
The specific surface area is the key factor for the improvement of cycling stability and rate performance of the electrode materials. Accordingly, we normalize the specific capacity using the specific surface area to calculate the capacity value.84 As shown in Fig. S3 of the ESI,† the ZnO–LG sample shows the best cycle and rate performance with the normalized specific capacity (mA h m−2) among the three samples of ZnO–graphene materials. This indicates that the appropriate content of graphene in the hybrid material (ZnO–LG) can improve the specific capacity per area of the active material, while overload of graphene in the ZnO–HG material can cause the lower specific capacity per area because the large surface of graphene has lower energy density.
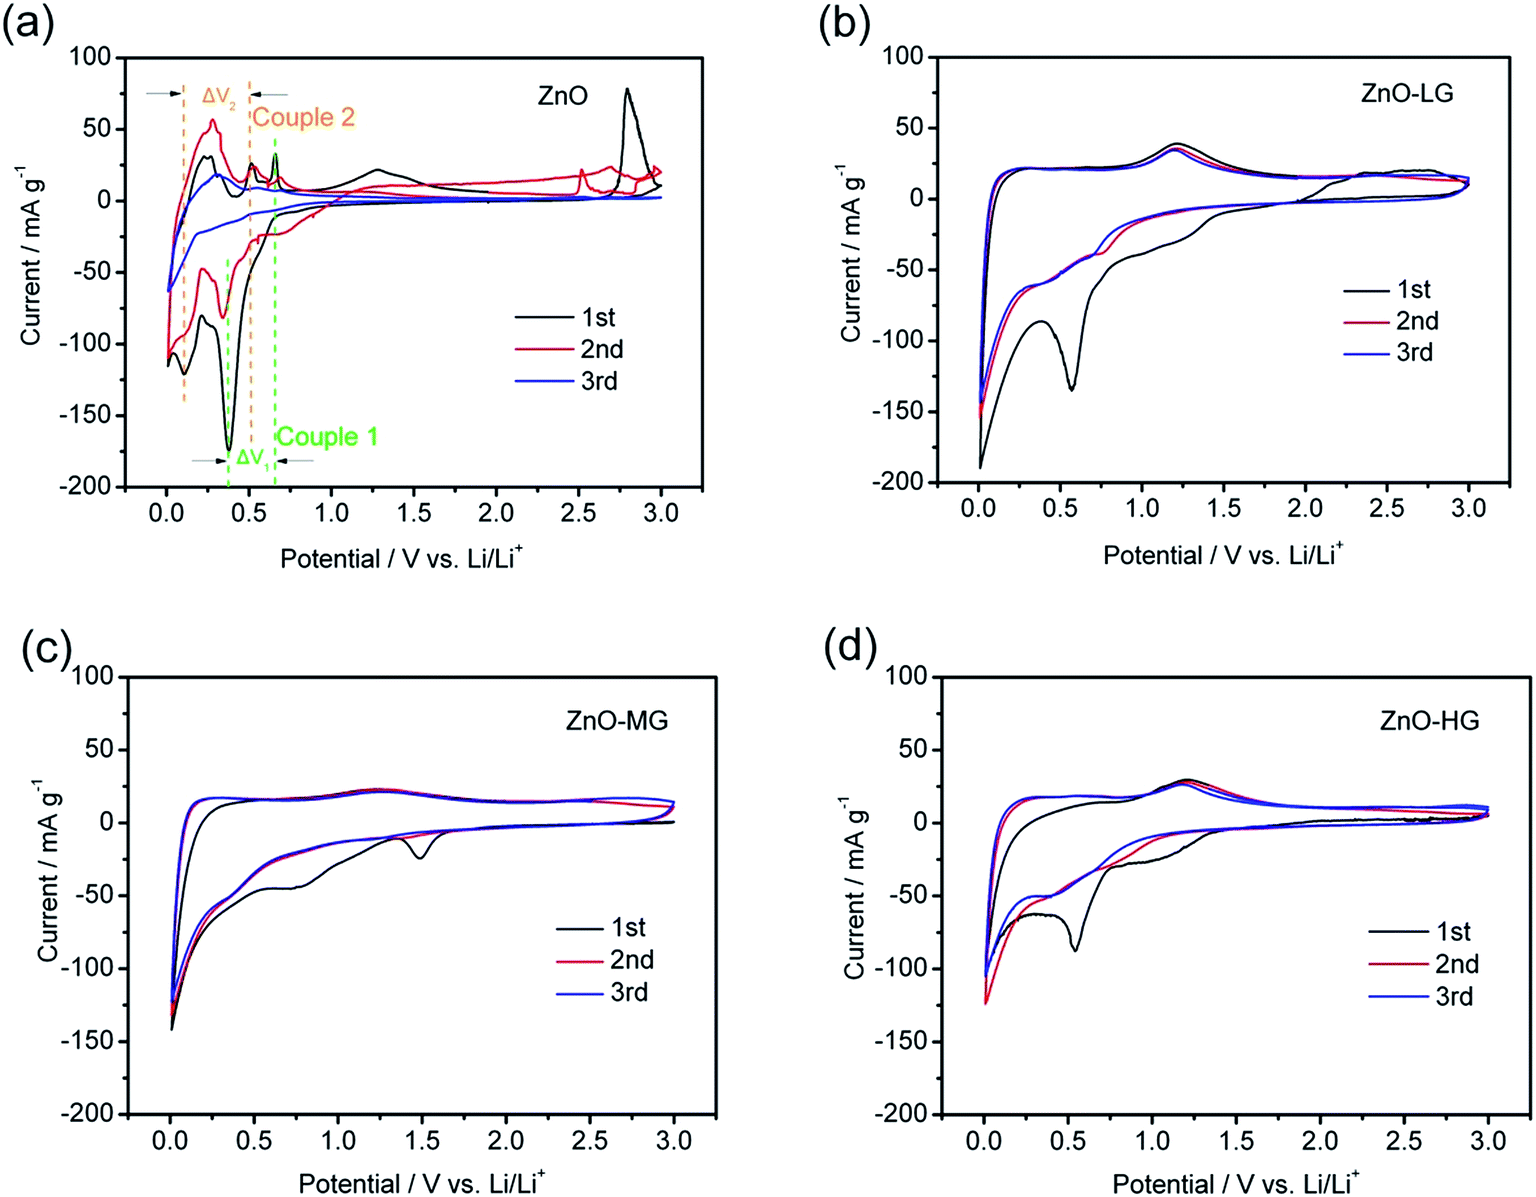
The cyclic voltammetry profiles of the pure ZnO and ZnO–graphene anodes at a scan rate of 0.02 mV s−1 for the first three scanned cycles are shown in Fig. 8. During the negative scan as shown in Fig. 8a, there are several cathodic peaks for all of the anodes, which appear below 0.8 V, and are related to the reduction or lithiation process of ZnO to metallic zinc and the further formation of Zn–Li alloys through multiple steps.17,36 During the positive scan, the anodic peaks of the pure ZnO (Fig. 8a) are observed in the range of 0.25 to 0.75 V, and a distinct peak at around 1.25 V, which correspond to the oxidation or delithiation process of Li–Zn alloys.18,46 The electrochemical lithiation/delithiation process of ZnO should proceed as illustrated in the following two steps:
| ZnO + 2Li ↔ Zn + Li2O |
| Zn + Li ↔ LiZn |
 | ||
| Fig. 8 Cyclic voltammetry curves of the ZnO (a), ZnO–LG (b), ZnO–MG (c), and ZnO–HG (d) anodes at a scan rate of 0.02 mV s−1 for the first three cycles. | ||
In the discharge process, at first Li+ inserts itself in ZnO to form Zn and Li2O; this is followed by the lithium ion inserting itself continuously and the formation of Li–Zn alloys. During charge, the process is reversed, the Li–Zn alloys decompose as the lithium ion de-inserts from it, and finally Zn from the Li–Zn alloy becomes ZnO. The discharge/charge (lithiation/delithiation) processes are reversible, as shown by two reversible chemical reactions.
In all four samples, the curve shapes of the first and second CV scanning have many more differences, which is attributed to the irreversible reaction involved in the formation of a solid electrolyte interface (SEI) layer, owing to the reductive decomposition of the electrolyte during the first scanning process.85 For the pure ZnO sample, it was easy to observe two pairs of redox peaks (indicated in Fig. 8a and Table 3 as Couple 1 and Couple 2). These peaks could be attributed to the transformation between the ZnO to metallic zinc and Zn–Li alloys. As shown in Fig. 8a, the intensity of the anodic and cathodic peaks of the pure ZnO anode gradually decreased during the subsequent cycles, which is probably because of the irreversible reactions during the cycling. As shown in Table 3, the ΔV1,2 of each redox couples are increasing, which indicates that it is an irreversible reaction. The capacity fading of this reaction is due to the polarization and restacking.86 While for the ZnO–graphene anodes (Fig. 8b–d), the anodic and cathodic peaks are not as intense as those of the pure ZnO peaks in the same voltage range, which is more like the CV graph of graphene (Fig. S4 of ESI†). This is because the ZnO particles are dispersed on the surface of graphene which prevents the agglomeration of the particles, leading to less electrode polarization during the electrochemical reaction. Therefore, by the interaction between the surface of the graphene and ZnO particles, the graphene in the hybrids improves the reversible properties of the electrochemical lithiation/delithiation process of the ZnO anode.
| Cycles | Couple 1 | ΔV1/V | Couple 2 | ΔV2/V |
|---|---|---|---|---|
| 1st | 0.38/0.65 V | 0.27 | 0.10/0.50 V | 0.40 |
| 2nd | 0.35/0.69 V | 0.34 | 0.09/0.53 V | 0.44 |
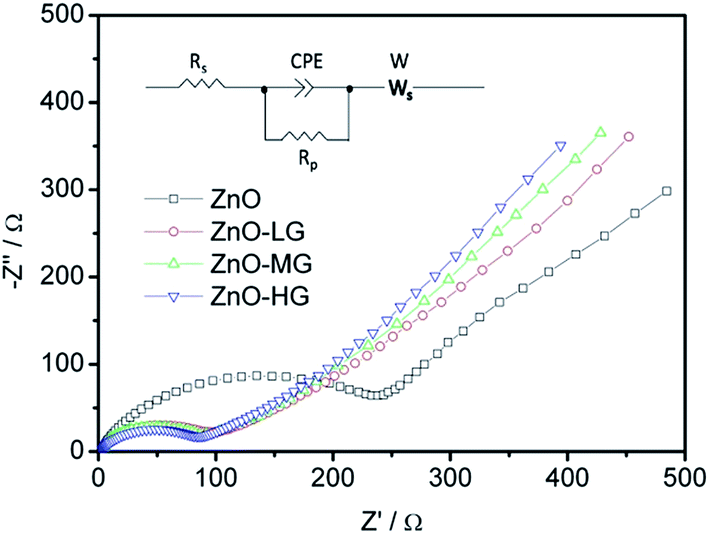
As shown in Fig. 9, EIS was carried out to evaluate the electrochemical kinetic properties of the pure ZnO and ZnO–graphene hybrid material, and their equivalent circuit for EIS data fitting. The Nyquist plots of all the electrodes consist of one semicircle and a straight line, which are associated with charge transfer and the solid state diffusion process of lithium ions in the electrode and are referred to as the Warburg region.87 The EIS data were fitted to an electrochemical model (the inserted graph in Fig. 9) using Zview module software. Rs at the high-frequency intercept on the real axis represents the bulk resistance depending on the electrolyte solution, active material, current collector and so on. Rp is the charge transfer resistance at the electrode–electrolyte interface, associated with the interface between the electrolyte and the active particles. CPE is the constant phase element, and represents the conventional double-layer and passivation film capacitance. Ws is the finite length Warburg impedance with a short circuit terminus.88–90Table 4 shows the EIS fitting results of the pure ZnO and ZnO–graphene anodes. No distinct difference exists in the Rs values of the four samples, which indicates that the cells have the same test conditions. The Rp values of the ZnO–graphene hybrid electrodes are smaller than that of the pure ZnO electrode, which indicates the higher electrochemical activity and better utilization of the electrodes. To further compare the lithium diffusion kinetics in the ZnO–graphene electrodes with that of the pure ZnO electrode, the lithium diffusion coefficient (DLi+) can be calculated using the following equation:45,52

 | ||
| Fig. 9 EIS Nyquist plots of experimental data of the ZnO and ZnO–graphene anodes (the inserted figure is the equivalent circuit for EIS data fitting). | ||
| Parameter | ZnO | ZnO–LG | ZnO–MG | ZnO–HG |
|---|---|---|---|---|
| R s/Ω | 2.93 | 2.58 | 2.56 | 2.47 |
| R p/Ω | 189.00 | 89.57 | 80.43 | 76.96 |
| CPE-T/μF | 48.30 | 47.10 | 39.30 | 35.50 |
| CPE-P/F | 0.82 | 0.70 | 0.71 | 0.72 |
| W-R/Ω | 6371 | 1423 | 1350 | 1286 |
| W-T/Ω | 134.2 | 142.9 | 148.7 | 154.6 |
| W-P/Ω | 0.48 | 0.44 | 0.45 | 0.45 |
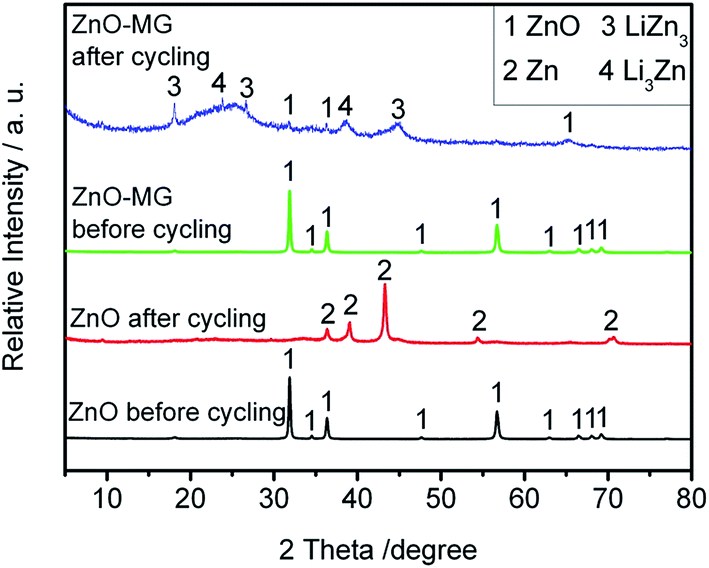
To investigate the possible capacity decay and structure evolution mechanism of the materials, XRD and SEM characterizations of the anodes before and after electrochemical testing were performed.91–93Fig. 10 shows the XRD patterns of the ZnO and ZnO–MG anodes before and after 100 charge/discharge cycles. From the XRD pattern before electrochemical cycling, it is observed that both the ZnO and the ZnO–MG anodes exhibit a pure ZnO crystal phase. However, there are many differences between them after 100 charge/discharge cycles. For the ZnO anode after cycling, the diffraction peaks can be indexed to the Zn phase, while for the ZnO–MG anode after cycling, the diffraction peaks are indexed to the ZnO and Zn–Li alloy (Li3Zn and LiZn3). According to the above discussed two steps of lithiation/delithiation process of ZnO, Zn is the intermediate product of the whole reversible electrochemical reaction. If the reaction stops in the first step, the capacity would be lower than when the reaction runs completely for the two steps. Hence, the ZnO–MG anode has more electrochemically active material for the reversible lithiation/delithiation process, resulting in stable cycle performance.
 | ||
| Fig. 10 XRD patterns of the ZnO and ZnO–MG anodes before and after 100 charge/discharge cycles. | ||
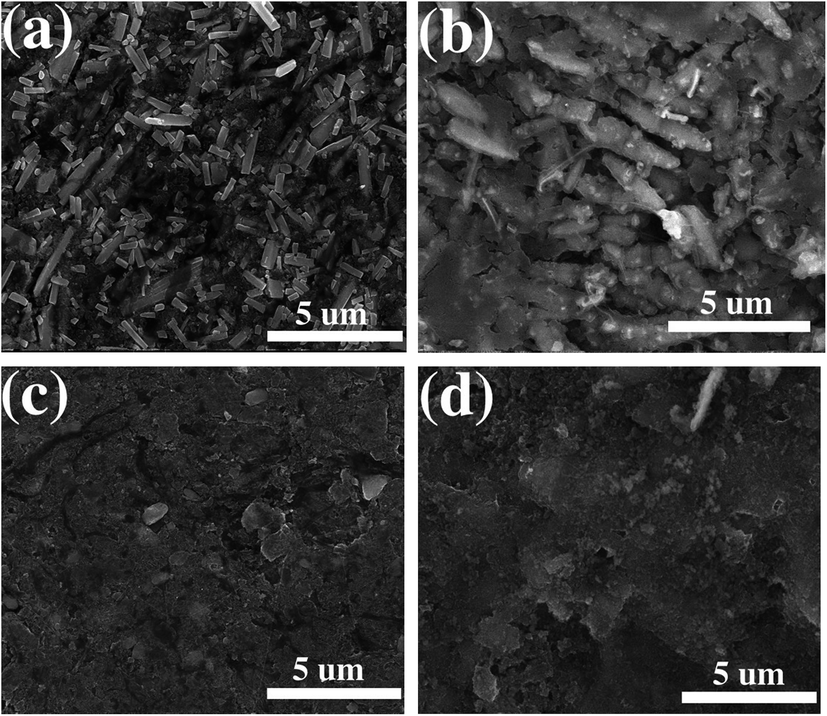
Fig. 11 shows the SEM images of the ZnO and ZnO–MG anode before and after 100 charge/discharge cycles. Before cycling, the ZnO particles are in tight contact with carbon black powder to form a homogenous and smooth electrode surface (Fig. 11a). After cycling, a thick SEI layer on the outside of ZnO particles can be observed clearly (Fig. 11b), which leads to the bad contact between ZnO and carbon black. This phenomenon results in the bad conductivity of the electrode, resulting in capacity decay. While for the ZnO–MG anode, there are no such big changes for the electrode before (Fig. 11c) and after cycling (Fig. 11d). The electrode structure is stable and well maintained after cycling, which maintains the good contact between the active material ZnO and the conductive materials (both carbon black and graphene layer can provide good conductivity). Therefore, the capacity decay of the ZnO–MG anode is lower than that of the ZnO anode.
 | ||
| Fig. 11 SEM images of the ZnO anode before (a) and after (b) 100 charge/discharge cycles; SEM images of the ZnO–MG anode before (c) and after (d) 100 charge/discharge cycles. | ||
Based on the above structural and electrochemical performance data, the excellent performances of ZnO–graphene hybrid anodes are attributed to the incorporation of graphene. The graphene plays an important role both in the synthesis and in the charge/discharge cycling. In the chemical preparation process, the graphene sheets provide nucleus formation sites for ZnO, resulting in the synthesis of ZnO nanocrystals which have a larger active surface area and lower expansion/shrinkage during charge/discharge. The nanosizing of ZnO significantly improves its specific capacity as an anode for lithium-ion batteries. In the charge/discharge process, on the one hand, the graphene sheets can alleviate the structural expansion and shrinkage of the electrode, improving the cycle stability. On the other hand, the good electrical conductivity of the graphene sheets can benefit the transfer of both electrons and lithium ions, resulting in the improvement of high-rate performance of the electrode.
4. Conclusion
ZnO–graphene hybrid materials were synthesized by a hydrothermal method. The results of structure and morphology analyses show that the ZnO–graphene hybrid is composed of wurtzite-phased ZnO nanocrystals dispersed uniformly on functional graphene sheets. Such a unique architecture is established by the graphene sheets which provide enough nucleation sites for ZnO during the synthesis process. As an anode material for lithium ion batteries, the ZnO–graphene hybrid exhibits high reversible specific capacity, excellent cycle stability, and good rate performance, whose values are dramatically higher than those of pure ZnO anodes. It is worth noting that even at the low cut-off voltage of 0.01–1.0 V, the ZnO–HG anode can still deliver the reversible capacity of 240 mA h g−1, which is qualified for use as an anode material in Li-ion full cells. The enhanced electrochemical performance is mainly due to the presence of graphene sheets which play two important roles in improving the electrochemical performances. One being its excellent conductivity which ensures favorable transport kinetics for both the electrons and lithium ions, resulting in the improvement of the high-rate performance of ZnO. The other being its application as a volume buffer which can alleviate the typical problems associated with volume expansion and shrinkage during prolonged cycling, resulting in excellent cycle stability. Therefore, we believe that ZnO–graphene hybrids have great potential to be employed as an alternative anode material in lithium ion batteries.Acknowledgements
This work was supported by the Academic Advancement Project for the Middle-age and Young Teachers of Tianjin Normal University (No. 52XC1502). Dr Yan Feng is supported by the China Scholarship Council (No. 201408120022).References
- D. Larcher and J. M. Tarascon, Nat. Chem., 2015, 7, 19–29 CrossRef CAS PubMed.
- Y. M. Sun, N. Liu and Y. Cui, Nat. Energy, 2016, 1, 16071 CrossRef CAS.
- M. Ebner, F. Marone, M. Stampanoni and V. Wood, Science, 2013, 342, 716–720 CrossRef CAS PubMed.
- X. R. Lin, M. Salari, L. Mohana, R. Arava, P. M. Ajayan and M. W. Grinstaff, Chem. Soc. Rev., 2016, 45, 5848–5887 RSC.
- J. Lu, Z. H. Chen, Z. F. Ma, F. Pan, L. A. Curtiss and K. Amine, Nat. Nanotechnol., 2016, 11, 1031–1038 CrossRef CAS PubMed.
- L. A. Ellingsen, C. R. Hung, G. Majeau-Bettez, B. Singh, Z. W. Chen, M. S. Whittngham and A. H. Strømman, Nat. Nanotechnol., 2016, 11, 1039–1051 CrossRef CAS PubMed.
- J. W. Choi and D. Aurbach, Nat. Rev. Mater., 2016, 1, 16013 CrossRef CAS.
- M. Laurenti, N. Garino, S. Porro, M. Fontana and C. Gerbaldi, J. Alloys Compd., 2015, 640, 321–326 CrossRef CAS.
- Y. Sun, G. Z. Yang, H. Cui, J. Wang and C. X. Wang, ACS Appl. Mater. Interfaces, 2015, 7, 15230–15239 CAS.
- F. Zou, X. L. Hu, Z. Li, L. Qie, C. C. Hu, R. Zeng, Y. Jiang and Y. H. Huang, Adv. Mater., 2014, 26, 6622–6628 CrossRef CAS PubMed.
- M. S. Wu and H. W. Chang, J. Phys. Chem. C, 2013, 117, 2590–2599 CAS.
- J. P. Liu, Y. Y. Li, R. M. Ding, J. Jiang, Y. Y. Hu, X. X. Ji, Q. B. Chi, Z. H. Zhu and X. T. Huang, J. Phys. Chem. C, 2009, 113, 5336–5339 CAS.
- H. B. Wang, Q. M. Pan, Y. X. Cheng, J. W. Zhao and G. P. Yin, Electrochim. Acta, 2009, 54, 2851–2855 CrossRef CAS.
- G. H. Zhang, S. C. Hou, H. Zhang, W. Zeng, F. L. Yan, C. C. Li and H. G. Duan, Adv. Mater., 2015, 27, 2400–2405 CrossRef CAS PubMed.
- Q. M. Pan, L. M. Qin, J. Liu and H. B. Wang, Electrochim. Acta, 2010, 55, 5780–5785 CrossRef CAS.
- M. Ahmad, Y. Y. Shi, A. Nisar, H. Y. Sun, W. C. Shen, M. Wei and J. Zhu, J. Mater. Chem., 2011, 21, 7723–7729 RSC.
- N. Garino, A. Lamberti, R. Gazia, A. Chiodoni and C. Gerbaldi, J. Alloys Compd., 2014, 615, S454–S458 CrossRef CAS.
- Q. S. Xie, X. Q. Zhang, X. B. Wu, H. Y. Wu, X. Liu, G. H. Yue, Y. Yang and D. L. Peng, Electrochim. Acta, 2014, 125, 659–665 CrossRef CAS.
- K. T. Park, F. Xia, S. W. Kim, S. B. Kim, T. Song, U. Paik and W. I. Park, J. Phys. Chem. C, 2013, 117, 1037–1043 CAS.
- J. Yin, J. M. Carlin, J. Kim, Z. Li and J. H. Park, Adv. Energy Mater., 2015, 5, 1401412 CrossRef.
- G. H. Zhang, H. Zhang, X. Zhang, W. Zeng, Q. M. Su, G. H. Du and H. G. Duan, Electrochim. Acta, 2015, 186, 165–173 CrossRef CAS.
- L. Qiao, X. H. Wang, L. Qiao, X. L. Sun, X. W. Li, Y. X. Zheng and D. Y. He, Nanoscale, 2013, 5, 3037–3042 RSC.
- A. Kushima, X. H. Liu, G. Zhu, Z. L. Wang, J. Y. Huang and J. Li, Nano Lett., 2011, 11, 4535–4541 CrossRef CAS PubMed.
- L. L. Wang, K. B. Tang, M. Zhang and J. L. Xu, Nanoscale Res. Lett., 2015, 10, 280 CrossRef PubMed.
- X. H. Huang, X. H. Xia, Y. F. Yuan and F. Zhou, Electrochim. Acta, 2011, 56, 4960–4965 CrossRef CAS.
- Q. S. Xie, Y. T. Ma, D. Q. Zeng, L. S. Wang, G. H. Yue and D. L. Peng, Sci. Rep., 2015, 5, 8351 CrossRef CAS PubMed.
- J. Arjomandi, N. Keramat, I. Mossa and B. Jaleh, J. Appl. Polym. Sci., 2015, 132, 41526 CrossRef.
- L. Gao, S. H. Li, D. K. Huang, Y. Shen and M. K. Wang, Electrochim. Acta, 2015, 182, 529–536 CrossRef CAS.
- Q. Guo, S. S. Chen and X. Qin, Mater. Lett., 2014, 128, 50–53 CrossRef CAS.
- M. V. Reddy, C. T. Cherian, K. Ramanathan, W. K. C. Jie, T. Y. W. Daryl, T. Y. Hao, S. Adams, K. P. Loh and B. V. R. Chowdari, Electrochim. Acta, 2014, 118, 75–80 CrossRef CAS.
- L. J. Liu, C. Y. Zhao, H. L. Zhao, Q. Y. Zhang and Y. Li, Electrochim. Acta, 2014, 135, 224–231 CrossRef CAS.
- M. Wu, J. Y. Jo, S. Choi, Y. K. Kang and H. K. Jung, RSC Adv., 2015, 5, 24175–24177 RSC.
- M. Ahmad, Y. Y. Shi, H. Y. Sun, W. C. Shen and J. Zhu, J. Solid State Chem., 2012, 196, 326–331 CrossRef CAS.
- L. M. Qin, Q. Zhu, G. R. Li, F. T. Liu and Q. M. Pan, J. Mater. Chem., 2012, 22, 7544–7550 RSC.
- J. Bai, K. Q. Wang, J. K. Feng and S. L. Xiong, ACS Appl. Mater. Interfaces, 2015, 7, 22848–22857 CAS.
- X. L. Ge, Z. Q. Li, C. X. Wang and L. W. Yin, ACS Appl. Mater. Interfaces, 2015, 7, 26633–26642 CAS.
- Q. S. Xie, D. Q. Zeng, Y. T. Ma, L. Lin, L. Wang and D. L. Peng, Electrochim. Acta, 2015, 169, 283–290 CrossRef CAS.
- L. R. Hou, L. Lian, L. H. Zhang, G. Pang, C. Z. Yuan and X. G. Zhang, Adv. Funct. Mater., 2015, 25, 238–246 CrossRef CAS.
- W. Yin, Y. Shen, F. Zou, X. L. Hu, B. Chi and Y. H. Huang, ACS Appl. Mater. Interfaces, 2015, 7, 4947–4954 CAS.
- M. A. Woo, T. W. Kim, I. Y. Kim and S. J. Hwang, Solid State Ionics, 2011, 182, 91–97 CrossRef CAS.
- J. K. Lee and A. A. Khodin, Mater. Chem. Phys., 2014, 145, 1–5 CrossRef CAS.
- Y. Y. Wang, X. J. Jiang, L. S. Yang, N. Jia and Y. Ding, ACS Appl. Mater. Interfaces, 2014, 6, 1525–1532 CAS.
- Y. N. Zhou, W. J. Li and Z. W. Fu, Electrochim. Acta, 2012, 59, 435–440 CrossRef CAS.
- S. J. Yang, S. Nam, T. Kim, J. H. Im, H. Jung, J. H. Kang, S. Wi, B. Park and C. R. Park, J. Am. Chem. Soc., 2013, 135, 7394–7397 CrossRef CAS PubMed.
- X. Y. Shen, D. B. Mu, S. Chen, B. Wu and F. Wu, ACS Appl. Mater. Interfaces, 2013, 5, 3118–3125 CAS.
- X. H. Huang, R. Q. Guo, J. B. Wu and P. Zhang, Mater. Lett., 2014, 122, 82–85 CrossRef CAS.
- L. Zhou, T. Huang and A. S. Yu, ACS Sustainable Chem. Eng., 2014, 2, 2442–2447 CrossRef CAS.
- X. H. Liang, Q. Q. Song, Y. S. Liu and H. Liu, Int. J. Electrochem. Sci., 2015, 10, 9333–9341 CAS.
- X. Y. Luo, M. Piernavieja-Hermida, J. Lu, T. P. Wu, J. G. Wen, Y. Ren, D. Miller, Z. Z. Fang, Y. Lei and K. Amine, Nanotechnology, 2015, 26, 164003 CrossRef PubMed.
- H. Köse, S. Karaal, A. O. Aydin and H. Akbulut, J. Power Sources, 2015, 295, 235–245 CrossRef.
- S. M. Abbas, S. T. Hussain, S. Ali, N. Ahmad, N. Ali and S. Abbas, J. Mater. Sci., 2013, 48, 5429–5436 CrossRef CAS.
- X. Y. Shen, D. B. Mu, S. Chen, R. Huang and F. Wu, J. Mater. Chem. A, 2014, 2, 4309–4315 CAS.
- Shilpa, B. M. Basavaraja, S. B. Majunder and A. Sharma, J. Mater. Chem. A, 2015, 3, 5344–5351 CAS.
- J. Dai, M. Wang, M. Song, P. C. Li, C. Y. Zhang, A. J. Xie and Y. H. Shen, Scr. Mater., 2016, 112, 67–70 CrossRef CAS.
- S. Wi, H. Woo, S. Lee, J. Kang, J. Kim, S. An, C. Kim, S. Nam, C. Kim and B. Park, Nanoscale Res. Lett., 2015, 10, 204 CrossRef PubMed.
- H. M. Fang, L. Zhao, W. B. Yue, Y. Wang, Y. Jiang and Y. Zhang, Electrochim. Acta, 2015, 186, 397–403 CrossRef CAS.
- L. L. Xu, S. W. Bian and K. L. Song, J. Mater. Sci., 2014, 49, 6217–6224 CrossRef CAS.
- R. Guo, W. B. Yue, Y. M. An, Y. Ren and X. Yan, Electrochim. Acta, 2014, 135, 161–167 CrossRef CAS.
- S. Li, Y. Xiao, X. Wang and M. H. Cao, Phys. Chem. Chem. Phys., 2014, 16, 25846–25853 RSC.
- M. P. Yu, A. J. Wang, F. Y. Tian, H. Q. Song, Y. S. Wang, C. Li, J. D. Hong and G. Q. Shi, Nanoscale, 2015, 7, 5292–5298 RSC.
- R. Raccichini, A. Varzi, S. Passerini and B. Scrosati, Nat. Mater., 2015, 14, 271–279 CrossRef CAS PubMed.
- M. F. El-Kady, Y. L. Shao and R. B. Kaner, Nat. Rev. Mater., 2016, 1, 16033 CrossRef CAS.
- Z. T. Li, G. L. Wu, D. Liu, W. T. Wu, B. Jiang, J. T. Zheng, Y. P. Li, J. H. Li and M. B. Wu, J. Mater. Chem. A, 2014, 2, 7471–7477 CAS.
- S. H. Liu, Y. F. Dong, C. T. Zhao, Z. B. Zhao, C. Yu, Z. Y. Wang and J. S. Qiu, Nano Energy, 2015, 12, 578–587 CrossRef CAS.
- Z. T. Li, Y. K. Wang, Y. Chen and M. B. Wu, RSC Adv., 2017, 7, 6396–6402 RSC.
- G. L. Wu, M. B. Wu, D. Wang, L. H. Yin, J. S. Xie, S. Z. Deng, Z. Y. Zhu, W. J. Ye and Z. T. Li, Appl. Surf. Sci., 2014, 315, 400–406 CrossRef CAS.
- P. Li, Y. Liu, J. Y. Liu, Z. T. Li, G. L. Wu and M. B. Wu, Chem. Eng. J., 2015, 271, 173–179 CrossRef CAS.
- Z. T. Li, G. L. Wu, S. Z. Deng, S. J. Wang, Y. K. Wang, J. Y. Zhou, S. P. Liu, W. T. Wu and M. B. Wu, Chem. Eng. J., 2016, 283, 1435–1442 CrossRef CAS.
- Y. Feng, N. N. Feng, Y. Z. Wei and Y. Bai, J. Mater. Chem. A, 2014, 2, 4168–4177 CAS.
- Y. Feng, Y. L. Zhang, Y. Z. Wei, X. Y. Song, Y. B. Fu and V. S. Battaglia, Phys. Chem. Chem. Phys., 2016, 18, 30630–30642 RSC.
- Y. Feng, N. N. Feng and G. X. Du, RSC Adv., 2013, 3, 21466–21474 RSC.
- M. Pfaffender-Kmen, F. Bausch, G. Trettenhahn and W. Kautek, J. Phys. Chem. C, 2016, 120, 15563–15568 Search PubMed.
- R. B. Church, K. W. Hu, G. Magnacca and M. Cerruti, J. Phys. Chem. C, 2016, 120, 23207–23211 CAS.
- X. X. Chen and B. L. Chen, Environ. Sci. Technol., 2015, 49, 6181–6189 CrossRef CAS PubMed.
- C. Yu, M. Chen, X. J. Li, C. T. Zhao, L. L. He and J. S. Qiu, J. Mater. Chem. A, 2015, 3, 5054–5059 CAS.
- M. Chen, C. Yu, S. H. Liu, X. M. Fan, C. T. Zhao, X. Zhang and J. S. Qiu, Nanoscale, 2015, 7, 1791–1795 RSC.
- A. Meng, J. Xing, Z. J. Li and Q. D. Li, ACS Appl. Mater. Interfaces, 2015, 7, 27449–27657 CAS.
- F. Kleitz, F. Bérubé, R. Guillet-Nicolas, C.-M. Yang and M. Thommes, J. Phys. Chem. C, 2010, 20, 9344–9355 Search PubMed.
- P. Li, J. Y. Liu, Y. Liu, Y. W. Wang, Z. T. Li, W. T. Wu, Y. Wang, L. H. Yin, H. Xie, M. B. Wu, X. J. He and J. S. Qiu, Electrochim. Acta, 2015, 180, 164–172 CrossRef CAS.
- Y. Feng, N. N. Feng, G. Y. Zhang and G. X. Du, CrystEngComm, 2014, 16, 214–222 RSC.
- Y. Feng, N. N. Feng, Y. Z. Wei and G. X. Zhang, RSC Adv., 2014, 4, 7933–7943 RSC.
- N. N. Feng, Y. Feng, Y. Z. Wei and X. P. Zhou, RSC Adv., 2014, 4, 23694–23702 RSC.
- S. J. Rezvani, M. Ciambezi, R. Gunnella, M. Minicucci, M. A. Muñoz, F. Nobili, M. Pasqualini, S. Passerini, C. Schreiner, A. Trapananti, A. Witkowska and A. D. Cicco, J. Phys. Chem. C, 2016, 120, 4287–4295 CAS.
- G. Longoni, R. L. P. Cabrera, S. Polizzi, M. D'Arienzo, C. M. Mari, Y. Cui and R. Ruffo, Nano Lett., 2017, 17, 992–1000 CrossRef CAS PubMed.
- Y. J. Zhu and C. S. Wang, J. Phys. Chem. C, 2011, 115, 823–832 CAS.
- X. Zhao, J. H. Sui, F. Li, H. T. Fang, H. G. Wang, J. Y. Li, W. Cai and G. Z. Cao, Nanoscale, 2016, 8, 17902–17910 RSC.
- Y. Feng, Y. Z. Wei, Z. Jia, Y. L. Zhang, V. Battaglia and G. Liu, ChemistrySelect, 2016, 2, 309–317 CrossRef.
- Z. Li, F. Du, X. F. Bie, D. Zhang, Y. M. Cai, X. R. Cui, C. Z. Wang, G. Chen and Y. J. Wei, J. Phys. Chem. C, 2010, 114, 22751–22757 CAS.
- M. Ender, J. Illig and E. Ivers-Tiffée, J. Electrochem. Soc., 2017, 164, A71–A79 CrossRef CAS.
- J. Costard, M. Ender, M. Weiss and E. Ivers-Tiffée, J. Electrochem. Soc., 2017, 164, A80–A87 CrossRef CAS.
- Y. Cai, H.-E. Wang, S.-Z. Huang, M. F. Yuen, H.-H. Cai, C. Wang, Y. Yu, W. J. Zhang and B.-L. Su, Electrochim. Acta, 2016, 210, 206–214 CrossRef CAS.
- Y. Cai, H.-E. Wang, S.-Z. Huang, J. Lin, C. Wang, Y. Yu, Y. Li and B.-L. Su, Sci. Rep., 2015, 5, 11557 CrossRef CAS PubMed.
- Y. C. Dong, Y. Xia, Y.-S. Chui, C. W. Cao and J. A. Zapien, J. Power Sources, 2015, 275, 769–776 CrossRef CAS.
Footnote |
| † Electronic supplementary information (ESI) available. See DOI: 10.1039/c7se00102a |
| This journal is © The Royal Society of Chemistry 2017 |