Highlighting diffusional coupling effects in zeolite catalyzed reactions by combining the Maxwell–Stefan and Langmuir–Hinshelwood formulations†
Rajamani
Krishna
 *,
Richard
Baur‡
and
Jasper M.
van Baten§
Van 't Hoff Institute for Molecular Sciences, University of Amsterdam, Science Park 904, 1098 XH Amsterdam, The Netherlands. E-mail: r.krishna@contact.uva.nl
First published on 2nd February 2017
Abstract
The combined phenomena of intra-crystalline adsorption, diffusion and reversible chemical reactions inside microporous crystalline zeolite catalyst particles are described by combining the Langmuir–Hinshelwood kinetics with the Maxwell–Stefan (M–S) diffusion formulation. Simulations of transient diffusion and reaction inside catalyst crystallites are performed for a variety of reactions including: alkane isomerization, xylene isomerization, ethylation of benzene and dehydrogenation of ethane. For all reaction systems, the transient diffusion/reaction process exhibits overshoots in the loading of the more mobile guest molecules within the zeolite pores; such overshoots imply the attainment of supra-equilibrium conversions for a limited time span. The origin of the transient overshoots is traceable to the use of chemical potential gradients as the proper driving forces in the M–S formulation; this leads to coupling effects induced by mixture adsorption thermodynamics. Use of the simplified Fick's law for intra-crystalline diffusion, ignoring thermodynamic coupling, does not result in overshoots. Simulations of fixed zeolite bed reactors are performed to demonstrate the significant differences in the productivity predicted by the M–S and Fick models for intra-crystalline diffusion.
1. Introduction
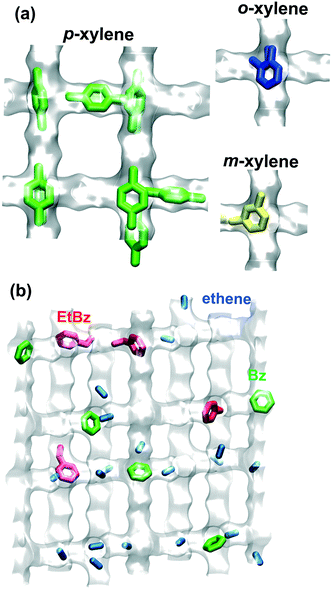
Zeolites are microporous crystalline aluminosilicates with pore dimensions in the range of 0.3 nm to 1 nm. The crystallographic structures of approximately 230 zeolites are listed in the database of the International Zeolite Association (IZA), using their three-letter IZA code names.1 Of these, only a handful, MFI, MOR, MTW, FER, FAU, MWW, TON, LTL, CHA, and BEA, find applications as catalysts in processes such as alkane isomerization, xylene isomerization, toluene disproportionation, aromatization, transalkylation of C9+ aromatics, olefin oligomerization, cumene synthesis, and linear alkylbenzene synthesis.2–10 Most commonly, extra-framework protons (H+) form a bond with the negatively charged oxygen anions of the zeolite; this results in Brønsted OH acid sites that have high reactivity.Intra-crystalline diffusion of reactants and products invariably exert a strong influence on the conversion and selectivity of zeolite-catalyzed reactions;11–14 such influences are stronger and have a different character than the diffusion influences in amorphous meso-porous and macro-porous catalysts, that are commonly addressed in standard textbooks on chemical reaction engineering.15–18 The intra-crystalline zeolite diffusivities may vary by several orders of magnitude, depending on molecular size, shape, configuration.13,14,19–24 For example, in MFI zeolite, that has intersecting 0.55 nm sized channels, p-xylene can locate anywhere along the channels; see Fig. 1a. The isomers o-xylene, and m-xylene are more strongly constrained in the channels and prefer to locate at the channel intersections, that offers more “leg-room”. Due to subtle configurational differences, the diffusivity of p-xylene in MFI zeolite is about 2–3 orders of magnitude higher than that of o-xylene and m-xylene.2,25 In the xylene isomerization reaction, p-xylene can diffuse into and out of the catalyst much more easily and this enhanced mobility has a strong influence on reaction selectivity. There is also a wide variety of other non-linear phenomena, such as the window effect, associated with diffusion and reaction in zeolite catalysts.12–14
For the ethylation of benzene using H-ZSM-5 catalyst to produce ethylbenzene, both benzene (reactant) and ethylbenzene (product) are preferentially located at the channel intersections; see Fig. 1b. The blocking of intersections by the aromatic guest molecules causes the effective diffusivity of reactant ethene inside the catalyst to reduce five-fold as the total mixture loading approaches 2 molecules per unit cell.26
Within the zeolite micropores, the guest molecules are in the adsorbed state; broadly speaking, the stronger the binding energy, the lower is the guest molecule mobility within the zeolite framework.27,28 Mixture adsorption thermodynamics has a strong and direct influence on the transport fluxes; the chemical potential gradients are the proper driving forces for intra-crystalline species transport. It is now generally recognized that the Maxwell–Stefan (M–S) formulation, that has its roots in irreversible thermodynamics, affords a proper description of intra-crystalline diffusion.19,20,26,29–32 For n-component diffusion, the fluxes Ni, relative to the zeolite pore walls, are related to the chemical potential gradients by
 | (1) |
The M–S diffusivity Đi, with the units m2 s−1, is to be interpreted as an inverse drag coefficient between the adsorbate and the surface. For meso-porous, and macro-porous materials, for example, the Đi is relatable to the Knudsen diffusivity.33
The Đij may be interpreted as the inverse drag coefficient between species i and species j. At the molecular level, the Đij reflect how the facility for transport of species i correlates with that of species j; they are also termed exchange coefficients. The Onsager reciprocal relations demand the symmetry constraint Đij = Đji; i,j = 1, 2,…n. For all of the examples treated in this article, i–j correlations are considered to be negligible, i.e. Đi/Đij ≪ 1, and eqn (1) simplifies to yield
 | (2) |
The chemical potential gradients ∂μi/∂r can be related to the gradients of the molar loadings, qi, by defining thermodynamic correction factors Γij
 | (3) |
Consider the special case in which each of the pure component adsorption isotherms is described by a single-site Langmuir isotherm model  where p is the bulk gas pressure and we define the fractional occupancy of the adsorbate molecules, θ = q/qsat. The single-site Langmuir isotherm can be derived by equating the rate of adsorption with the rate of desorption. The rate of adsorption is proportional to the total number of vacant sites, Rateads = kadspnsitesθV = kadsnsitesp(1 − θ). The rate of desorption is proportional to the number of occupied sites, Ratedes = kdesnsitesθ. At adsorption equilibrium, we have kadspnsites(1 − θ) = kdesNsitesθ and so,
  . The Langmuir adsorption constant, is simply the ratio of the adsorption rate constant to the desorption rate constant,
  .
.
The mixed gas Langmuir model for calculation of the component loadings in the adsorbed phase is
 | (4) |
 | (5) |
In eqn (5), we define the fractional occupancies
 | (6) |
 | (7) |
Eqn (2) can be combined with eqn (3) to yield
 | (8) |
For detailed discussions on the applicability of the simplified M–S eqn (8), the reader is referred to earlier works.19,20,35,36 An important persuasive advantage of the M–S equations is that the Đi for mixture diffusion often retains the same magnitude and loading dependence as for unary diffusion.19,20,35 Molecular dynamics (MD) data19,20,27–29,37–40 on the M–S diffusivities of a wide variety of guest/zeolite combinations show that the loading dependence can be divided into two broad categories: (1) “weak confinement” scenario which Đi are practically loading independent, and (2) “strong confinement” scenario for the M–S diffusivity is proportional to the factional vacancy, Đi = Đi(0)θV, where Đ(0) is the zero-loading diffusivity. Fig. S25–S29† illustrate the applicability of the two scenarios for two common zeolite catalysts, MFI and MOR.
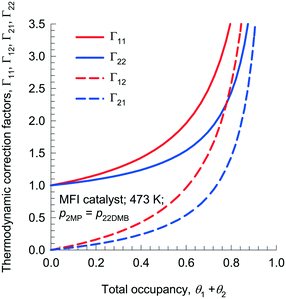
Fig. 2 presents calculations of Γij, as a function of total mixture occupancy, θ1 + θ2 = 1 − θV, for adsorption of 1![[thin space (1/6-em)]](https://www.rsc.org/images/entities/char_2009.gif) :
:![[thin space (1/6-em)]](https://www.rsc.org/images/entities/char_2009.gif) 1 mixtures of 2-methylpentane (2MP) and 2,2 dimethyl-butane (22DMB) in MFI zeolite. The off-diagonal elements Γ12, and Γ21 become increasingly important with increased mixture occupancy, θ1 + θ2. In particular, it is noteworthy that the off-diagonal elements Γ12 and Γ21 get progressively closer to diagonal elements Γ11 and Γ22 as θ1 + θ2 → 1. Due to finite magnitudes of Γ12, and Γ21, an important characteristic of diffusion in zeolites is that the flux of any component may be engendered by the gradients in the molar loadings of all the n species in the mixture. Such coupling effects have their origins in mixture adsorption thermodynamics; we shall use the term “thermodynamic coupling” to characterize these.
1 mixtures of 2-methylpentane (2MP) and 2,2 dimethyl-butane (22DMB) in MFI zeolite. The off-diagonal elements Γ12, and Γ21 become increasingly important with increased mixture occupancy, θ1 + θ2. In particular, it is noteworthy that the off-diagonal elements Γ12 and Γ21 get progressively closer to diagonal elements Γ11 and Γ22 as θ1 + θ2 → 1. Due to finite magnitudes of Γ12, and Γ21, an important characteristic of diffusion in zeolites is that the flux of any component may be engendered by the gradients in the molar loadings of all the n species in the mixture. Such coupling effects have their origins in mixture adsorption thermodynamics; we shall use the term “thermodynamic coupling” to characterize these.
In the Henry regime of adsorption, when the fractional occupancies are vanishingly small, we have the special case that the matrix of thermodynamic factors reduces to the identity matrix Γij → δij, and we obtain the uncoupled form of the flux equations
 | (9) |
Eqn (9) may be considered to be representative of the Fick's law of diffusion for intra-crystalline transport; this flux expression is commonly employed for calculation of effectiveness factors in meso-porous and macro-porous catalysts.15–17 While implementing the Fickian eqn (9), we commonly assume that the M–S diffusivity is independent of loading.
The primary objective of this communication is to highlight the important consequences of thermodynamic coupling on the performance of a number of zeolite catalyzed reactions, including alkane isomerization, xylene isomerization, ethylation of benzene and dehydrogenation of ethane. We aim to demonstrate the possibility of transient overshoots and uphill transport in zeolite catalysts; such phenomena are not anticipated by use of simple uncoupled Fickian eqn (9). Simulations of fixed zeolite bed reactors will be used to demonstrate the strong influence of thermodynamic coupling effects on the selectivity and productivity. For all calculations and simulations presented in this article, we compare the results obtained by the use of three different scenarios for flux calculations.
(1) M–S model eqn (8) with “weak” confinement scenario; thermodynamic coupling effects are duly accounted for using the appropriate model to describe mixture adsorption equilibrium.
(2) M–S model eqn (8) with strong confinement scenario Đi = Đi(0)θV and inclusion of thermodynamic coupling effects.
(3) Fick model eqn (9) in which the M–S diffusivities are independent of loading, and thermodynamic coupling effects are ignored, i.e. Γij = δij.
The ESI† accompanying this publication provides (a) structural data on commonly used zeolite catalysts, (b) detailed derivations of the Maxwell–Stefan (M–S) equations for intra-crystalline diffusion, (c) background information on the loading dependence of M–S diffusivities, (d) computational modelling of transient uptake within single crystals, and (e) computational modeling of transient breakthroughs in fixed bed reactors. The input data on isotherms, M–S diffusivities, and reaction rate constants in the variety of illustrative examples used in this article are provided in Tables 4–11 of the ESI.†
2. Catalyst effectiveness factor
Consider the reversible reaction of 2-methylpentane (2MP) and 2,2 dimethyl-butane (22DMB), 2MP(1) ⇄ 22DMB(2), that is important in the context of increasing the octane number of gasoline. The rate of chemical reaction, expressed as mol kg catalyst−1 s−1, Rkg, may written as| Rkg = k1q1 − k2q2 | (10) |
The component loadings qi may be described by the mixed-gas Langmuir model (eqn (4)), and therefore we derive the familiar Langmuir–Hinshelwood expression
 | (11) |
The radial distribution of molar loadings, qi, within a spherical zeolite crystallite, of radius rc, is obtained from a solution of a set of differential equations
 | (12) |
 | (13) |
After insertion of the appropriate rate expressions for the chemical reaction rate, Rkg, the flux equations for Ni, the eqn (13) can be solved to obtain the steady-state distribution of the loadings of the components along the crystal radius, r. The effectiveness factor, η, is
 | (14) |
For the Fickian model in which thermodynamic coupling effects are ignored, Γij → δij, and the Đi are considered to be loading independent, the effectiveness factor is given by
 | (15) |
 | (16) |
Baur and Krishna41,42 have presented analytic solutions to eqn (1) and (13) for two different descriptions of the loading-dependence of the M–S diffusivities Đi; see details in the ESI.† In the “weak confinement” scenario the M–S diffusivity is loading independent, i.e. Đi = Đi(0), the value at zero-loading. In the “strong confinement” scenario the M–S diffusivity is taken as being proportional to the fractional vacancy: Đi = Đi(0)θV.
Fig. 3a presents calculations of the effectiveness factor, η, for uptake inside MFI catalyst exposed to a gas phase 2MP(1)/22DMB(2) mixture at 473 K; the partial pressures of the components in the bulk gas phase are p1 = p2 = 10 kPa. The x-axis in Fig. 3a is the Thiele modulus, calculated using eqn (16). From configurational considerations, the di-branched isomer 22DMB has a diffusivity that is 80 times lower than the diffusivity of the mono-branched isomer 2MP, i.e. Đ1(0)/Đ2(0) = 80. The highest effectiveness factors are obtained with Fickian model that assumes Γij = δij. As is to be expected, diffusional influences are strongest for the scenario in which the M–S diffusivities are linearly related to the vacancy, Đi = Đi(0)θV.
 | ||
| Fig. 3 Calculation of the effectiveness factor, η, for MFI catalyst carrying out the 2MP(1) ⇄ 22DMB(2) reaction at 473 K. In (a), the partial pressures of the components in the bulk gas phase are p1 = p2 = 10 kPa. The ratio of rate constants k1/k2 = 2; the values of the rate constant k1 are varied. In (b) the constant parameters are k1 = 0.0011 s−1; k1/k2 = 2; ϕ = 1.0011. The partial pressures of the components in the bulk gas phase are p1 = p2; the total pressure p1 + p2 is varied in the range 0 to 40 kPa. The x-axis is the fractional occupancy at the catalyst surface, θ1s + θ2s. (c) Radial profile of component loadings for the specific case p1 = p2 = 10 kPa, k1 = 0.0011 s−1; k1/k2 = 2; ϕ = 1.0011. All calculation details and data inputs are provided in the ESI.† | ||
The most important feature of the M–S formulation is the proper accounting of thermodynamic coupling influences. In order to stress the direct influence of adsorption thermodynamics, Fig. 3b presents calculations of the effectiveness factor, η, for a MFI catalyst that is exposed to an equimolar gas 2MP/22DMB gas mixture; the total pressure p1 + p2 is varied in the range 0 to 40 kPa. Increasing the bulk gas pressure increases the fractional occupancy at the catalyst surface, θ1s + θ2s. The classical effectiveness factor, calculated from eqn (15), is a constant, independent of θ1s + θ2s. By proper accounting of the mixture adsorption thermodynamics, we note that the effectiveness factor for M–S model (weak, and strong confinement) decrease when θ1s + θ2s increases.
Fig. 3c shows the steady-state radial distribution of component loadings for partial pressures p1 = p2 = 10 kPa in the bulk gas mixture. The M–S and Fick models yield significantly different radial profiles of the molar loadings; such differences may have consequences in complex reaction schemes.
3. Transient overshoots inside zeolite catalyst
The differences between the M–S and Fick models become much more significant when monitoring the transient approach to equilibrium within the zeolite catalyst. The analysis of transient adsorption, diffusion, and reaction in zeolites is of relevance in the proper interpretation of data obtained in TEOM (tapered element oscillating microbalance), and TAP (temporal analysis of products) experimental investigations.43–45Consider the transient uptake with chemical reaction within MFI catalyst exposed to a gas phase 2MP/22DMB mixture at 473 K with the partial pressures of the components in the bulk gas phase are p1 = p2 = 10 kPa. The partial differential eqn (12) need to be solved numerically to obtain the spatio-temporal loadings within the catalyst; numerical details are provided in the ESI.† The spatial-averaged component loading within the crystallites of radius rc is calculated using
 | (17) |
Fig. 4 plots the equilibration trajectories in ternary occupancy space, with coordinates, θ1 (2MP), θ2 (22DMB), θV (MFI zeolite vacancy); in the inset, ![[q with combining macron]](https://www.rsc.org/images/entities/i_char_0071_0304.gif) i(t) is plotted as a function of
i(t) is plotted as a function of  . Both the M–S model implementations (weak and strong confinement) predict an overshoot in the spatial-averaged loading of the more mobile component 2MP. The Fickian model, that assumes Γij → δij, does not anticipate any overshoots in 2MP uptake and the equilibration trajectory in ternary occupancy space has a completely different, monotonous, character. There is a wide variety of experimental data on transient uptake of binary mixtures in zeolites, under non-reacting conditions, that show transient overshoots of the more mobile species, signifying uphill diffusion phenomena; a detailed analysis of the experimental data30,46,47 leads to the conclusion that the origin of the overshoots can be traced to thermodynamic coupling effects, i.e. the non-diagonal elements of Γij. The results in Fig. 4 also lead to the same conclusion; i.e. that the origin of transient overshoots in reacting systems is traceable to thermodynamic coupling, i.e. the off-diagonal elements of Γij. Furthermore, the final equilibrated loadings are dependent on the scenario used to calculate the intra-crystalline fluxes. On the basis of the re-analysis of transient 2MP/22DMB breakthrough experiments of Jolimaître et al.48,49 it has been established that the proper model to describe intra-crystalline diffusion is the M–S model with the weak confinement scenario for M–S diffusivities.29,30
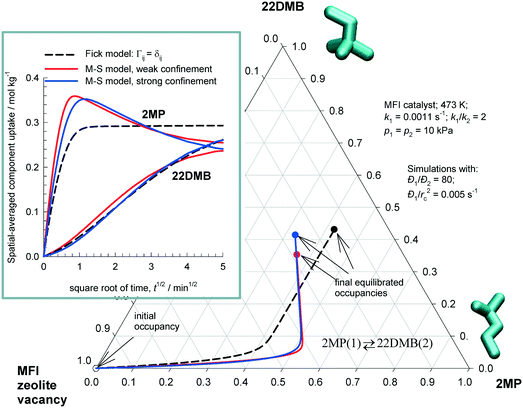 | ||
Fig. 4 Transient uptake inside MFI catalyst carrying out 2MP(1) ⇄ 22DMB(2) reaction. The equilibration trajectories are plotted in ternary occupancy space, with coordinates, θ1 (2MP), θ2 (22DMB), θV (MFI zeolite vacancy). The inset shows ![[q with combining macron]](https://www.rsc.org/images/entities/i_char_0071_0304.gif) i(t) plotted as a function of i(t) plotted as a function of  . The continuous solid lines represent uptake simulations include thermodynamic coupling using eqn (8). The dashed lines represent uptake simulations ignoring thermodynamic coupling and use uncoupled flux eqn (9). All calculation details and data inputs are provided in the ESI.† Video animations of the spatio-temporal variations of the component loadings within the catalyst are available as ESI.† . The continuous solid lines represent uptake simulations include thermodynamic coupling using eqn (8). The dashed lines represent uptake simulations ignoring thermodynamic coupling and use uncoupled flux eqn (9). All calculation details and data inputs are provided in the ESI.† Video animations of the spatio-temporal variations of the component loadings within the catalyst are available as ESI.† | ||
Analogous results are obtained o-xylene(1) ⇄ p-xylene(2) for reaction with MFI catalyst. Fig. 5 plots the equilibration trajectories in ternary occupancy space, with coordinates, θ1 (o-xylene), θ2 (p-xylene), θV (MFI zeolite vacancy); in the inset, ![[q with combining macron]](https://www.rsc.org/images/entities/i_char_0071_0304.gif) i(t) is plotted as a function of
i(t) is plotted as a function of  . Para-Xylene has a significantly higher diffusivity than o-xylene due to configurational considerations; following the work of Mirth et al.25 we assume that the diffusivity of p-xylene is 100 times that of o-xylene i.e. Đ1(0)/Đ2(0) = 100. Both the M–S model implementations (weak and strong confinement) predict an overshoot in the loading of the more mobile component p-xylene. Since p-xylene is the desired reaction product, the overshoot signifies the attainment of supra-equilibrium conversions within the catalyst for a limited duration during the initial transience. Available experimental data28,50,51 indicate that the M–S model with strong confinement scenario provides an appropriate description of diffusivity of xylene isomers in MFI zeolite.
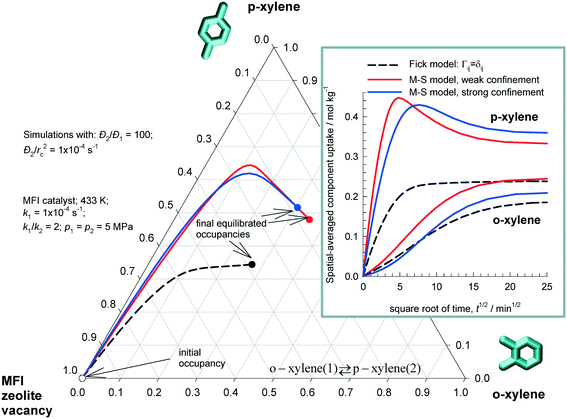 | ||
Fig. 5 Transient uptake inside MFI catalyst o-xylene(1) ⇄ p-xylene(2) reaction. The equilibration trajectory is plotted in ternary occupancy space, with coordinates, θ1 (o-xylene), θ2 (p-xylene), θV (MFI zeolite vacancy). The inset shows ![[q with combining macron]](https://www.rsc.org/images/entities/i_char_0071_0304.gif) i(t) plotted as a function of i(t) plotted as a function of  . The continuous solid lines represent uptake simulations include thermodynamic coupling using eqn (8). The dashed lines represent uptake simulations ignoring thermodynamic coupling and use uncoupled flux eqn (9). All calculation details and data inputs are provided in the ESI.† Video animations of the spatio-temporal variations of the component loadings within the catalyst are available as ESI.† . The continuous solid lines represent uptake simulations include thermodynamic coupling using eqn (8). The dashed lines represent uptake simulations ignoring thermodynamic coupling and use uncoupled flux eqn (9). All calculation details and data inputs are provided in the ESI.† Video animations of the spatio-temporal variations of the component loadings within the catalyst are available as ESI.† | ||
Consider transient uptake within MFI catalyst carrying out the isomerization of n-hexane (nC6) to produce mono-branched 3-methylpentane (3MP) and di-branched 2,2 dimethylbutane (22DMB). We restrict our analysis to the simplified reaction scheme52
| nC6(1) ⇄ 3MP(2) ⇄ 22DMB(3) | (18) |
| Rkg,1 = (kf1q1 − kb1q2) Rkg,2 = (kf2q2 − kb2q3) | (19) |
The subscripts f and b refer to the forward and reverse reactions, and the subscripts 1 and 2 refer to the first and second isomerization reaction steps in eqn (18). For total pressures exceeding about 100 Pa, the hierarchy of adsorption strengths is nC6 > 3MP > 22DMB due to subtle configurational entropy effects arising out of the preferential location of the branched isomers at the channel intersections; the linear nC6 can locate anywhere along the intersecting channel network. For a quantitative description of entropy effects, the mixture adsorption equilibrium is determined using the Ideal Adsorbed Solution Theory (IAST); see Fig. S30–S33 of the ESI.†
Fig. 6a presents simulations of transient uptake inside MFI catalyst exposed to a gas phase nC6(1)/3MP(2)/22DMB(3) mixture at 362 K; the partial pressures of the components in the bulk gas phase are p1 =1000 Pa; p2 = 1 Pa, p3 = 1 Pa. The zero-loading M–S diffusivities are Đ1(0)/rc2= 2 × 10⁻⁴ s−1; Đ2(0)/rc2 = 2 × 10⁻⁵ s−1; Đ3(0)/rc2 = 1 × 10⁻⁵ s−1; the choice of these diffusivities is based on earlier works.29,30,36,53 The continuous solid lines represent uptake simulations with the M–S eqn (8). We note that the most mobile nC6 displays an overshoot during transient uptake. 3-Methylpentane (3MP), with intermediate mobility, also exhibits a slight overshoot. The dashed lines represent uptake simulations with uncoupled Fickian flux eqn (9); in this scenario, all three components approach equilibrium in a monotonous manner. In the transient uptake experiments of Titze et al.,36 the M–S model, with the weak confinement scenario, has been established to be a good representation of the uptake of n-hexane/2-methylpentane mixtures in MFI zeolite.
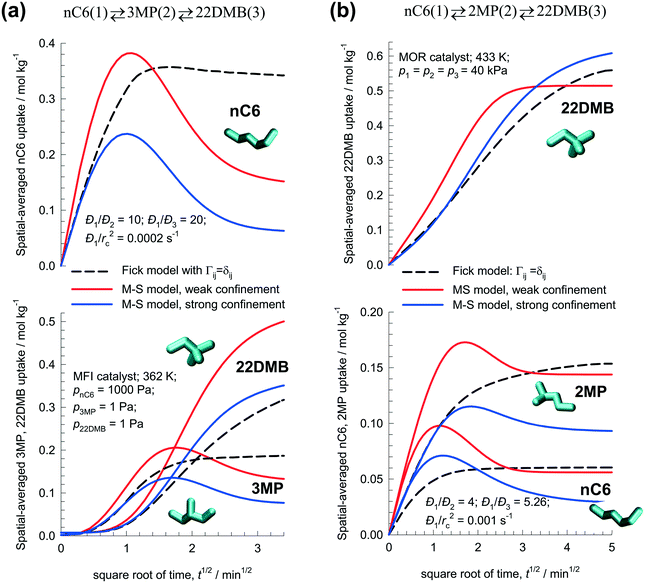 | ||
| Fig. 6 Transient uptake inside zeolite catalysts for the n-hexane isomerization reactions: (a) MFI nC6(1) ⇄ 3MP(2) ⇄ 22DMB(3) with MFI catalyst, and (b) nC6(1) ⇄ 2MP(2) ⇄ 22DMB(3) with MOR catalyst. The spatial-averaged loadings are calculated using eqn (17). The continuous solid lines represent uptake simulations include thermodynamic coupling using eqn (8). The dashed lines represent uptake simulations ignoring thermodynamic coupling and use uncoupled flux eqn (9). All calculation details and data inputs are provided in the ESI.† Video animations of the spatio-temporal variations of the component loadings within the catalyst are available as ESI.† | ||
Fig. 6b presents the corresponding results for transient uptake during the n-hexane isomerization reaction nC6(1) ⇄ 2MP(2) ⇄ 22DMB(3) using MOR catalyst. For total pressures exceeding 10 kPa, the adsorption hierarchy in this cases is nC6 < 2MP < 22DMB; this is dictated by the fact that most compact 22DMB molecules can be most efficiently packed within the 12-ring channels of MOR;40 see Fig. S34 and S35 of the ESI.† The M–S model calculations, with either weak or strong confinement, display overshoots for the more mobile nC6, and 2MP. No such overshoots are anticipated by the Fick model that ignores thermodynamic coupling; in this scenario all three guest molecules equilibrate monotonously. From the MD simulation data of van Baten and Krishna40 for hexane isomers in MOR, it can be established that the M–S model with the strong confinement scenario is the appropriate one to use.
H-ZSM-5, which has the MFI topology, is used as a catalyst for carrying out the ethylation of benzene to produce ethylbenzene ethene(1) + benzene(2) ⇄ ethylbenzene(3); for background on the process and reaction kinetics, see Hansen et al.26,54 In our simulations we use the Langmuir–Hinshelwood rate expression
| Rkg = kfq1q2 − kbq3 | (20) |
Fig. 7a presents the simulation results for transient uptake inside MFI catalyst exposed to a gas phase ethene(1)/benzene(2)/ethylbenzene(3) mixture at 653 K; the partial pressures of the components in the bulk gas phase are p1 = 0.6 MPa; p2 = 0.4 MPa; p3 = 0 MPa. Based on MD simulation data,26 the zero-loading M–S diffusivities are taken to be Đ1(0)/rc2 = 1 × 10⁻³ s−1, Đ2(0)/rc2 = 2 × 10⁻⁵ s−1; Đ3(0)/rc2 = 1 × 10⁻⁵ s−1. Both the M–S model implementations, with weak and strong confinement, predict ethene loading overshoots. The Fickian approach, assuming Γij = δij, anticipates monotonous equilibration of all three guest molecules. The MD simulation data of Hansen et al.26 indicate that the M–S model with strong confinement is the appropriate model to use for ethylation of benzene.
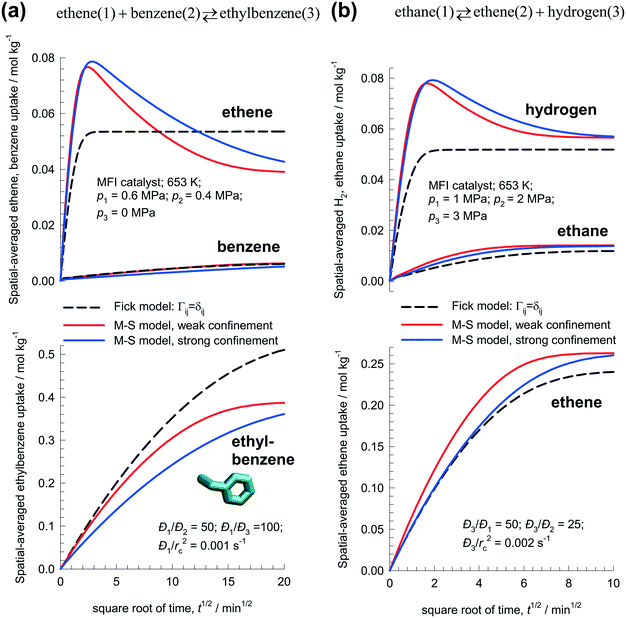 | ||
| Fig. 7 Transient uptake inside MFI catalyst with: (a) ethene(1) + benzene(2) ↔ ethylbenzene(3), and (b) ethane(1) ↔ ethene(2) + hydrogen(3) reaction. The spatial-averaged loadings are calculated using eqn (17). The continuous solid lines represent uptake simulations include thermodynamic coupling using eqn (8). The dashed lines represent uptake simulations ignoring thermodynamic coupling and use uncoupled flux eqn (9). All calculation details and data inputs are provided in the ESI.† Video animations of the spatio-temporal variations of the component loadings within the catalyst are available as ESI.† | ||
Hansen et al.54 describe the use of MFI catalyst for the dehydrogenation of ethane to produce ethene: ethane(1) ⇄ ethene(2) + hydrogen(3). The reaction rate Rkg expressed as mol kg catalyst−1 s−1 is
| Rkg = kfq1 − kbq2q3 | (21) |
Fig. 7b presents the simulation results for transient uptake inside MFI catalyst exposed to a gas phase ethane(1)/ethene(2)/hydrogen(3) mixture at 653 K. The partial pressures of the components in the bulk gas phase are p1 = 1.0 MPa; p2 = 2 MPa, p3 = 3 MPa. Both the M–S model implementations (with weak and strong confinement) predict overshoots in the spatial-averaged loading of the most mobile H2. The Fick model anticipates monotonous equilibration for all guest species.
4. Fick vs. Maxwell–Stefan models for fixed bed reactors
We now examine how thermodynamic coupling effects influence the performance of fixed and moving bed reactors; such effects are commonly ignored in reactor models that are used in practice.16,55 Simulated moving bed (SMB) reactors are commonly operated in transient mode. Assuming plug flow of an n-component gas mixture through a fixed bed maintained under isothermal conditions, the partial pressures in the gas phase at any position and instant of time are obtained by solving the following set of partial differential equations for each of the species i in the gas mixture | (22) |
In eqn (22), t is the time, z is the distance along the reactor, ρ is the framework density, ε is the bed voidage, v is the interstitial gas velocity, and Ni|r=rc is the molar flux loading at the position r = rc, monitored at position z, and at time t, determined by use of eqn (8) or eqn (9), as appropriate. Robust computational procedures are required for solving the set of eqn (22); these are outlined in the ESI.†
Fig. 8a presents the transient breakthrough simulations for fixed bed 2MP/22DMB isomerization reactor with MFI. The plot shows the molar concentrations in the gas phase as a function of the dimensionless time, τ = tv/L, obtained by dividing the actual time, t, by the characteristic time, L/v. The continuous solid lines represent breakthrough simulations using eqn (8), along with the weak confinement scenario. The dashed lines represent breakthrough simulations using the uncoupled Fickian eqn (9). The transient breakthroughs are predicted to be sharper in the M–S model implementation. 22DMB with purities exceeding 90% can be recovered during the earlier stages of transient breakthrough as indicated in Fig. 8b; at steady-state, the product exiting the reactor contains 70% 22DMB. Baur and Krishna56 present a detailed analysis of transient operations of SMB reactors for optimal 2MP/22DMB isomerization performance, obviating the need for a subsequent separation step to recover 22DMB. The use of zeolite SMB reactors for alkane isomerization has been patented by Universal Oil Products (UOP).57–59
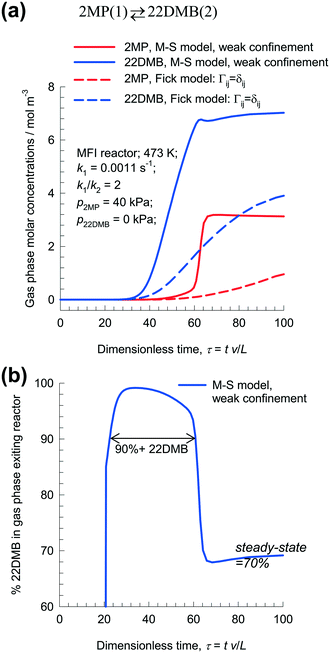 | ||
| Fig. 8 (a) Transient breakthrough simulations for fixed bed with MFI extrudates, carrying out the isomerization reaction 2MP(1) ⇄ 22DMB(2). The partial pressures of the components in the bulk gas phase at the reactor inlet are p1 = 40 kPa, p2 = 0 kPa. The continuous solid lines represent simulations using eqn (8), along with the weak confinement scenario. The dashed lines represent breakthrough simulations ignoring thermodynamic coupling and using uncoupled flux eqn (9). (b) The plot shows the % 22DMB in the gas phase as a function of the dimensionless time, τ = tv/L, obtained by dividing the actual time, t, by the characteristic time, L/v. All calculation details and data inputs are provided in the ESI.† | ||
At steady-state, the gas phase concentrations of 2MP, and 22DMB long the dimensionless length of the fixed bed reactor are shown in Fig. 9a. Using the M–S model, the rate of production of 22DMB is 1.81 × 10⁻⁴ mol kg catalyst−1 s−1; this value is significantly higher than the rate of production of 22DMB predicted by the Fick model: 1.14 × 10⁻⁴ mol kg catalyst−1 s−1. The use of the conventional Fick model will severely under-predict 22DMB productivity.
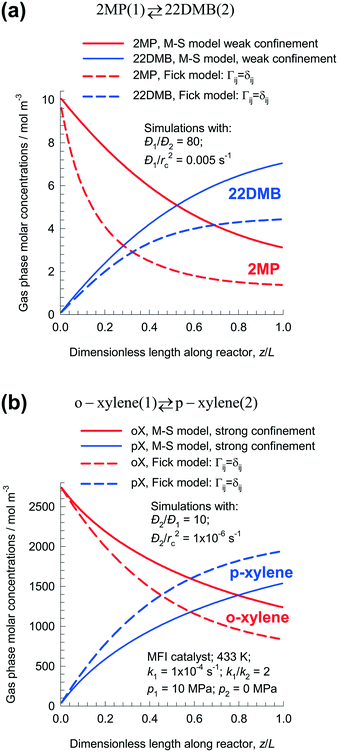 | ||
| Fig. 9 Steady-state molar concentrations of (a) 2MP/22DMB, and (b) o-xylene/p-xylene along the dimensionless length of fixed bed isomerization reactor with MFI catalyst. All calculation details and data inputs are provided in the ESI.† | ||
The conclusion that the Fick model predicts diminished productivity of the desired product is not, however, a general one. Fig. 9b shows the shows the steady-state gas phase molar concentrations of o-xylene and p-xylene along the length of the reactor bed for o-xylene(1) ⇄ p-xylene(2) isomerization reaction. For the M–S model, assuming the strong confinement scenario, the rate of production of p-xylene is 5.7 × 10⁻⁶ mol kg catalyst−1 s−1; this value is significantly lower than the rate of production of p-xylene predicted by the Fick model calculations that ignores thermodynamic coupling: 7.2 × 10⁻⁶ mol kg catalyst−1 s−1. Use of the Fick model to predict reactor performance will be overly optimistic in this case; this conclusion is opposite to that for the 2MP(1) ⇄ 22DMB(2) reaction. The differences in the two foregoing examples are rationalized as follows. For 2MP/22DMB, the desired product is the tardier species; for o-xylene/p-xylene, the desired isomerization product is the more mobile species.
Whether the simple Fickian model over-predicts or under-predicts the productivity of the desired species also depends on the hierarchy of adsorption strengths. To illustrate this, we consider n-hexane isomerization using two different catalysts: MFI, and MOR. Fig. 10a shows the steady-state molar concentrations of 22DMB along the dimensionless length of fixed bed nC6(1) ⇄ 3MP(2) ⇄ 22DMB(3) isomerization reactor with MFI catalyst; the hierarchy of adsorption strengths is nC6 > 3MP > 22DMB. In this case, the Fickian model predicts a 22DMB productivity of 7.82 × 10⁻⁵ mol kg catalyst−1 s−1; this value is lower than either of the two different implementations of the M–S model. For the weak confinement scenario, the rate of production of 22DMB is 3.4 × 10⁻⁴ mol kg catalyst−1 s−1. For the strong confinement scenario, the rate of production of 22DMB is 2.74 × 10⁻⁴ mol kg catalyst−1 s−1.
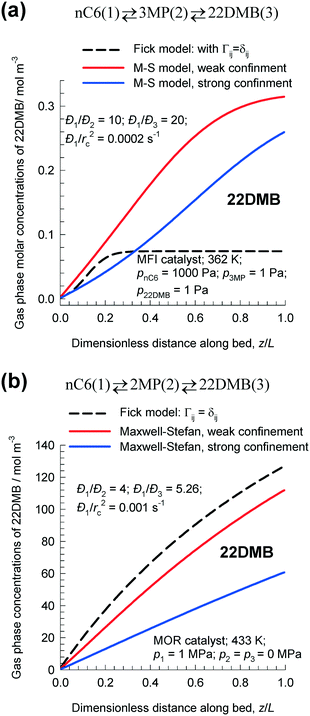 | ||
| Fig. 10 Steady-state molar concentrations of the desired product 22DMB along the dimensionless length of fixed bed carrying out n-hexane isomerization reactions: (a) MFI nC6(1) ⇄ 3MP(2) ⇄ 22DMB(3) with MFI catalyst, and (b) nC6(1) ⇄ 2MP(2) ⇄ 22DMB(3) with MOR catalyst. All calculation details and data inputs are provided in the ESI.† | ||
Fig. 10b shows the steady-state molar concentrations of 22DMB along the dimensionless length of fixed bed nC6(1) ⇄ 2MP(2) ⇄ 22DMB(3) isomerization reactor with MOR catalyst. As explained earlier, entropy effects in MOR lead to the reverse adsorption hierarchy nC6 < 2MP < 22DMB. For the Fickian model that ignores thermodynamic coupling, the productivity of 22DMB is 9.9 × 10⁻⁴ mol kg catalyst−1 s−1; this value is higher than that predicted by either of the two M–S model implementations: weak confinement: 8.7 × 10⁻⁴ mol kg catalyst−1 s−1; strong confinement: 4.72 × 10⁻⁴ mol kg catalyst−1 s−1.
For the ethylation reaction ethene(1) + benzene(2) ⇄ ethylbenzene(3), the desired product ethylbenzene is least mobile but most strongly adsorbed. Fig. 11a compares the ethylbenzene concentrations in the gas phase along the length of the fixed zeolite bed at steady-state using the Fick and M–S models. The Fick model predicts the productivity of ethylbenzene as: 1.6 × 10⁻³ mol kg catalyst−1 s−1; this value is significantly higher than that predicted by either of the two M–S model implementations. For weak confinement, the productivity is: 1.36 × 10⁻³ mol kg catalyst−1 s−1; for strong confinement, the productivity is: 7.9 × 10⁻⁴ mol kg catalyst−1 s−1.
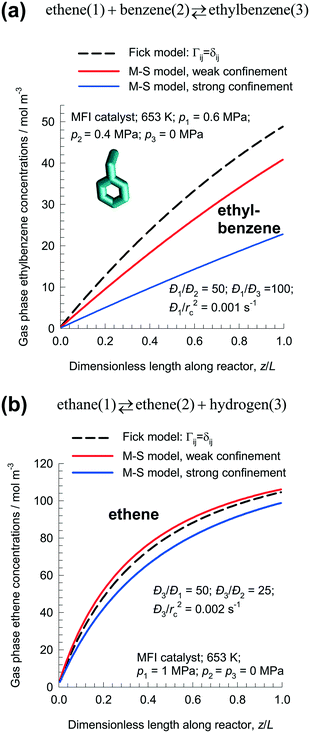 | ||
| Fig. 11 Steady-state simulations of fixed bed reactor packed with MFI catalyst carrying out: (a) ethene(1) + benzene(2) ⇄ ethylbenzene(3), and (b) ethane(1) ⇄ ethene(2) + hydrogen(3) reactions. The plots show the molar concentrations of the desired products (a) ethylbenzene, and (b) ethene in the gas phase along the dimensionless length of the fixed bed, z/L. All calculation details and data inputs are provided in the ESI.† | ||
Clearly, if diffusional influences are minor in nature, the differences between Fick and M–S models will be insignificant. This is evidenced in the dehydrogenation reaction ethane(1) ⇄ ethene(2) + hydrogen(3) with MFI catalyst. Fig. 11b compares the ethene concentrations in the gas phase along the length of the fixed zeolite bed at steady-state using the Fick and M–S models. For the Fick model that ignores thermodynamic coupling, the rate of production of ethene is predicted to be 5.4 × 10⁻⁴ mol kg catalyst−1 s−1. The predictions of the M–S model, with either weak or strong confinement, are different by about 10%. Diffusional effects are of lesser importance for small molecules such as H2, C2H4, and C2H6; therefore there is no great penalty for using the simple Fick model for intra-particle transport.
5. Conclusions
The influence of intra-crystalline diffusion on zeolite catalyzed reactions has been examined by combining the Maxwell–Stefan diffusion formulation with Langmuir–Hinshelwood kinetics. The following major conclusions emergence from our study of five different reversible reaction systems.1. Unlike the classical η–ϕ inter-relationship based on Fick's law, the effectiveness factor for zeolite catalyzed reactions is also dependent on the occupancy of the guest molecules within the zeolite pores. Broadly speaking, the higher the total occupancy, the lower the catalyst effectiveness.
2. Thermodynamic coupling effects are of significant importance in the calculation of transient equilibration trajectories for uptake within single zeolite crystals. In all the reaction systems investigated, the more mobile component in the mixture exhibits an overshoot in the uptake. This may imply that supra-equilibrium conversions are achievable during the initial transience. Such overshoots are not realized by use of the Fick model that ignores thermodynamic coupling, i.e. Γij → δij. The equilibration trajectories predicted the Fick and M–S model follow significantly different paths; see Fig. 4 and 5; these differences could have a significant bearing on the selectivity of complex reaction systems.
3. Thermodynamic coupling effects have a significant influence on the conversion and productivity in fixed bed reactors and predictions of the M–S model are at significant variance with that of the Fickian model that ignores coupling. Whether the Fickian model over-predicts, or under-predicts, the productivity of the desired product depends on a variety of factors including the hierarchy of mobilities and adsorption strengths.
4. Transient operations of fixed bed reactors could be exploited to obtain near-pure products during earlier stages of the transience, as illustrated in Fig. 8.
6. Notation
| b i | Langmuir constant for species i, Pa−1 |
| Đ i | M–S diffusivity for molecule–wall interaction, m2 s−1 |
| Đ ij | M–S exchange coefficient for n-component mixture, m2 s−1 |
| Đ i (0) | Zero-loading M–S diffusivity for molecule–wall interaction, m2 s−1 |
| k 1 | Forward reaction rate constant, s−1 |
| k 2 | Backward reaction rate constant, s−1 |
| L | Length of packed bed reactor, m |
| n | Number of species in the mixture, dimensionless |
| n sites | Number of adsorption sites, dimensionless |
| N i | Molar flux of species i with respect to framework, mol m−2 s−1 |
| p i | Partial pressure of species i in mixture, Pa |
| q i | Component molar loading of species i, mol kg−1 |
| q i,sat | Molar loading of species i at saturation, mol kg−1 |
| q t | Total molar loading in mixture, mol kg−1 |
![[q with combining macron]](https://www.rsc.org/images/entities/i_char_0071_0304.gif) i
(t)
i
(t) | Spatial-averaged component uptake of species i, mol kg−1 |
| r | Radial direction coordinate, m |
| r c | Radius of crystallite, m |
| R | Gas constant, 8.314 J mol−1 K−1 |
| R kg | Rate of chemical reaction, mol kg catalyst−1 s−1 |
| t | Time, s |
| T | Absolute temperature, K |
| v | Interstitial gas velocity in packed bed, m s−1 |
| x i | Mole fraction of species i in adsorbed phase, dimensionless |
| z | Distance coordinate, m |
Greek letters
| Γ ij | Thermodynamic factors, dimensionless |
| δ | Thickness of microporous membrane, m |
| δ ij | Kronecker delta, dimensionless |
| ε | Voidage of packed bed, dimensionless |
| η | Effectiveness factor, dimensionless |
| θ i | Fractional occupancy of component i, dimensionless |
| θ V | Fractional vacancy, dimensionless |
| θ is | Fractional occupancy at catalyst surface, dimensionless |
| θ i0 | Fractional occupancy at center of catalyst, dimensionless |
| μ i | Molar chemical potential of component i, J mol−1 |
| νi | Stoichiometric reaction coefficient, dimensionless |
| ξ | Dimensionless radial coordinate, dimensionless |
| ρ | Framework density, kg m−3 |
| τ | Dimensionless time, dimensionless |
| ϕ | Classic Thiele modulus, dimensionless |
Subscripts
| b | Referring to backward reaction |
| c | Referring to crystallite |
| f | Referring to forward reaction |
| i | Referring to component i |
| j | Referring to component j |
| t | Referring to total mixture |
| 0 | Referring to position, ξ = 0. |
| 1 | Referring to species 1 |
| 2 | Referring to species 2 |
| s | Referring to position ξ = 1. |
| sat | Referring to saturation conditions |
| V | Vacancy |
References
- C. Baerlocher, W. M. Meier and D. H. Olson, Atlas of Zeolite Framework Types, Elsevier, Amsterdam, 5th edn, 2002 Search PubMed.
- T. F. Degnan, J. Catal., 2003, 216, 32–46 CrossRef CAS.
- C. Marcilly, J. Catal., 2003, 216, 47–62 CrossRef CAS.
- A. Corma, J. Catal., 2003, 216, 298–312 CrossRef CAS.
- J. Čejka, A. Corma and S. Zones, Zeolites and Catalysis: Synthesis, Reactions and Applications, Wiley-VCH, Weinheim, 2010 Search PubMed.
- W. Vermeiren and J.-P. Gilson, Top. Catal., 2009, 52, 1131–1161 CrossRef CAS.
- B. Yilmaz and U. Müller, Top. Catal., 2009, 52, 888–895 CrossRef CAS.
- A. Primo and H. Garcia, Chem. Soc. Rev., 2014, 43, 7548–7561 RSC.
- O. P. Keipert, D. Wolf, P. Schulz and M. Baerns, Appl. Catal., A, 1995, 131, 347–365 CrossRef CAS.
- Zeolites in Industrial Separation and Catalysis, ed. S. Kulprathipanja, Wiley-VCH, Weinheim, 2010 Search PubMed.
- A. Bhan and M. Tsapatsis, Curr. Opin. Chem. Eng., 2013, 2, 320–324 CrossRef.
- J. Wei, Ind. Eng. Chem. Res., 1994, 33, 2467–2472 CrossRef CAS.
- M. E. Davis, Ind. Eng. Chem. Res., 1991, 30, 1675–1683 CrossRef CAS.
- M. E. Davis, Nature, 2002, 417, 813–821 CrossRef CAS PubMed.
- R. Aris, The mathematical theory of diffusion and reaction in permeable catalysts, Clarendon Press, Oxford, 1975 Search PubMed.
- G. F. Froment, K. B. Bischoff and J. De Wilde, Chemical Reactor – Analysis and Design, John Wiley & Sons, New York, 3rd edn, 2011 Search PubMed.
- O. Levenspiel, Chemical Reaction Engineering, John Wiley, New York, 3rd edn, 1999 Search PubMed.
- R. Jackson, Transport in Porous Catalysts, Elsevier, Amsterdam, 1977 Search PubMed.
- R. Krishna, J. Phys. Chem. C, 2009, 113, 19756–19781 CAS.
- R. Krishna, Chem. Soc. Rev., 2012, 41, 3099–3118 RSC.
- J. Kärger, D. M. Ruthven and D. N. Theodorou, Diffusion in Nanoporous Materials, Wiley-VCH, Weinheim, 2012 Search PubMed.
- N. Y. Chen, T. F. Degnan and C. M. Smith, Molecular transport and reaction in zeolites. Design and application of shape selective catalysts, VCH Publishers, New York, 1994 Search PubMed.
- J. R. Xiao and J. Wei, Chem. Eng. Sci., 1992, 47, 1123–1141 CrossRef CAS.
- J. R. Xiao and J. Wei, Chem. Eng. Sci., 1992, 47, 1143–1159 CrossRef CAS.
- G. Mirth, J. Cejka and J. Lercher, J. Catal., 1993, 139, 24–33 CrossRef CAS.
- N. Hansen, R. Krishna, J. M. van Baten, A. T. Bell and F. J. Keil, J. Phys. Chem. C, 2009, 113, 235–246 CAS.
- R. Krishna and J. M. van Baten, J. Phys. Chem. C, 2012, 116, 23556–23568 CAS.
- R. Krishna and J. M. van Baten, Phys. Chem. Chem. Phys., 2013, 15, 7994–8016 RSC.
- R. Krishna, Microporous Mesoporous Mater., 2014, 185, 30–50 CrossRef CAS.
- R. Krishna, Phys. Chem. Chem. Phys., 2016, 18, 15482–15495 RSC.
- N. Hansen and F. J. Keil, Soft Mater., 2012, 10, 179–201 CrossRef CAS.
- F. Keil, Diffusion und Chemische Reaktionen in der Gas/Festoff-Katalyse, Springer Verlag Berlin Heidelberg New York, 1999 Search PubMed.
- R. Krishna, Ind. Eng. Chem. Res., 2016, 55, 4749–4759 CrossRef CAS.
- R. Krishna and R. Baur, Sep. Purif. Technol., 2003, 33, 213–254 CrossRef CAS.
- R. Krishna and J. M. van Baten, Chem. Eng. Sci., 2008, 63, 3120–3140 CrossRef CAS.
- T. Titze, C. Chmelik, J. Kärger, J. M. van Baten and R. Krishna, J. Phys. Chem. C, 2014, 118, 2660–2665 CAS.
- R. Krishna and J. M. van Baten, J. Membr. Sci., 2013, 430, 113–128 CrossRef CAS.
- R. Krishna and J. M. van Baten, Microporous Mesoporous Mater., 2008, 109, 91–108 CrossRef CAS.
- R. Krishna and J. M. van Baten, Microporous Mesoporous Mater., 2008, 107, 296–298 CrossRef CAS.
- J. M. van Baten and R. Krishna, Microporous Mesoporous Mater., 2005, 84, 179–191 CrossRef CAS.
- R. Baur and R. Krishna, Chem. Eng. J., 2004, 99, 105–116 CrossRef CAS.
- R. Baur and R. Krishna, Catal. Today, 2005, 105, 173–179 CrossRef CAS.
- D. Wang, F. Li and X. Zhao, Chem. Eng. Sci., 2004, 59, 5615–5622 CrossRef CAS.
- S. V. Nayak, P. A. Ramachandran and M. P. Dudukovic, Ind. Eng. Chem. Res., 2012, 51, 1570–1578 CrossRef CAS.
- S. van Donk, A. Broersma, O. L. J. Gijzeman, J. A. van Bokhoven, J. H. Bitter and K. P. de Jong, J. Catal., 2001, 204, 272–280 CrossRef CAS.
- R. Krishna, Chem. Soc. Rev., 2015, 44, 2812–2836 RSC.
- R. Krishna, Curr. Opin. Chem. Eng., 2016, 12, 106–119 CrossRef.
- E. Jolimaître, M. Tayakout-Fayolle, C. Jallut and K. Ragil, Ind. Eng. Chem. Res., 2001, 40, 914–926 CrossRef.
- E. Jolimaître, K. Ragil, M. Tayakout-Fayolle and C. Jallut, AIChE J., 2002, 48, 1927–1937 CrossRef.
- H. Ban, J. Gui, L. Duan, X. Zhang, L. Song and Z. Sun, Fluid Phase Equilib., 2005, 232, 149–158 CrossRef CAS.
- L. Duan, X. Dong, Y. Wu, H. Li, L. Wang and L. Song, J. Porous Mater., 2013, 20, 431–440 CrossRef CAS.
- R. Krishna and R. Baur, Chem. Eng. Sci., 2005, 60, 1155–1166 CrossRef CAS.
- Z. R. Herm, B. M. Wiers, J. M. Van Baten, M. R. Hudson, P. Zajdel, C. M. Brown, N. Maschiocchi, R. Krishna and J. R. Long, Science, 2013, 340, 960–964 CrossRef CAS PubMed.
- N. Hansen, R. Krishna, J. M. van Baten, A. T. Bell and F. J. Keil, Chem. Eng. Sci., 2010, 65, 2472–2480 CrossRef CAS.
- H. A. Jakobsen, Chemical Reactor Modeling. Multiphase Reactive Flows, Springer Verlag, Berlin, Heidelberg, 2008 Search PubMed.
- R. Baur and R. Krishna, Chem. Eng. J., 2005, 109, 107–113 CrossRef CAS.
- H. W. Dandekar, G. A. Funk, R. D. Gillespie, H. A. Zinnen, C. P. McGonegal, M. Kojima and S. H. Hobbs, Process for alkane isomerization using reactive chromatography, UOP Inc., USA., US Pat., US5763730, 1998 Search PubMed.
- H. W. Dandekar, G. A. Funk, R. D. Gillespie, H. A. Zinnen, C. P. McGonegal, M. Kojima and S. H. Hobbs, Process for alkane isomerization using reactive chromatography, UOP, Des Plaines, Illinois, USA., U.S. Pat., US5763730, 1999 Search PubMed.
- H. W. Dandekar, G. A. Funk and H. A. Zinnen, Process for separating and recovering multimethyl-branched alkanes, UOP LLC, Des Plaines, Illinois, USA., U.S. Pat., US6069289, 2000 Search PubMed.
Footnotes |
| † Electronic supplementary information (ESI) available: The ESI provides (a) structural data on commonly used zeolite catalysts, (b) detailed derivations of the Maxwell–Stefan (M–S) equations for intra-crystalline diffusion, (c) background information on the loading dependence of M–S diffusivities, (d) computational modelling of transient uptake within single crystals, (e) computational modeling of transient breakthroughs in fixed bed reactors, (f) input data on adsorption isotherms, and reaction kinetics in the variety of illustrative examples used in this article. See DOI: 10.1039/c7re00001d |
| ‡ Current affiliation: Shell Technology Center Amsterdam, Amsterdam, The Netherlands; E-mail: richard.baur@shell.com |
| § Current affiliation: AmsterCHEM, Almería, Spain; E-mail: jasper@amsterchem.com |
| This journal is © The Royal Society of Chemistry 2017 |

