Shining light on low-temperature methanol aqueous-phase reforming using homogeneous Ru-pincer complexes – operando Raman-GC studies†
Vinzent
Strobel
a,
Julian Jonathan
Schuster
bc,
Andreas Siegfried
Braeuer
bc,
Lydia Katharina
Vogt
d,
Henrik
Junge
d and
Marco
Haumann
 *a
*a
aFriedrich-Alexander-Universität Erlangen-Nürnberg (FAU), Lehrstuhl für Chemische Reaktionstechnik (CRT), Egerlandstr. 3, 91058 Erlangen, Germany. E-mail: marco.haumann@fau.de
bFriedrich-Alexander-Universität Erlangen-Nürnberg (FAU), Erlangen Graduate School in Advanced Optical Technologies (SAOT), Paul-Gordan-Str. 6, 91052 Erlangen, Germany
cFriedrich-Alexander-Universität Erlangen-Nürnberg (FAU), Lehrstuhl für Technische Thermodynamik (LTT), Am Weichselgarten 8, 91058 Erlangen, Germany
dLeibniz-Institut für Katalyse, e. V. an der Universität Rostock, Albert-Einstein Straße 29a, 18059 Rostock, Germany
First published on 21st February 2017
Abstract
A Ru-pincer-based system, which enables methanol dehydrogenation at ambient pressure and temperatures below 100 °C in an aqueous alkaline solution, was investigated as a basis for a possible hydrogen supply process design. A combined in situ liquid-phase Raman spectroscopy with online gas chromatography (GC) analysis of the effluent gas-phase was used to detect the reaction intermediates and effluent gases. Formate (HCOO−) was detected as an intermediate and its qualitative concentration profile could be derived from the Raman spectrograms. In addition, the Raman signal's intensity revealed the initial formation of solid potassium carbonate in the liquid phase, which corresponds with the first detection of carbon dioxide in the gas phase based on the GC results. The combination of in situ Raman spectroscopy and online GC proved to be a powerful experimental setup that provided a holistic view on this complex reaction mechanism.
1. Introduction
The fixation of hydrogen, generated from surplus renewable energy, in organic molecules by means of hydrogenation is an attractive way to store this volatile compound.1–3 Ideally, these hydrogen carrier materials would allow the implementation of renewable energies in the existing infrastructures of today.4 In this respect, one of the most attractive molecules to be hydrogenated is carbon dioxide, which enables the storage of renewable energy to be combined with the removal of this greenhouse gas. Hereby, one concept is the use of the hydrogenation product methanol as an attractive hydrogen carrier,5–7 which could be the basis of an entire “methanol economy” as introduced by Asinger and Olah et al.8,9 In general, methanol can be produced from carbon dioxide and hydrogen by classical heterogeneous catalysis.10 Releasing the stored hydrogen by steam reforming (see Scheme 1) is more difficult. Although the number of molecules increases from two to four, the endothermic nature of this reaction predominates over the entropy gain. Therefore, high temperatures and low pressures are usually required, if heterogeneous catalysts such as Cu/ZnO/Al2O3 or Pt/Al2O3 are utilized.11–14 Furthermore, in classical methanol steam reforming, the high CO content accompanying the produced hydrogen presents an obstacle for direct use in fuel cells.15Recently, a range of noble-metal and base-metal complexes have been successfully employed for the homogeneously catalyzed dehydrogenation of methanol.16–21 Hereby, one of the most active systems operating at a temperature below 100 °C is catalyzed by an aliphatic Ru-pincer complex under highly basic conditions.20 Based on spectroscopic investigations, stoichiometric studies and DFT calculations, an overall mechanistic picture for methanol reforming was proposed.22 As depicted in Scheme 2, the complete aqueous phase reforming (APR) process leads to the consecutive formation of formaldehyde, formic acid and carbon dioxide and the concomitant release of one hydrogen molecule during each step. Under basic reaction conditions the CO2 is initially captured as carbonate. The dehydrogenation of formate to CO2 was determined to be the rate-determining step since it accumulated during the reaction.
Three major roles of the base were postulated: first, it is required for the dehydrochlorination (see Scheme 3) of the precatalyst 1; second, a lower energy pathway is enabled by the formation of H-coordinated intermediates 3H, 4H and 5H and third, by the sequestration of formaldehyde, formic acid and carbon dioxide the key dehydrogenation step is thermodynamically driven forward.
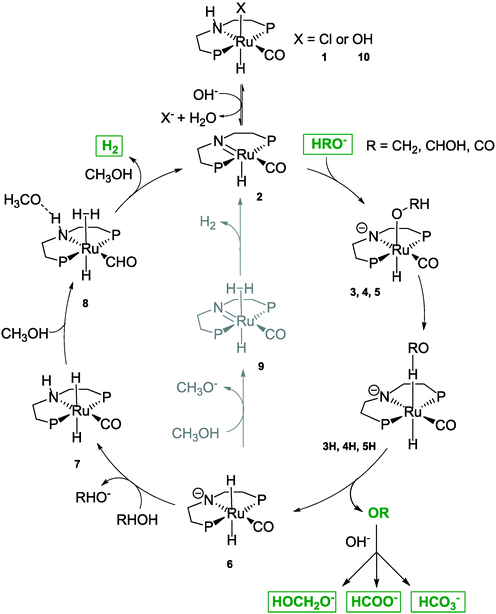 | ||
| Scheme 3 Detailed reaction mechanism adapted from Alberico et al. 2016.22 Full methanol reforming proceeds through three consecutive steps via the formation of the intermediates formaldehyde and formate and the release of carbon dioxide in the final step. Overall, three equivalents of hydrogen are generated. | ||
Although detailed investigations were performed, the proposed mechanism shown in Scheme 3 is not evaluated by operando studies, yet. In addition, a detailed long-term study using concentration profiles of intermediates as well as H2 and CO2 evolution rates is mandatory to evaluate the potential of this reaction with respect to an industrial application. To this end, we combine gas chromatography and Raman spectroscopy within a standard glass reactor in order to study – in operando – the concentration profiles of the MeOH APR system.
2. Experimental section
2.1. Chemicals and catalyst preparation
Pure methanol (Merck Millipore) and potassium hydroxide pellets (Merck, purity of 84%) were used as purchased; distilled water was used without degassing or further purification. The catalyst was prepared as explained in detail in ref. 23. It was stored under argon gas in a Schlenk flask at room temperature until used. For inertization of the reactor and as carrier gas in the gas chromatograph (GC), Varigon He50 was used, a 1![[thin space (1/6-em)]](https://www.rsc.org/images/entities/char_2009.gif) :
:![[thin space (1/6-em)]](https://www.rsc.org/images/entities/char_2009.gif) 1 volumetric mixture of argon (99.999%) and helium (99.999%) purchased from Linde AG. This mixture was chosen to maximize the intensity of the thermal conductivity detector's (TCD) carbon dioxide signal.
1 volumetric mixture of argon (99.999%) and helium (99.999%) purchased from Linde AG. This mixture was chosen to maximize the intensity of the thermal conductivity detector's (TCD) carbon dioxide signal.
2.2. Operando Raman-GC setup
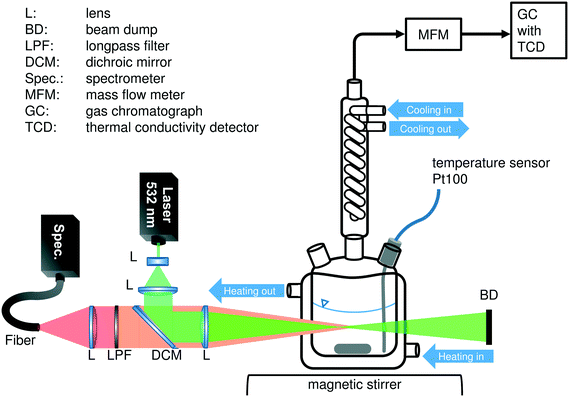
All experiments were performed in a 50 mL jacketed glass reactor with magnetic stirring. Distilled water was used as the heating fluid, circulating through the jacket, because of its low interference with the Raman sensor (see Fig. S4 in the ESI†) and its boiling point, which is high enough to allow a system temperature of 95 °C. The reactor was equipped with a Pt100 temperature probe in the liquid phase, a septum for filling the reactor and a condenser, respectively. Effluent permanent gases were removed via the top end of the reflux condenser in a 3 mm steel capillary. A mass flow meter (MFM, Bronkhorst, EL-FLOW select) in this transfer line recorded the volume flow while the gas composition was analyzed via online GC. For the in situ spectroscopic measurements, an external Raman sensor was installed next to the glass reactor to allow optimal positioning of the laser's focus inside the liquid phase. The entire setup was placed in a covered fume hood in order to avoid the interference of the desired Raman signals with light originating from other light sources. Fig. 1 gives a schematic overview of the experimental setup.In a typical experiment, the reactor was charged with a defined amount of KOH pellets and purged with argon for 10 min to ensure inert conditions. The reactor temperature was set to the desired temperature and the temperature in the condenser was kept at 5 °C while the liquid phase's temperature was being measured. 18 mL of a methanol–water mixture with a volumetric ratio of 9![[thin space (1/6-em)]](https://www.rsc.org/images/entities/char_2009.gif) :
:![[thin space (1/6-em)]](https://www.rsc.org/images/entities/char_2009.gif) 1 was added through the septum and stirred at 700 rpm. The reaction mixture was equilibrated for at least 15 min. Complete degassing and equilibrium were reached when the MFM indicated no mass flow. During this time the Raman sensor was adjusted for the maximum Raman signal with the focus point in the well-stirred part of the liquid phase above the stirrer bar. By adding 2 mL of a catalyst stock solution containing 9
1 was added through the septum and stirred at 700 rpm. The reaction mixture was equilibrated for at least 15 min. Complete degassing and equilibrium were reached when the MFM indicated no mass flow. During this time the Raman sensor was adjusted for the maximum Raman signal with the focus point in the well-stirred part of the liquid phase above the stirrer bar. By adding 2 mL of a catalyst stock solution containing 9![[thin space (1/6-em)]](https://www.rsc.org/images/entities/char_2009.gif) :
:![[thin space (1/6-em)]](https://www.rsc.org/images/entities/char_2009.gif) 1 methanol and water, the reaction was started.
1 methanol and water, the reaction was started.
2.3. Analytics and calibration
The gas phase was analyzed by an Agilent Technologies 7820A gas chromatograph equipped with a GS-GASPRO 30 m × 0.32 mm capillary column and a thermal conductivity detector (TCD). Due to the low expected gas emission the complete gas stream was lead through the GC's sample loop. As mentioned above, a 1![[thin space (1/6-em)]](https://www.rsc.org/images/entities/char_2009.gif) :
:![[thin space (1/6-em)]](https://www.rsc.org/images/entities/char_2009.gif) 1 volumetric mixture of argon and helium was used as the carrier gas in the GC to maximize the CO2 signal in the TCD. The mass flow of the emitted gas phase was detected by the MFM. Though it was originally calibrated for pure hydrogen, the actual mass flow was calculated a posteriori with correction factors from Fluidat® (Fluidat on the Net v1.52, Bronkhorst) and the CO2
1 volumetric mixture of argon and helium was used as the carrier gas in the GC to maximize the CO2 signal in the TCD. The mass flow of the emitted gas phase was detected by the MFM. Though it was originally calibrated for pure hydrogen, the actual mass flow was calculated a posteriori with correction factors from Fluidat® (Fluidat on the Net v1.52, Bronkhorst) and the CO2![[thin space (1/6-em)]](https://www.rsc.org/images/entities/char_2009.gif) :
:![[thin space (1/6-em)]](https://www.rsc.org/images/entities/char_2009.gif) H2 ratio determined from the GC measurements.
H2 ratio determined from the GC measurements.
As the mass flow of the gas phase was determined by the MFM, only the ratio between hydrogen and carbon dioxide had to be measured in the GC. Therefore a self-written MATLAB script was used to integrate the peak areas for hydrogen and carbon dioxide directly from the TCD's raw data. The ratio of the peak areas was used to calibrate the GC. Calibration is within ±2% (see the ESI† for details).
The composition of the liquid phase was qualitatively determined using Raman spectroscopy. Therefore, a self-developed Raman sensor was used, which has already been described in detail elsewhere.24 In short, the laser, installed at the top of the sensor, emitted light with an output power of 250 mW at a wavelength of 532 nm. The laser beam was widened by means of a Galilean telescope system, reflected by a dichroic mirror and focused onto the liquid phase inside the glass reactor. There, the laser light was scattered elastically and inelastically. The backscattered part of these signals was collected and collimated by the focusing lens. While the elastically scattered light was suppressed by the dichroic mirror and a subsequent long pass filter, the desired inelastically scattered Raman signals were focused onto a glass fiber bundle and guided to the spectrometer (QE Pro, Ocean Optics Inc., Dunedin, FL, USA). The spectrometer was equipped with an entrance slit of 25 μm and a grating of 1800 lines mm−1. In the detection wavelength region, the optical resolution was 0.23 nm or 5.8–8.0 cm−1, respectively. In order to identify the chemical components in the liquid phase, the measured spectra were compared with the Raman spectra of possible intermediates known in the literature.25 The Raman signal was not quantitatively calibrated in this work.
3. Results and discussion
Our aim was to develop a flexible experimental setup which enables an in operando investigation of APR processes simultaneously in the gas and liquid phases. To this end we successfully combined Raman spectroscopy and gas chromatography to obtain concentration profiles in both phases. Neutral reforming conditions would lead to a H2![[thin space (1/6-em)]](https://www.rsc.org/images/entities/char_2009.gif) :
:![[thin space (1/6-em)]](https://www.rsc.org/images/entities/char_2009.gif) CO2 ratio of 3
CO2 ratio of 3![[thin space (1/6-em)]](https://www.rsc.org/images/entities/char_2009.gif) :
:![[thin space (1/6-em)]](https://www.rsc.org/images/entities/char_2009.gif) 1 in the effluent gas mixture (see Schemes 1 and 2). However, under the highly basic conditions the formation of H2 preludes the evolution of CO2 because the initially produced CO2 reacts directly with potassium hydroxide to form potassium bicarbonate and carbonate. Thus, it is impossible to obtain the actual reaction rate of this system and to identify its limiting step without knowing the accumulation and the concentration profile of the two intermediates formaldehyde and formate. The use of Raman spectroscopy helps to solve this problem because it can be checked a priori whether the desired component is detectable within a given reaction mixture or not. Indeed, for our MeOH APR process it could be verified that both formate and formaldehyde would provide a uniquely identifiable peak in the spectrum (see Fig. S1 in the ESI† for the spectrum of formaldehyde). Generally, the Raman signals were recorded over time and the different species present in the reaction mixture were assigned to the peaks in the spectra as depicted in Fig. 2.
1 in the effluent gas mixture (see Schemes 1 and 2). However, under the highly basic conditions the formation of H2 preludes the evolution of CO2 because the initially produced CO2 reacts directly with potassium hydroxide to form potassium bicarbonate and carbonate. Thus, it is impossible to obtain the actual reaction rate of this system and to identify its limiting step without knowing the accumulation and the concentration profile of the two intermediates formaldehyde and formate. The use of Raman spectroscopy helps to solve this problem because it can be checked a priori whether the desired component is detectable within a given reaction mixture or not. Indeed, for our MeOH APR process it could be verified that both formate and formaldehyde would provide a uniquely identifiable peak in the spectrum (see Fig. S1 in the ESI† for the spectrum of formaldehyde). Generally, the Raman signals were recorded over time and the different species present in the reaction mixture were assigned to the peaks in the spectra as depicted in Fig. 2.
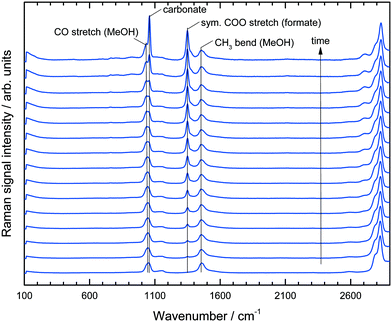 | ||
| Fig. 2 Raman spectra over time of reaction for a duration of 7.5 hours. Each spectra indicates an average of 30 min recording. | ||
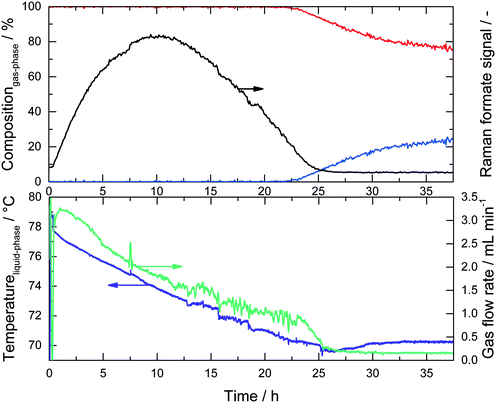
In the region between 800 and 1800 cm−1 two bands for the MeOH substrate could be identified at 1050 cm−1 (CO stretch) and 1450 cm−1 (CH3 bend). Immediately after the start of the reaction a band at 1350 cm−1 appeared and increased steadily over time, which could be assigned to the COO stretching mode of the formate anion.26 At longer reaction times the band intensity at 1080 cm−1, indicating potassium carbonate formation, rapidly increased and shortly afterwards the Raman signal was corrupted due to the coating of the inner reactor wall with solid K2CO3 (see ESI,† Fig. S2). No formaldehyde signal was detected due to the rapid conversion of formaldehyde and water to formate and hydrogen via the geminal diol. This observation is in agreement with previous analysis.16 All spectra in Fig. 2 are normalized to the maximum of the CH3 bending mode at 1450 cm−1. Consequently, the observed composition changes of the liquid phase were relative to the amount of methanol. The concentration of water could not be uniquely identified from the spectra because the weak water bending vibration at approximately 1640 cm−1 was superimposed by the tailing of the CH3 bending vibration at 1450 cm−1. In the given system the implementation of Raman spectroscopy posed a challenge, because under the reaction conditions a three-phase reaction system is present, consisting of a liquid phase, H2-gas bubbles and solid potassium carbonate precipitating in the course of the reaction. Fig. 3 depicts the complete result of a typical experiment in the setup described above. It should be noted that all data points are obtained from the same experiment. The simultaneous measurements of the gas and liquid phases allowed a profound analysis of this complex reaction after only a few experiments.
Upon monitoring the formate peak intensity over reaction time, a clear maximum was observed after approx. 10 h, followed by a decline in its intensity and finally the signal disappeared after 25 hours. While H2 was detected in the online GC right from the start of the reaction (see Scheme 2) no CO2 was detected during the first few hours. Obviously, MeOH is converted into formaldehyde, which is rapidly converted into potassium formate, thus preventing the formaldehyde Raman signal to be detected. Since the decomposition of formate into H2 and CO2 is slower than its formation, it accumulates in the system resulting in the characteristic concentration profile for the intermediate (Fig. 3, black line). The produced CO2 is finally trapped as potassium carbonate as long as there is an excess of KOH present. During this period the boiling temperature of the system (purple line) gradually decreased from its initial value of 78 °C to 71 °C. Analogous to the temperature profile, the gas flow rate decreased within the first 25 hours and reached a steady value of roughly 0.2 mL min−1 thereafter. In the same period, the temperature was stable around 71 °C, which is the boiling point of the liquid phase since KOH was fully consumed (see calculation in the ESI†). Now gaseous CO2 is released and detected via GC resulting in the expected 3![[thin space (1/6-em)]](https://www.rsc.org/images/entities/char_2009.gif) :
:![[thin space (1/6-em)]](https://www.rsc.org/images/entities/char_2009.gif) 1 ratio for H2 and CO2 (Fig. 3, blue line), although now at very low gas flow rates.
1 ratio for H2 and CO2 (Fig. 3, blue line), although now at very low gas flow rates.
Keeping in mind that the reactor wall was kept at a constant temperature of 95 °C, the temperature decrease was caused by a change in the liquid phase's boiling temperature. A reasonable explanation for this change is the KOH consumption, which has a reverse salt effect. The influence of the changed MeOH![[thin space (1/6-em)]](https://www.rsc.org/images/entities/char_2009.gif) :
:![[thin space (1/6-em)]](https://www.rsc.org/images/entities/char_2009.gif) H2O ratio can be neglected, because the total MeOH consumption was calculated to be only about 8 mol% within the first 25 hours.
H2O ratio can be neglected, because the total MeOH consumption was calculated to be only about 8 mol% within the first 25 hours.
The explanation for the drastic decrease in the gas flow rate, and hence the catalytic activity, is more complicated. An obvious factor is the lower temperature, which slows down the kinetics. But, more importantly, the KOH concentration has a significant effect on the catalytic activity as reported by Alberico et al.22 The experiments listed in Table 1 are used to further analyze these effects. The turnover frequencies (TOF) given in Table 1 are calculated by dividing the total moles of H2 produced within 3 (and 10) hours by the molar amount of catalyst. These TOF values themselves and also their trend with increasing basicity are in reasonable accordance with earlier measurements.22 The complete results of entry 1 are shown in Fig. 3 and from entry 2 it becomes obvious that the base has a significant effect on activity with twice the activity observed for double the base concentration. An additional experiment with an 8 M KOH concentration at the boiling temperature did not yield useful results due to the rapid K2CO3 formation inside the reactor. It should be noted that in all experiments a decline in the reaction temperature was observed. Entries 3–5 comprise a base concentration variation of 2, 4 and 8 M KOH under isothermal conditions at 70 °C to investigate the influence of KOH concentration in the absence of temperature changes. The catalyst concentration was lowered from 20 mg to 8 mg compared to entries 1 and 2, to prevent early K2CO3 precipitation.
| Entry | MeOH![[thin space (1/6-em)]](https://www.rsc.org/images/entities/char_2009.gif) : :![[thin space (1/6-em)]](https://www.rsc.org/images/entities/char_2009.gif) H2O (mL H2O (mL![[thin space (1/6-em)]](https://www.rsc.org/images/entities/char_2009.gif) : :![[thin space (1/6-em)]](https://www.rsc.org/images/entities/char_2009.gif) mL) mL) |
Catalyst (mg) | KOH (M) | Temperature (°C) | TOF 3 h (h−1) | TOF 10 h (h−1) |
|---|---|---|---|---|---|---|
| General reaction conditions: 20 mL MeOH/H2O as provided, 42 μmol (20 mg) or 17 μmol (8 mg) catalyst (1 in Scheme 3), 2.25 g (2 M) or 4.49 g (4 M) or 8.98 g (8 M) KOH at the temperature indicated. | ||||||
| 1 | 16![[thin space (1/6-em)]](https://www.rsc.org/images/entities/char_2009.gif) : :![[thin space (1/6-em)]](https://www.rsc.org/images/entities/char_2009.gif) 4 4 |
20 | 2 | 95 (boiling) | 79 | 71 |
| 2 | 16![[thin space (1/6-em)]](https://www.rsc.org/images/entities/char_2009.gif) : :![[thin space (1/6-em)]](https://www.rsc.org/images/entities/char_2009.gif) 4 4 |
20 | 4 | 95 (boiling) | 174 | 146 |
| 3 | 18![[thin space (1/6-em)]](https://www.rsc.org/images/entities/char_2009.gif) : :![[thin space (1/6-em)]](https://www.rsc.org/images/entities/char_2009.gif) 2 2 |
8 | 2 | 70 (68) | 62 | 60 |
| 4 | 18![[thin space (1/6-em)]](https://www.rsc.org/images/entities/char_2009.gif) : :![[thin space (1/6-em)]](https://www.rsc.org/images/entities/char_2009.gif) 2 2 |
8 | 4 | 70 | 52 | 51 |
| 5 | 18![[thin space (1/6-em)]](https://www.rsc.org/images/entities/char_2009.gif) : :![[thin space (1/6-em)]](https://www.rsc.org/images/entities/char_2009.gif) 2 2 |
8 | 8 | 70 | 96 | 95 |
A surprising result is revealed in Fig. 4, which shows the gas flow rates of all experiments. Regardless of their different initial conditions (see Table 1) they all converge to a steady-state gas flow rate of about 0.25 mL min−1. The experiment using the highest base concentration of 8 M KOH was deliberately stopped after 100 hours. Although the steady-state conditions were not reached yet, the green curve very likely converges towards the same gas flow rate of 0.25 mL min−1 after the full consumption of the base. However, due to the higher base amount this will take a significantly longer time. All Raman signals for formate show the same characteristic profiles as shown in Fig. 3 and disappear with the start of the low steady-state gas flow rate (see Fig. S3 in the ESI†). This general trend can be explained again by the consumption of the base, which on the one hand lowers the liquid phase's boiling temperature to roughly 70 °C and on the other lowers the catalyst's activity as the low-energy pathway depicted in Scheme 3 requires a certain base concentration to enable the formation of the deprotonated active catalytic species.
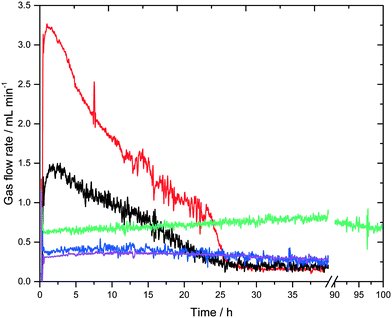 | ||
| Fig. 4 Gas flow rate-profiles of all experiments listed in Table 1. Entry 1 (black), entry 2 (red), entry 3 (purple), entry 4 (blue), entry 5 (green). | ||
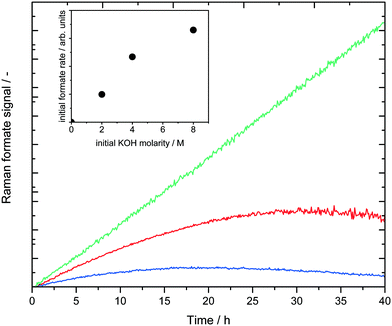
To investigate the influence of the base concentration under isothermal conditions, three different KOH concentrations were tested at 70 °C (entries 3–5 in Table 1). It should be noted that a higher isothermal temperature for this base concentration variation was not possible since the boiling temperature of a 2 M KOH reaction solution is just slightly above 70 °C. Fig. 5 shows the formate Raman signals of the three experiments.
As expected, the initial formate formation rate showed a first order dependency with respect to the base concentration. The linear increase of the green curve even till 40 hours in Fig. 5 may indicate mass transfer limiting phenomena, which were investigated in more depth in the previous mechanistic study.22 Thus, it can be concluded, that the basicity does not only influence the overall activity, but also the rate of formation of the formate intermediate.
4. Conclusion
The aqueous-phase reforming of methanol to generate hydrogen was carried out applying the state-of-the-art homogeneous Ru–PNP-pincer complex 1. A combined Raman and online GC setup was employed to monitor the reaction progress in the reaction mixture containing the catalyst, KOH as the base additive, water and methanol, as well as in the produced gas phase. In particular, Raman spectroscopy allowed the detection of formate as the reaction intermediate, which is in agreement with the postulated mechanism. The formate signals profile reached a maximum, after which consecutive conversion into CO2 and H2 occurred. As long as sufficient KOH was present, the CO2 was trapped as potassium carbonate. These solid precipitate on the inner reactor walls and render Raman analysis more complicated. With ongoing consumption of KOH, free CO2 was detected in the gas phase and the hydrogen to carbon dioxide ratio reached the expected 3![[thin space (1/6-em)]](https://www.rsc.org/images/entities/char_2009.gif) :
:![[thin space (1/6-em)]](https://www.rsc.org/images/entities/char_2009.gif) 1 value. The decrease in KOH concentration was accompanied by a constant loss in catalyst activity, exemplified by the decrease in the gas flow rate over time. When pure CO2 was detected in the GC, indicating that most of the KOH was converted into carbonate, the flow rate reached a low steady state value of about 0.25 mL min−1 which corresponds to a TOF of 40 h−1. This steady-state value was found to be almost independent of the initial KOH concentration. The results of our combined Raman and GC analysis indicate that for high activity, a constant make-up of base is necessary, which has to be implemented carefully into the continuous process design, because the handling of solid K2CO3 precipitation poses a challenge (see Fig. S2 in the ESI†). Alternatively, it has to be investigated if the steady-state reaction rate can be significantly increased under elevated pressure thus enabling higher reaction temperatures.
1 value. The decrease in KOH concentration was accompanied by a constant loss in catalyst activity, exemplified by the decrease in the gas flow rate over time. When pure CO2 was detected in the GC, indicating that most of the KOH was converted into carbonate, the flow rate reached a low steady state value of about 0.25 mL min−1 which corresponds to a TOF of 40 h−1. This steady-state value was found to be almost independent of the initial KOH concentration. The results of our combined Raman and GC analysis indicate that for high activity, a constant make-up of base is necessary, which has to be implemented carefully into the continuous process design, because the handling of solid K2CO3 precipitation poses a challenge (see Fig. S2 in the ESI†). Alternatively, it has to be investigated if the steady-state reaction rate can be significantly increased under elevated pressure thus enabling higher reaction temperatures.
References
- A. F. Dalebrook, W. Gan, M. Grasemann, S. Moret and G. Laurenczy, Chem. Commun., 2013, 49, 8735–8751 RSC.
- U. Eberle, M. Felderhoff and F. Schüth, Angew. Chem., Int. Ed., 2009, 48, 6608–6630 CrossRef CAS PubMed.
- M. Yadav and Q. Xu, Energy Environ. Sci., 2012, 5, 9698–9725 CAS.
- D. Teichmann, W. Arlt and P. Wasserscheid, Int. J. Hydrogen Energy, 2012, 37, 18118–18132 CrossRef CAS.
- D. R. Palo, R. A. Dagle and J. D. Holladay, Chem. Rev., 2007, 107, 3992–4021 CrossRef CAS PubMed.
- A. Boddien, F. Gärtner, M. Nielsen, S. Losse and H. Junge, in Comprehensive Inorganic Chemistry II, Elsevier, Oxford, 2013, ch. 587–603, vol. 6, pp. 587–588 Search PubMed.
- G. A. Olah, Angew. Chem., Int. Ed., 2013, 52, 104–107 CrossRef CAS PubMed.
- G. A. Olah, A. Goeppert and G. K. S. Prakash, Beyond Oil and Gas: The Methanol Economy, 2nd edn, 2009 Search PubMed.
- F. Asinger, Methanol, Chemie- und Energierohstoff, Akademie-Verlag, Berlin, 1987 Search PubMed.
- W. Wang, S. Wang, X. Ma and J. Gong, Chem. Soc. Rev., 2011, 40, 3703–3727 RSC.
- M. Behrens and M. Armbrüster, in Catalysis for Alternative Energy Generation, ed. L. Guczi and A. Erdôhelyi, Springer New York, New York, NY, 2012, pp. 175–235, DOI:10.1007/978-1-4614-0344-9_5.
- B. Lindström, L. J. Pettersson and G. Menon, Appl. Catal., A, 2002, 234, 111–125 CrossRef.
- C.-Z. Yao, L.-C. Wang, Y.-M. Liu, G.-S. Wu, Y. Cao, W.-L. Dai, H.-Y. He and K.-N. Fan, Appl. Catal., A, 2006, 297, 151–158 CrossRef CAS.
- D. R. Palo, R. A. Dagle and J. D. Holladay, Chem. Rev., 2007, 107, 3992–4021 CrossRef CAS PubMed.
- A. Iulianelli, P. Ribeirinha, A. Mendes and A. Basile, Renewable Sustainable Energy Rev., 2014, 29, 355–368 CrossRef CAS.
- E. Alberico, P. Sponholz, C. Cordes, M. Nielsen, H.-J. Drexler, W. Baumann, H. Junge and M. Beller, Angew. Chem., Int. Ed., 2013, 52, 14162–14166 CrossRef CAS PubMed.
- E. A. Bielinski, M. Förster, Y. Zhang, W. H. Bernskoetter, N. Hazari and M. C. Holthausen, ACS Catal., 2015, 2404–2415, DOI:10.1021/acscatal.5b00137.
- J. Campos, L. S. Sharninghausen, M. G. Manas and R. H. Crabtree, Inorg. Chem., 2015, 5079–5084, DOI:10.1021/ic502521c.
- P. Hu, Y. Diskin-Posner, Y. Ben-David and D. Milstein, ACS Catal., 2014, 2649–2652, DOI:10.1021/cs500937f.
- M. Nielsen, E. Alberico, W. Baumann, H. J. Drexler, H. Junge, S. Gladiali and M. Beller, Nature, 2013, 495, 85–89 CrossRef CAS PubMed.
- R. E. Rodríguez-Lugo, M. Trincado, M. Vogt, F. Tewes, G. Santiso-Quinones and H. Grützmacher, Nat. Chem., 2013, 5, 342–347 CrossRef PubMed.
- E. Alberico, A. J. Lennox, L. K. Vogt, H. Jiao, W. Baumann, H. J. Drexler, M. Nielsen, A. Spannenberg, M. P. Checinski, H. Junge and M. Beller, J. Am. Chem. Soc., 2016, 138, 14890–14904 CrossRef CAS PubMed.
- W. Baratta, G. Chelucci, S. Gladiali, K. Siega, M. Toniutti, M. Zanette, E. Zangrando and P. Rigo, Angew. Chem., Int. Ed., 2005, 44, 6214–6219 CrossRef CAS PubMed.
- S. K. Luther, J. J. Schuster, A. Leipertz and A. Braeuer, J. Supercrit. Fluids, 2013, 84, 146–154 CrossRef CAS.
- B. Schrader, Infrared and Raman Spectroscopy: Methods and Applications, Wiley, 2008 Search PubMed.
- K. Ito and H. J. Bernstein, Can. J. Chem., 1956, 34, 170–178 CrossRef CAS.
Footnote |
| † Electronic supplementary information (ESI) available. See DOI: 10.1039/c6re00228e |
| This journal is © The Royal Society of Chemistry 2017 |


