A co-solvent hydrolysis strategy for the production of biofuels: process synthesis and technoeconomic analysis†
Wangyun
Won
 ab,
Ali Hussain
Motagamwala
ab,
James A.
Dumesic
ab and
Christos T.
Maravelias
ab,
Ali Hussain
Motagamwala
ab,
James A.
Dumesic
ab and
Christos T.
Maravelias
 *ab
*ab
aDepartment of Chemical and Biological Engineering, University of Wisconsin-Madison, Madison, WI 53706, USA. E-mail: maravelias@wisc.edu
bDOE Great Lakes Bioenergy Research Center, University of Wisconsin-Madison, 1552 University Ave., Madison, WI 53726, USA
First published on 20th March 2017
Abstract
We develop an integrated strategy for the production of ethanol from lignocellulosic biomass. Cellulose and hemicellulose fractions are first hydrolyzed into sugars using a mixture of γ-valerolactone (GVL), water, and toluene as a solvent containing dilute sulfuric acid as a catalyst, and the sugars are then co-fermented into ethanol over engineered yeast strains. Separation subsystems are designed to effectively recover GVL and toluene for reuse in biomass hydrolysis and to recover lignin and humins for heat and power generation. We also develop an alternative process, in which we recover sugars and GVL from the residual biomass. To minimize utility requirements, we conduct heat integration, which allows us to meet all heating requirements using biomass residues. Finally, we perform a range of system-level analyses to identify the major cost and technological drivers. The proposed strategy is shown to be cost-competitive with other strategies.
1. Introduction
Lignocellulosic biomass is a promising source for sustainable biofuel production to satisfy future energy demands while mitigating greenhouse gas emissions.1,2 Depending on the initial treatment of biomass, the processes for upgrading biomass to fuels and chemicals can be classified into four main groups:3 (1) gasification to produce a syngas intermediate,4–9 (2) thermochemical liquefaction and/or pyrolysis for bio-oil production,10–17 (3) hydrolysis for sugar intermediate production,18–26 and (4) catalytic conversion to produce levulinic acid (LA) and furfural intermediates.27–33 Among these alternatives, biochemical hydrolysis followed by fermentation or dehydration has been investigated extensively.34–39Han et al. (2015)40 proposed a nonenzymatic ethanol production strategy that employs chemical hydrolysis using γ-valerolactone (GVL) and water as a solvent containing a dilute acid catalyst,20 which has a number of advantages over conventional catalytic or enzymatic ethanol production: (1) it uses GVL, which is a biomass-derived renewable solvent,41,42 as a solvent for hydrolysis instead of expensive enzymes; (2) it produces sugars in high yields, leading to high production of ethanol; and (3) it offers flexibility because it leads to sugar intermediates which are compatible with biological or chemical upgrading strategies for a range of high value materials. They reported that their process can produce ethanol more economically than other processes (about $0.14–$0.44 per GGE of difference), such as catalytic alkenes29 and enzymatic ethanol production.36
Despite its advantages, the process reported by Han et al. (2015)40 has shortcomings mostly related to separations. First, a high-pressure CO2-based extraction system, composed of multiple compressors, is employed for the recovery of sugars from the GVL/water solution; it requires about 20% of the total installed equipment cost and 10.3 MW of electricity (for 2000 tons per day of biomass treatment). Second, an energy-intensive GVL evaporator (requires 77.8 MW heating for 2000 tons per day of biomass treatment) is used for the separation of lignin and humins from GVL.
Recently, Motagamwala et al. (2016)43 have developed a new chemical hydrolysis technology that utilizes a mixture of GVL, water, and an organic co-solvent as a solvent containing dilute sulfuric acid as a catalyst. They reported three important features, which can potentially reduce separation costs while retaining the same advantages as the hydrolysis reported by Luterbacher et al. (2014):20 (1) sugar could be produced in high yields, comparable to the case where we only use a mixture of GVL and water as a solvent containing a dilute sulfuric acid catalyst;20 (2) an aqueous phase containing sugars was rendered immiscible with an organic phase by decreasing the temperature, while most of the GVL partitions into the organic phase; and (3) lignin and humins precipitate in the presence of the co-solvent. Among the co-solvents reported by Motagamwala et al. (2016),43 toluene was of particular interest because it has the highest extraction efficiency and a moderate environmental impact.
A potential bottleneck for the practical implementation of the technology described above is the downstream separation sections necessary to recover (1) GVL and toluene for their reuse in biomass deconstruction and (2) sugars to be fermented to ethanol. Accordingly, the purpose of this study is to synthesize a new nonenzymatic ethanol production strategy that addresses these shortcomings.
In the next section, we briefly review the technologies used in our new strategy. Then, in section 3, we propose an integrated process as well as an alternative configuration. In section 4, we present the results of the technoeconomic analysis and compare the proposed strategy with the GVL/water-based nonenzymatic ethanol production40 and enzymatic/biochemical ethanol production.35 Finally, we discuss different excess biomass residue handling strategies and perform sensitivity analyses.
2. Technology review
The strategy proposed in this study integrates a catalytic conversion section for the simultaneous conversion of hemicellulose and cellulose to soluble sugars with sections for the separation of (1) toluene (to be recycled) from an aqueous phase containing lignin, humins, sugars, and GVL, (2) lignin and humins (to be used for heat and electricity generation) from sugars and GVL, and (3) sugars (to be fermented to ethanol) from GVL (to be recycled).2.1. Nonenzymatic sugar production using toluene as a co-solvent
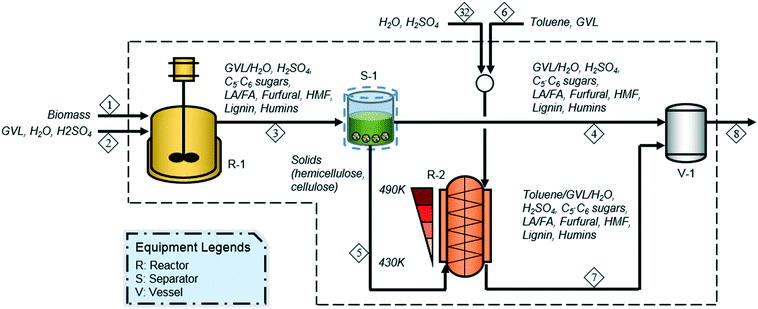
Motagamwala et al. (2016)43 proposed a two-stage reaction system for the chemical hydrolysis of hemicellulose and cellulose to C5 and C6 sugars, using dilute sulfuric acid (SA) as a catalyst and biomass-derived GVL and toluene as solvents, as shown in Fig. 1. Biomass is first treated with a GVL–water (4![[thin space (1/6-em)]](https://www.rsc.org/images/entities/char_2009.gif) :
:![[thin space (1/6-em)]](https://www.rsc.org/images/entities/char_2009.gif) 1 wt%) solvent containing 0.15 M SA for 1 h under mild conditions (390 K, 20.4 atm) with a solvent
1 wt%) solvent containing 0.15 M SA for 1 h under mild conditions (390 K, 20.4 atm) with a solvent![[thin space (1/6-em)]](https://www.rsc.org/images/entities/char_2009.gif) :
:![[thin space (1/6-em)]](https://www.rsc.org/images/entities/char_2009.gif) biomass mass ratio of 4 (R-1 in Fig. 1). In the first reactor, hemicellulose is converted to C5 sugars and furfural in 60.2% and 24.0% molar yields, respectively (reactions 1 and 2 in Table 1), while cellulose is deconstructed to C6 sugars, LA, and 5-hydroxymethylfurfural (HMF) in 10.9%, 3.2%, and 1.4% molar yields, respectively (reactions 4, 5, and 6 in Table 1). Then, the effluent from the first reactor (stream 3) is filtered (S-1) to yield solid and liquid streams. The solid stream (stream 5), containing hemicellulose and cellulose, which are unreacted in the first reaction stage, is transferred to the second reactor for further treatment. The liquid mixture (stream 4) containing xylose, lignin, and furfural, which are soluble in GVL and water, is sent to the holding tank (V-1) where it is mixed with the hydrolyzed slurry (stream 7) discharged from the second reaction stage prior to being routed to the subsequent separation section for the recovery of sugars and biomass residues.
biomass mass ratio of 4 (R-1 in Fig. 1). In the first reactor, hemicellulose is converted to C5 sugars and furfural in 60.2% and 24.0% molar yields, respectively (reactions 1 and 2 in Table 1), while cellulose is deconstructed to C6 sugars, LA, and 5-hydroxymethylfurfural (HMF) in 10.9%, 3.2%, and 1.4% molar yields, respectively (reactions 4, 5, and 6 in Table 1). Then, the effluent from the first reactor (stream 3) is filtered (S-1) to yield solid and liquid streams. The solid stream (stream 5), containing hemicellulose and cellulose, which are unreacted in the first reaction stage, is transferred to the second reactor for further treatment. The liquid mixture (stream 4) containing xylose, lignin, and furfural, which are soluble in GVL and water, is sent to the holding tank (V-1) where it is mixed with the hydrolyzed slurry (stream 7) discharged from the second reaction stage prior to being routed to the subsequent separation section for the recovery of sugars and biomass residues.
| After 1st stage | After 2nd stage | |
|---|---|---|
| Reaction conditions | ||
GVL![[thin space (1/6-em)]](https://www.rsc.org/images/entities/char_2009.gif) : :![[thin space (1/6-em)]](https://www.rsc.org/images/entities/char_2009.gif) water water![[thin space (1/6-em)]](https://www.rsc.org/images/entities/char_2009.gif) : :![[thin space (1/6-em)]](https://www.rsc.org/images/entities/char_2009.gif) toluene mass ratio toluene mass ratio |
4![[thin space (1/6-em)]](https://www.rsc.org/images/entities/char_2009.gif) : :![[thin space (1/6-em)]](https://www.rsc.org/images/entities/char_2009.gif) 1 1![[thin space (1/6-em)]](https://www.rsc.org/images/entities/char_2009.gif) : :![[thin space (1/6-em)]](https://www.rsc.org/images/entities/char_2009.gif) 0 0 |
3![[thin space (1/6-em)]](https://www.rsc.org/images/entities/char_2009.gif) : :![[thin space (1/6-em)]](https://www.rsc.org/images/entities/char_2009.gif) 1 1![[thin space (1/6-em)]](https://www.rsc.org/images/entities/char_2009.gif) : :![[thin space (1/6-em)]](https://www.rsc.org/images/entities/char_2009.gif) 1 1 |
| Solvent to biomass mass ratio | 4 | 16 |
| Sulfuric acid concentration (mM) | 150 | 5 |
| Temperature (K) | 390 | 430–490 |
| Pressure (atm) | 20.4 | 20.4 |
| Yields (%) | ||
| (1) Hemicellulose + H2O → xylose | 60.2 | 64.5 |
| (2) Hemicellulose → furfural + 2H2O | 24.0 | 30.1 |
| (3) Hemicellulose → humins | 4.8 | 5.4 |
| (4) Cellulose + H2O → glucose | 10.9 | 69.6 |
| (5) Cellulose → LA + FA | 3.2 | 10.4 |
| (6) Cellulose → HMF + 2H2O | 1.4 | 4.6 |
| (7) Cellulose → humins | 2.8 | 15.4 |
The remaining biomass, primarily composed of cellulose and some hemicellulose, is then treated with a GVL–water–toluene (3![[thin space (1/6-em)]](https://www.rsc.org/images/entities/char_2009.gif) :
:![[thin space (1/6-em)]](https://www.rsc.org/images/entities/char_2009.gif) 1
1![[thin space (1/6-em)]](https://www.rsc.org/images/entities/char_2009.gif) :
:![[thin space (1/6-em)]](https://www.rsc.org/images/entities/char_2009.gif) 1 mass ratio) solution containing 5 mM SA for 0.67 h at 430–490 K and 20.4 atm, with a solvent
1 mass ratio) solution containing 5 mM SA for 0.67 h at 430–490 K and 20.4 atm, with a solvent![[thin space (1/6-em)]](https://www.rsc.org/images/entities/char_2009.gif) :
:![[thin space (1/6-em)]](https://www.rsc.org/images/entities/char_2009.gif) biomass mass ratio of 16 (R-2 in Fig. 1). The second stage is designed as a vertical counter-current reactor, in which biomass conversion takes place as the solids and the liquid flow in opposite directions with a progressive temperature increase for the solids. The hot liquid (490 K) is driven down the reactor and it cools to 430 K, while the cold solids are progressively heated from 430 to 490 K with the solids moving upward. For more details on a counter-current reactor, readers are referred to Song and Lee (1982)44 and Lee et al. (1999).45 Hemicellulose is converted to C5 sugars and furfural in 38.8% and 55.9% molar yields, respectively, whereas cellulose is converted to C6 sugars, LA, and HMF in 71.9%, 8.8%, and 3.9% molar yields, respectively. The remaining hemicellulose and cellulose are degraded to form humins in 5.4% and 15.4% molar yields, respectively. Based on the liquid collected from both the first and second reactors, soluble C5 and C6 sugars are produced in 64.5% and 69.6% molar yields, respectively (reactions 1 and 4 in Table 1). Soluble degradation products, such as furfural, LA, and HMF, are also formed in 30.1% 10.4%, and 4.6% molar yields, respectively (reactions 2, 5, and 6 in Table 1), while an insoluble degradation product (humins) is produced in 20.7% molar yield (reactions 3 and 7 in Table 1).
biomass mass ratio of 16 (R-2 in Fig. 1). The second stage is designed as a vertical counter-current reactor, in which biomass conversion takes place as the solids and the liquid flow in opposite directions with a progressive temperature increase for the solids. The hot liquid (490 K) is driven down the reactor and it cools to 430 K, while the cold solids are progressively heated from 430 to 490 K with the solids moving upward. For more details on a counter-current reactor, readers are referred to Song and Lee (1982)44 and Lee et al. (1999).45 Hemicellulose is converted to C5 sugars and furfural in 38.8% and 55.9% molar yields, respectively, whereas cellulose is converted to C6 sugars, LA, and HMF in 71.9%, 8.8%, and 3.9% molar yields, respectively. The remaining hemicellulose and cellulose are degraded to form humins in 5.4% and 15.4% molar yields, respectively. Based on the liquid collected from both the first and second reactors, soluble C5 and C6 sugars are produced in 64.5% and 69.6% molar yields, respectively (reactions 1 and 4 in Table 1). Soluble degradation products, such as furfural, LA, and HMF, are also formed in 30.1% 10.4%, and 4.6% molar yields, respectively (reactions 2, 5, and 6 in Table 1), while an insoluble degradation product (humins) is produced in 20.7% molar yield (reactions 3 and 7 in Table 1).
2.2. Separations
Motagamwala et al. (2016)43 showed that the aqueous phase containing sugars was rendered immiscible with the organic phase (toluene) by decreasing the temperature below 425 K. This phase separation leads to an increase in the total soluble sugar concentration in the aqueous phase (about 94.5% of the sugars remain in the aqueous phase), while approximately two thirds of the GVL partitions into the organic phase. This separation leads to a reduction in the size of the downstream processing units and allows the recycling of the organic phase containing GVL back to the biomass deconstruction reactors using a simple liquid–liquid separator. Toluene also renders lignin and humins insoluble in the two liquid phases. Thus, biomass residues can be easily separated from the liquid mixture using a pressurized filter. Following this separation, the GVL that partitions into the aqueous phase is removed using the toluene extractor. To accurately model a liquid–liquid equilibrium (LLE) unit operation for this task, the non-random two-liquid (NRTL) model to calculate the liquid activity coefficients is modified based on LLE experiments (see the ESI† for more details). After GVL is separated from the aqueous phase, toluene and GVL are separated by distillation with GVL as a bottom product. GVL is then recycled to the biomass deconstruction section, and the toluene is reused.3. Process synthesis
3.1. Basic design
Based on the technologies outlined in the previous section, we developed a strategy for the conversion of lignocellulosic biomass to ethanol. The process consists of ten main sections, as shown in Fig. 2: (1) feedstock handling, (2) two-stage biomass conversion, (3) liquid–liquid separation, (4) solid recovery, (5) extraction and toluene separation, (6) fermentation, (7) ethanol purification, (8) wastewater treatment, (9) GVL production, and (10) heat and power generation.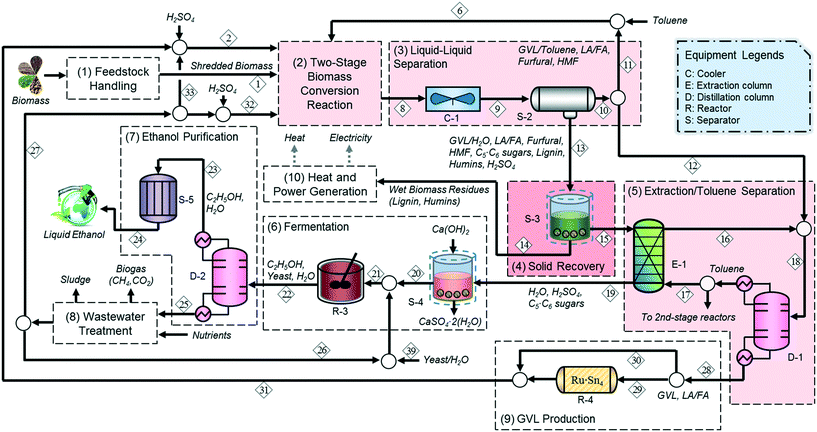 | ||
| Fig. 2 Process flow diagram for the integrated biochemical ethanol production strategy. The major updates on unit operations in the work of Han et al. (2015) are highlighted by the light red boxes. | ||
After physical pretreatment and subsequent chemical hydrolysis, a mixture of biomass deconstruction products (sugars, furfural, LA, FA, HMF, and humins) and SA in GVL–water–toluene solution (stream 8) is sent to a liquid–liquid separator (S-2) after being cooled to 298 K, where it is split into two streams: an organic (stream 10) and an aqueous (stream 13) stream; 64.4% of GVL, 26.7% of furfural, 19.2% of LA/FA, and 41.3% of HMF are recovered in the organic stream (stream 10), whereas 94.3% of sugars and 88.8% of precipitated lignin and humins remain in the aqueous stream containing the SA (stream 13), which is sent to the solid recovery section. Note that the lignin and humins remain in the solid phase in the aqueous stream (stream 13) since a large portion of GVL is recovered in the organic stream (stream 10) along with toluene.46
Following the liquid–liquid separation, 86.3% of the organic stream (stream 11) is diverted to be recycled directly to the second stage reactor in the two-stage reaction section to maintain the required solvent mass ratio (GVL![[thin space (1/6-em)]](https://www.rsc.org/images/entities/char_2009.gif) :
:![[thin space (1/6-em)]](https://www.rsc.org/images/entities/char_2009.gif) water
water![[thin space (1/6-em)]](https://www.rsc.org/images/entities/char_2009.gif) :
:![[thin space (1/6-em)]](https://www.rsc.org/images/entities/char_2009.gif) toluene = 3
toluene = 3![[thin space (1/6-em)]](https://www.rsc.org/images/entities/char_2009.gif) :
:![[thin space (1/6-em)]](https://www.rsc.org/images/entities/char_2009.gif) 1
1![[thin space (1/6-em)]](https://www.rsc.org/images/entities/char_2009.gif) :
:![[thin space (1/6-em)]](https://www.rsc.org/images/entities/char_2009.gif) 1), while stream 12 is sent to the distillation column (D-1) to separate the soluble biomass degradation products from toluene.
1), while stream 12 is sent to the distillation column (D-1) to separate the soluble biomass degradation products from toluene.
To avoid possible fouling, the precipitated biomass residues (humins and lignin) are removed from the solid–liquid separator (S-3) prior to being sent to the subsequent separation section and are burned in the heat and power generation section along with non-recovered GVL (1.5 wt%) and sugars (8.4 wt%) to provide heat and electricity (stream 14). The liquid mixture (stream 15) is then sent to extractor E-1 to recover the GVL remaining in the aqueous phase so that it can be reused in the conversion section. The aqueous phase containing sugars (stream 19) is sent to the fermentation section, whereas the organic phase (stream 16) is sent to the distillation column (D-1) to recover and recycle toluene.
To make up for the loss of GVL, 42.3% of the GVL-rich stream 29 from the distillation column (D-1) is sent to the catalytic bed where LA is converted into GVL using a RuSn4/C catalyst at 493 K and 35 atm with a residence time of 5 min (R-4).46,47 The H2 requirement for the reaction is minimized by utilizing the internal H2 produced from the FA decomposition. The remaining 57.7% of the bottom product in the distillation column (stream 30) bypasses the LA upgrading reactor to meet the desired GVL![[thin space (1/6-em)]](https://www.rsc.org/images/entities/char_2009.gif) :
:![[thin space (1/6-em)]](https://www.rsc.org/images/entities/char_2009.gif) water (4
water (4![[thin space (1/6-em)]](https://www.rsc.org/images/entities/char_2009.gif) :
:![[thin space (1/6-em)]](https://www.rsc.org/images/entities/char_2009.gif) 1) ratio in the first stage reactor of the conversion section.
1) ratio in the first stage reactor of the conversion section.
Prior to sugar fermentation, the stream containing sugars and SA (stream 19) is neutralized using Ca(OH)2, and the precipitated gypsum is removed by filtration (S-4), as described in the NREL report.36 C5 and C6 sugars in the neutralized stream (stream 20) are then diluted with a water-to-feed mass ratio of 0.2 and co-fermented to 7.9 wt% of ethanol (stream 22) over engineered yeast strains (Saccharomyces cerevisiae PE2 (stream 39)) in the fermentor (R-3) in 87% molar yields.20,48 The ethanol (stream 22) is purified using distillation (D-2) with ethanol as a top product followed by molecular sieve adsorption (S-5) for further dehydration up to 99.5 wt%. 84.2% of the bottom liquid (stream 27) from the distillation column (D-2) is recycled to the conversion section, and the remaining fraction (stream 26) is sent to the fermentation section after wastewater treatment.
3.2. Alternative configuration
In addition to biomass residues, stream 14 contains a significant amount of sugars and GVL, so sending it directly to the heat and power generation section leads to a lower fuel yield. Accordingly, we modified the original process (solid recovery section (4) in Fig. 2) by adding water-wash (S-6) and evaporation (S-7) units after the solid–liquid separator (S-3) to recover the sugars and GVL, as shown in Fig. 3. In this configuration, the water evaporator bottom products containing water-dissolved sugars and GVL (stream 37) are sent to the extractor (E-1) along with the aqueous stream from the solid–liquid separator (stream 15). This approach increases the water loading of the downstream processing (and therefore the cost of separation) but also increases the biomass-to-fuel yield. We investigated the performance of the alternative configuration for different evaporation rates, which refer to the percentage of water removed as vapor, and found that a 95 wt% evaporation rate is optimal. | ||
| Fig. 3 Alternative process configuration for the integrated biochemical ethanol production strategy; water-dissolved sugars and GVL are supplied to the liquid–liquid extraction section. | ||
3.3. Heat integration and power generation
A potential drawback of the proposed strategy is the high solvent![[thin space (1/6-em)]](https://www.rsc.org/images/entities/char_2009.gif) :
:![[thin space (1/6-em)]](https://www.rsc.org/images/entities/char_2009.gif) biomass mass ratio (about 11
biomass mass ratio (about 11![[thin space (1/6-em)]](https://www.rsc.org/images/entities/char_2009.gif) :
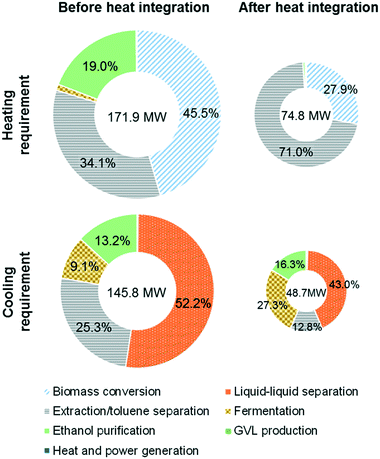
:![[thin space (1/6-em)]](https://www.rsc.org/images/entities/char_2009.gif) 1 overall) in the conversion section leading to a large heating requirement for the separation and recycling of GVL, water, and toluene. In particular, when 2000 tons of corn stover are processed per day, the total heating requirement is 171.9 MW. The energy content of the biomass residues is estimated to be 187.6 MW, which can potentially produce 133.2 MW of heat assuming that the efficiency of the combustor is 71%, which means that the total heating requirements cannot be satisfied by burning the biomass residues.
1 overall) in the conversion section leading to a large heating requirement for the separation and recycling of GVL, water, and toluene. In particular, when 2000 tons of corn stover are processed per day, the total heating requirement is 171.9 MW. The energy content of the biomass residues is estimated to be 187.6 MW, which can potentially produce 133.2 MW of heat assuming that the efficiency of the combustor is 71%, which means that the total heating requirements cannot be satisfied by burning the biomass residues.
To overcome this shortcoming, we performed heat integration, including integration between process streams and unit operations, for all process configurations. For the alternative design, we were able to achieve significant energy recovery (97.1 MW), thereby reducing the heating (cooling) requirements by more than 50% to 74.8 MW (48.7 MW) as shown in Fig. 4 (see the ESI† for the major heat exchanger network and overall energy flow diagram). It is noted that the heating requirements for the reboiler of the toluene/GVL distillation column (53.1 MW) and the second-stage biomass deconstruction reactor (20.9 MW) were not fully covered by heat integration due to their high operating temperatures (430–479 K).
The remaining heating requirements are satisfied by the heat generated from the combustion of the biomass residues. In addition to thermal fluid heating, hot combustion gases are used to produce superheated steam (783 K, 85 atm) for electricity generation. The vapor fraction of the turbine outlet is condensed to avoid compression. The turbine outlet pressure is optimized to maximize heat recovery, i.e. the outlet pressure is 1 atm in the basic design and 1.8 atm in the alternative design, so that the heating requirement for water evaporation (see section 3.2) is met by the condensation of the turbine outlet (see Fig. B.3 in the ESI†). The overall efficiency of power generation (the ratio of net power generation to biomass energy content used for power generation) is 25% for the alternative design. The surplus electricity is sold to the grid.
3.4. Assumptions and process simulation
We developed a process model using Aspen Plus, using thermodynamic parameters and reaction yields based on experimental data. To illustrate the advantages of the proposed co-solvent technology and integrated process, we perform a comparison with the GVL/water-based nonenzymatic ethanol production40 and the enzymatic/biochemical ethanol production35 strategies. Thus, we use the same assumptions and economic parameters (see Table D.1 in the ESI†), as well as the same feedstock and processing rate (2000 dry tons of corn stover per day) assuming that the reaction yields obtained herein hold for the biomass composition used in the NREL report.35 However, we note that adopting the assumptions and parameters from more recent reports34,49 would lead to higher capital costs for all strategies (see Table D.2 in the ESI†).The equipment cost of the liquid–liquid separation, extraction/toluene separation, GVL production, and a part of the two-stage reaction (including pumps) sections was estimated using the Aspen Process Economic Analyzer.50 The equipment cost of the remaining sections was estimated using a scaling expression based on the equipment size and cost data in the NREL report.35 The equipment and utility costs of the heat exchanger network were calculated using the Aspen Energy Analyzer. All equipment and material costs were adjusted to a common basis year of 2007.51 The minimum selling price (MSP), i.e. the ethanol selling price that makes the net present value zero, was calculated using the discounted cash flow methodology used by the NREL35 (see details in the ESI†). In the succeeding section, we will refer to the proposed GVL/water/toluene-based nonenzymatic ethanol production, the GVL/water-based nonenzymatic ethanol production,40 and the enzymatic/biochemical ethanol production35 strategies as strategy A, strategy B, and strategy C, respectively.
4. Results
4.1. Capital and operating costs
Table 2 shows the capital cost breakdown of the basic and alternative designs of strategy A and a comparison with strategies B and C. The total installed equipment cost is computed to be $202.1 million for the alternative design, while the total project investment, which includes other direct (e.g. warehouse and site development) and indirect (e.g. field expenses, home office and permit costs, and project contingency) costs, is estimated to be $371.9 million. The fuel production rates for the different strategies are summarized in the ESI.†| Strategy | Strategy A | Strategy B (Han et al., 2015) | Strategy C (Humbird et al., 2011) | |
|---|---|---|---|---|
| Basic | Alternative | |||
| Pretreatment/biomass conversion | 0.267 | 0.250 | 0.240 | 0.107 |
| Extraction/toluene separation | 0.025 | 0.023 | ||
| Extraction/CO2 separation | 0.160 | |||
| Biochemical conversion | 0.021 | 0.021 | 0.021 | 0.161 |
| Catalytic conversion | 0.002 | 0.001 | 0.001 | |
| Distillation/solid recovery | 0.059 | 0.065 | 0.063 | 0.073 |
| Wastewater treatment | 0.116 | 0.112 | 0.117 | 0.161 |
| Heat and power generation | 0.226 | 0.199 | 0.189 | 0.215 |
| Utilities | 0.015 | 0.013 | 0.016 | 0.022 |
| Storage | 0.016 | 0.016 | 0.016 | 0.016 |
| Total annualized installed equipment cost per GGE | 0.748 | 0.700 | 0.823 | 0.756 |
The total annualized installed equipment cost of the alternative design is lower than that of the basic design mainly because the alternative configuration (1) has a higher fuel production rate (35.7 × 10⁶ GGE per year vs. 38.4 × 10⁶ GGE per year) and (2) requires a smaller heat and power generation section (204.8 MW vs. 187.6 MW), although the cost for distillation and solid recovery is higher due to the additional water-wash and evaporation steps for sugar and GVL recovery. Compared to strategy B, the total annualized installed equipment cost ($ per GGE) of the alternative design is 14.9% lower because the new separation steps are less expensive than the CO2-based separation ($6.8 million vs. $47.8 million), which consist of multiple compressors and vapor–liquid separators operating at 67 atm, despite a 3.5% lower fuel production rate. The capital cost for the alternative design is also lower than that of strategy C primarily because it (1) does not require on-site cellulase enzyme production or enzymatic hydrolysis steps, (2) has smaller wastewater treatment resulting from lower stillage and condensate production during biomass deconstruction and ethanol purification (411![[thin space (1/6-em)]](https://www.rsc.org/images/entities/char_2009.gif) 178 kg h−1vs. 202
178 kg h−1vs. 202![[thin space (1/6-em)]](https://www.rsc.org/images/entities/char_2009.gif) 034 kg h−1 of wastewater), and (3) has a smaller heat and power generation section resulting from smaller by-product streams. The capital cost is lower despite the fact that the cost of the biomass pretreatment in the alternative design is higher than that in strategy C and the fuel production rate of the alternative design is slightly lower than that of strategy C (38.4 × 10⁶ GGE per year vs. 40.2 × 10⁶ GGE per year).
034 kg h−1 of wastewater), and (3) has a smaller heat and power generation section resulting from smaller by-product streams. The capital cost is lower despite the fact that the cost of the biomass pretreatment in the alternative design is higher than that in strategy C and the fuel production rate of the alternative design is slightly lower than that of strategy C (38.4 × 10⁶ GGE per year vs. 40.2 × 10⁶ GGE per year).
Table 3 shows a comparison of the operating costs for the four strategies. The feedstock cost has the largest contribution in all the strategies. The total operating cost of the alternative design is 7.1% lower than that of strategy C mainly due to the absence of enzyme production ($0.294 per GGE) and ammonia for hydrolysate conditioning (included in other raw materials, $0.109 per GGE), despite a 4.4% lower fuel production rate, higher waste disposal cost resulting from a large amount of gypsum precipitating in liming ($5.3 million per year vs. $1.5 million per year), and additional material cost for toluene ($0.023 per GGE) and RuSn4/C (included in other raw materials, $0.010 per GGE). The total operating cost of the alternative design is also slightly lower than that of strategy B primarily because of the lower fixed costs (e.g. salaries, maintenance and property insurance costs), which are calculated based on the total installed equipment cost. The large difference in total operating costs of the basic and alternative designs is mainly due to the difference in the fuel production rates (about 7.0% lower in the basic design).
| Strategy | Strategy A | Strategy B (Han et al., 2015) | Strategy C (Humbird et al., 2011) | |
|---|---|---|---|---|
| Basic | Alternative | |||
| a Waste disposal costs include gypsum disposal following sulfuric acid neutralization during fermentation and other solid waste disposal (e.g. ash removal from the boiler). | ||||
| Glucose | 0.294 | |||
| Toluene makeup | 0.016 | 0.015 | ||
| CO2 makeup | 0.033 | |||
| Sulfuric acid makeup | 0.074 | 0.069 | 0.068 | 0.037 |
| Other raw materials | 0.235 | 0.224 | 0.226 | 0.296 |
| Waste disposala | 0.155 | 0.137 | 0.131 | 0.037 |
| Catalyst regeneration | 0.010 | 0.007 | 0.005 | |
| Utility usage | 0.026 | 0.012 | 0.015 | |
| Fixed costs | 0.284 | 0.268 | 0.304 | 0.266 |
| Feedstock | 1.265 | 1.178 | 1.136 | 1.126 |
| Total operating cost | 2.066 | 1.910 | 1.918 | 2.057 |
4.2. Minimum selling price
Fig. 5 compares the MSPs, calculated using discounted cash flow analysis, where the additional revenue obtained through the sale of surplus electricity is represented by a negative sign. The lowest MSP is $2.95 per GGE for the alternative design of strategy A. Compared to the MSP of the basic design ($3.11 per GGE), the MSP of the alternative design is improved due to a higher fuel production rate, thus outweighing the capital and operating costs of the additional operations. We note that the strategies reported herein (in particular, the alternative design) result in better MSP values than strategy B ($3.37 per GGE). This improvement is because the average total annualized cost of the alternative design ($122.8 million per year) is 10.5% lower than that of strategy B ($137.2 million per year) due to the less expensive toluene-based solvent/solid recovery system operating at atmospheric pressure. Moreover, the revenue obtained from excess electricity sales ($0.25 per GGE) is higher than that of strategy B ($0.08 per GGE). In addition, the MSP for the alternative design is also better than that of strategy C because of the 11.5% lower average total annualized cost resulting from the absence of expensive enzymatic hydrolysis and on-site enzyme production steps and 51.8% higher net electricity surplus, despite 4.4% lower ethanol production.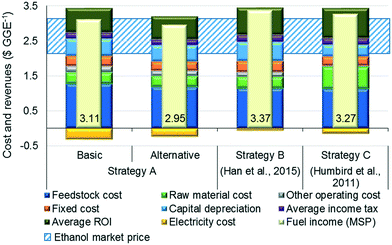 | ||
| Fig. 5 Comparison of costs and revenues of the different strategies ($ per GGE). MSP: minimum selling price. | ||
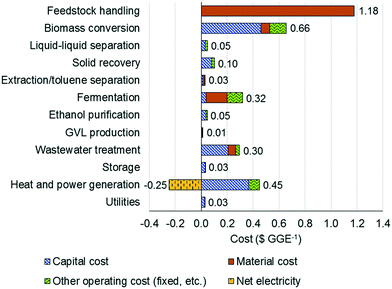
Fig. 6 shows the contribution of individual sections toward the MSP on a $ per GGE basis. The feedstock cost is the highest contributor (included in the feedstock handling section), while the two-stage reaction section is the second highest contributor. The contribution of the capital cost to the reaction cost is found to be significantly higher than those of material and other operating costs.
4.3. Further discussion
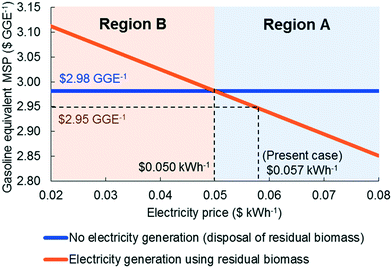
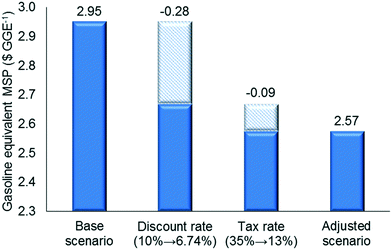
Since the heating requirements of the proposed strategy are significant, the credit from surplus electricity sales is low compared to the total production cost while the cost of the turbo generator is substantial (12.1% of the total installed equipment cost). To study this trade-off, we design an alternative configuration, in which there is no turbo generator and the electricity requirement is met externally and the excess biomass residues are disposed. Fig. 7 shows how the MSPs of the two strategies change with electricity selling price. If the electricity selling price is higher than $0.05 kWh−1 (region A), the installation of a turbo generator is better than the disposal of biomass residues, while the disposal of biomass is a better option if the electricity price is less than $0.05 kWh−1 (region B). It is important to note that although in region B electricity generation using residual biomass is an inferior option from an economical point of view, it leads to lower greenhouse gas (GHG) emissions. We also note that the economics of the option to use a turbo generator can be improved if the renewable identification number (RIN) credit is considered.We also studied the impact of changes in the discount rate and tax rate (Fig. 8) using the values reported recently in the literature, i.e. we decreased the discount rate from 10% to 6.74% and the tax rate from 35% to 13%.52–54 The discount rate has a significant effect on the MSP, while the effect of the tax rate is moderate, because the former affects the annualized capital cost, which is one of the dominant cost drivers. Finally, when all parameters were adjusted simultaneously, the MSP for the proposed strategy decreases to $2.57 per GGE.
5. Conclusions
We developed a novel strategy for the production of ethanol from lignocellulosic biomass by integrating a nonenzymatic chemical hydrolysis technology (using a mixture of GVL/water/toluene as a solvent containing a dilute sulfuric acid catalyst) with new separation subsystems. In addition to the basic design, we proposed an alternative configuration that leads to a higher ethanol production yield. It was shown that the process heating and electricity requirements can be satisfied by the combustion of the residual biomass after heat integration. The combined energy available from the ethanol product and excess electricity is 44.1% of the energy content of the biomass feed. The technoeconomic analysis showed that the MSP of the proposed strategy can be reduced to $2.95 per GGE, which is 12.5% lower than that achieved by the GVL/water-based nonenzymatic ethanol production40 (strategy B), primarily due to the replacement of the expensive CO2-based sugar recovery section and the energy-intensive GVL evaporator with solid recovery with simple and less expensive toluene-based extraction and filtration processes. The MSP of the proposed strategy is also 9.7% lower than that of the benchmark enzymatic strategy35 (strategy C). Finally, we note that the proposed sugar production process can be integrated with other conversion technologies for the production of different bioproducts such as butanol, gasoline and diesel range fuel blendstocks.Acknowledgements
This material is based on the work supported by the DOE Great Lakes Bioenergy Research Center (DOE Office of Science BER DE-FC02-07ER64494).References
- D. M. Alonso, S. G. Wettstein and J. A. Dumesic, Chem. Soc. Rev., 2012, 41, 8075–8098 RSC.
- P. Daoutidis, W. A. Marvin, S. Rangarajan and A. I. Torres, AIChE J., 2013, 59, 3–18 CrossRef CAS.
- G. W. Huber and J. A. Dumesic, Catal. Today, 2006, 111, 119–132 CrossRef CAS.
- A. Dutta, J. Hensley, R. Bain, K. Magrini, E. C. D. Tan, G. Apanel, D. Barton, P. Groenendijk, D. Ferrari, W. Jablonski and D. Carpenter, Ind. Eng. Chem. Res., 2014, 53, 12149–12159 CrossRef CAS.
- M. M. Jung, W. S. Jablonski and K. A. Magrini-Bair, Energy Fuels, 2009, 23, 1874–1887 CrossRef.
- D. L. Klass, Biomass for Renewable Energy, Fuels, and Chemicals, Academic Press, San Diego, 1998 Search PubMed.
- M. Steele, S. Poulston, K. Magrini-Bair and W. Jablonski, Catal. Today, 2013, 214, 74–81 CrossRef.
- L. Wang, C. L. Weller, D. D. Jones and M. A. Hanna, Biomass Bioenergy, 2008, 32, 573–581 CrossRef CAS.
- C. C. Xu, D. Jaclyn, E. Byambajav and Y. Ohtsuka, Fuel, 2010, 89, 1784–1795 CrossRef CAS.
- A. Aho, N. Kumar, K. Eränen, T. Salmi, M. Hupa and D. Y. Murzin, Fuel, 2008, 87, 2493–2501 CrossRef CAS.
- E. Berl, Science, 1944, 99, 309–312 CAS.
- A. Dutta, A. Sahir, E. Tan, D. Humbird, L. J. Snowden-Swan, P. Meyer, J. Ross, D. Sexton, R. Yap and J. Lukas, National Renewable Energy Laboratory Report, NREL/TP-5100-62455, 2015 Search PubMed.
- D. C. Elliott, D. Beckman, A. V. Bridgwater, J. P. Diebold, S. B. Gevert and Y. Solantausta, Energy Fuels, 1991, 5, 399–410 CrossRef CAS.
- A. Lappas, M. C. Samolada, D. K. Iatridis, S. S. Voutetakis and I. A. Vasalos, Fuel, 2002, 81, 2087–2095 CrossRef CAS.
- C. Mukarakate, X. Zhang, A. R. Stanton, D. J. Robichaud, P. N. Ciesielski, K. Malhotra, B. S. Donohoe, E. Gjersing, R. J. Evans, D. S. Heroux, R. Richards, K. Iisa and M. R. Nimlos, Green Chem., 2014, 16, 1444–1461 RSC.
- A. Ruddy, J. A. Schaidle, J. R. Ferrell, J. Wang, L. Moens and J. E. Hensley, Green Chem., 2014, 16, 454–490 RSC.
- J. A. Herron, T. Vann, N. Duong, D. E. Resasco, S. Crossley, L. L. Lobban and C. T. Maravelias, Energy Technol., 2016, 4, 1–22 CrossRef.
- B. Hodge, M. N. Karim, D. J. Schell and J. D. McMillan, Bioresour. Technol., 2008, 99, 8940–8948 CrossRef PubMed.
- H. Kobayashi and A. Fukuoka, Green Chem., 2013, 15, 1740–1763 RSC.
- J. S. Luterbacher, J. M. Rand, D. M. Alonso, J. Han, J. T. Youngquist, C. T. Maravelias, B. F. Pfleger and J. A. Dumesic, Science, 2014, 343, 277–280 CrossRef CAS PubMed.
- J. C. Serrano-Ruiz and J. A. Dumesic, Energy Environ. Sci., 2011, 4, 83–99 CAS.
- P. B. Weisz, W. O. Haag and P. G. Rodewald, Science, 1979, 206, 57–58 CAS.
- F. C. Wu, J. Y. Wu, Y. J. Liao, M. Y. Wang and I. L. Shih, Bioresour. Technol., 2014, 156, 123–131 CrossRef CAS PubMed.
- T. Stein, P. M. Grande, H. Kayser, F. Sibilla, W. Leitner and P. D. María, Green Chem., 2011, 13, 1772–1777 RSC.
- J. Viell, A. Harwardt, J. Seiler and W. Marquardt, Bioresour. Technol., 2013, 150, 89–97 CrossRef CAS PubMed.
- O. Y. Abdelaziz, M. A. Gadalla, M. M. El-Halwagi and F. H. Ashour, Bioresour. Technol., 2015, 181, 321–329 CrossRef CAS PubMed.
- D. M. Alonso, S. G. Wettstein, M. A. Mellmer, E. I. Gurbuz and J. A. Dumesic, Energy Environ. Sci., 2013, 6, 76–80 CAS.
- E. I. Gürbüz, J. M. R. Gallo, D. M. Alonso, S. G. Wettstein, W. Y. Lim and J. A. Dumesic, Angew. Chem., Int. Ed., 2013, 52, 1270–1274 CrossRef PubMed.
- J. Han, S. M. Sen, D. M. Alonso, J. A. Dumesic and C. T. Maravelias, Green Chem., 2014, 16, 653–661 RSC.
- R. Xing, A. V. Subrahmanyam, H. Olcay, W. Qi, G. P. van Walsum, H. Pendse and G. W. Huber, Green Chem., 2010, 12, 1933–1946 RSC.
- S. M. Sen, D. M. Alonso, S. G. Wettstein, E. I. Gürbüz, C. A. Henao, J. A. Dumesic and C. T. Maravelias, Energy Environ. Sci., 2012, 5, 9690–9697 CAS.
- S. M. Sen, E. I. Gürbüz, S. G. Wettstein, D. M. Alonso, J. A. Dumesic and C. T. Maravelias, Green Chem., 2012, 14, 3289–3294 RSC.
- J. Han, S. M. Sen, J. S. Luterbacher, D. M. Alonso, J. A. Dumesic and C. T. Maravelias, Comput. Chem. Eng., 2015, 81, 57–69 CrossRef CAS.
- R. Davis, L. Tao, C. Scarlata, E. C. D. Tan, J. Ross, J. Lukas and D. Sexton, National Renewable Energy Laboratory Report, NREL/TP-5100-62498, 2015 Search PubMed.
- D. Humbird, R. Davis, L. Tao, C. Kinchin, D. Hsu, A. Aden, P. Schoen, J. Lukas, B. Olthof, M. Worley, D. Sexton and D. Dudgeon, National Renewable Energy Laboratory Report, NREL/TP-5100-47764, 2011 Search PubMed.
- F. K. Kazi, J. Fortman, R. Anex, G. Kothandaraman, D. Hsu, A. Aden and A. Dutta, National Renewable Energy Laboratory Report, NREL/TP-6A2-46588, 2010 Search PubMed.
- J. Kim, S. M. Sen and C. T. Maravelias, Energy Environ. Sci., 2013, 6, 1093–1104 CAS.
- M. Sedlak and N. W. Y. Ho, in Proceedings of the 20th Symposium on Biotechnology for Fuels and Chemicals, 2003, pp. 403–416 Search PubMed.
- M. Warzywoda, V. Ferre and J. Pourquie, US Pat., US4762788, 1988 Search PubMed.
- J. Han, J. S. Luterbacher, D. M. Alonso, J. A. Dumesic and C. T. Maravelias, Bioresour. Technol., 2015, 182, 258–266 CrossRef CAS PubMed.
- I. T. Horváth, H. Mehdi, V. Fábos, L. Boda and L. T. Mika, Green Chem., 2008, 10, 238–242 RSC.
- L. Qi, Y. F. Mui, S. W. Lo, M. Y. Lui, G. R. Akien and I. T. Horváth, ACS Catal., 2014, 4, 1470–1477 CrossRef CAS.
- A. H. Motagamwala, W. Won, C. T. Maravelias and J. A. Dumesic, Green Chem., 2016, 18, 5756–5763 RSC.
- S. K. Song and Y. Y. Lee, Chem. Eng. Commun., 1982, 17, 23–30 CrossRef CAS.
- Y. Y. Lee, P. Iyer and R. W. Torget, Adv. Biochem. Eng./Biotechnol., 1999, 65, 93–115 CrossRef CAS.
- S. G. Wettstein, D. M. Alonso, Y. Chong and J. A. Dumesic, Energy Environ. Sci., 2012, 5, 8199–8203 CAS.
- S. G. Wettstein, J. Q. Bond, D. M. Alonso, H. N. Pham, A. K. Datye and J. A. Dumesic, Appl. Catal., B, 2012, 117–118, 321–329 CrossRef CAS.
- M. W. Lau and B. E. Dale, Proc. Natl. Acad. Sci. U. S. A., 2009, 106, 1368–1373 CrossRef CAS PubMed.
- R. Davis, L. Tao, E. C. D. Tan, M. J. Biddy, G. T. Beckham, C. Scarlata, J. Jacobson, K. Cafferty, J. Ross, J. Lukas, D. Knorr and P. Schoen, National Renewable Energy Laboratory Report, NREL/TP-5100-60223, 2013 Search PubMed.
- Aspen Process Economic Analyzer (APEA) V7.3, Aspen Technology Inc., Cambridge, 2011 Search PubMed.
- Chemical Engineering Magazine Plant Cost Index, Chemical Engineering Magazine, http://www.che.com/pci/.
- A. Demirbas, Prog. Energy Combust. Sci., 2007, 33, 1–18 CrossRef CAS.
- J. Q. Bond, A. A. Upadhye, H. Olcay, G. A. Tompsett, J. Jae, R. Xing, D. M. Alonso, D. Wang, T. Zhang, R. Kumar, A. Foster, S. M. Sen, C. T. Maravelias, R. Malina, S. R. H. Barrett, R. Lobo, C. E. Wyman, J. A. Dumesic and G. W. Huber, Energy Environ. Sci., 2014, 7, 1500–1523 CAS.
- G. W. Huber, S. Iborra and A. Corma, Chem. Rev., 2006, 106, 4044–4098 CrossRef CAS PubMed.
Footnote |
| † Electronic supplementary information (ESI) available. See DOI: 10.1039/c6re00227g |
| This journal is © The Royal Society of Chemistry 2017 |

