From bench scale to kilolab production of renewable ferulic acid-based bisphenols: optimisation and evaluation of different purification approaches towards technical feasibility and process environmental sustainability†
A. R. S.
Teixeira‡
 *ab,
G.
Willig‡
ab,
J.
Couvreur
ac,
A. L.
Flourat
ad,
A. A. M.
Peru
ad,
P.
Ferchaud
e,
H.
Ducatel
e and
F.
Allais
 ac
ac
aAgroParisTech, Chaire Agro-Biotechnologies Industrielles (ABI), Centre Européen de Biotechnologie et Bioeconomie (CEBB), 3 Rue des Rouges Terres F-51110, Pomacle, France. E-mail: andreia.teixeira@agroparistech.fr
bUMR GENIAL, AgroParisTech, Inra, Université Paris-Saclay, Massy, France
cUMR 782 GMPA, AgroParisTech, Inra, Université Paris-Saclay, Thiverval-Grignon, France
dUMR 1318 IJPB, AgroParisTech, Inra, Université Paris-Saclay, Versailles, France
eExtractis, 33 Avenue Paul Claudel, 80480 Dury, France
First published on 13th March 2017
Abstract
In an earlier work by the authors, a new class of non-toxic and renewable bisphenols able to substitute bisphenol A and exhibiting potent antioxidant and antiradical activities has been prepared from ferulic acid through chemo-enzymatic pathways at bench scale. Scaling-up a process is not always trivial and straightforward. Technical feasibility of the synthesis and overall process yield must be assessed. All decisions should be justified regarding technical constraints and environmental sustainability. This work is focused on the kilolab production of bis-O-dihydroferuloyl 1,4-butanediol (BDF), one of the very promising renewable bisphenols. Recrystallization and organic diananofiltration in a single stage (SSD) and two stages (TSD) were compared taking into account the previous considerations. As a result, the synthesis and purification of BDF by recrystallization were successfully scaled-up at the kilolab scale, with a significant improvement in the overall yield obtained (from 63% at the labscale to 84% at the kilolab scale) for a purity grade of 95%. To assess organic diananofiltration as an alternative purification method, a set of 6 commercial organic solvent resistant membranes was evaluated. Starting from a solution (1 g L−1) containing 80% (w/w) of BDF and 20% (w/w) of an excess reagent (ethyl dihydroferulate, EtDFe), GMT-oNF1 membrane showed the ability to discriminate them. A two-stage membrane diafiltration (TSD) in cascade was proposed, with a drastic increase in the product yield observed (from 77% in a single stage to 95%) without compromising its final purity (95%). Since solvent recycling has a significant impact on the process sustainability, a nanofiltration step for solvent recovery was assessed. 90% of the solvent was recovered with a level of impurities lower than 1%. Recrystallization and all filtration-based processes were compared in terms of green metrics such as mass and solvent intensity and energy consumption. Results showed that only the integration of solvent recycling in filtration-based processes and the use of a concentrated starting solution (150 g L−1 instead of 1 g L−1) may lead to similar magnitude values observed for recrystallization. Thus, even being a less energetically intensive process (4-fold), the TSD is still a solvent intensive process (3-fold), which is inevitably reflected in a higher environmental footprint (evaluated by LCA).
1 Introduction
Bisphenols are commonly used as additives in polymer matrices given their interesting antioxidant, antimicrobial and plasticizing effects.1,2 Unfortunately, most of them are synthesized from fossil resources and some are known for their ability to migrate from polymer matrices, inducing as a consequence their potential toxicity (e.g. bisphenol A) to humans, mostly related to enhanced mutagenic, endocrine and carcinogenic activities.3,4 Indeed, an increasing global demand for sustainable, non-toxic and renewable building blocks and polymers that could replace the fossil-based ones has been emerging.5 A lot of research effort has been ongoing in order to further explore novel and available renewable resources.Found in all vascular plants, lignins are one of the most abundant and available organic polymers in nature.6 Lignins are composed of three p-hydroxycinnamic monomeric alcohols (aka monolignols) exhibiting various substitutions (p-coumaryl, coniferyl and sinapyl alcohols).7 It has been suggested that ether-linked hydroxycinnamic acids, especially ferulic acid, form bridges between lignin and polysaccharides in cell walls of grasses to ensure the rigidity of biopolymer assemblies.8 Ferulic acid can also be found in several agro-industrial by-products such as wheat and rice brans, sugarbeet pulp and sugarbeet bagasses9 or it can be readily biosynthesized from vanillin.10
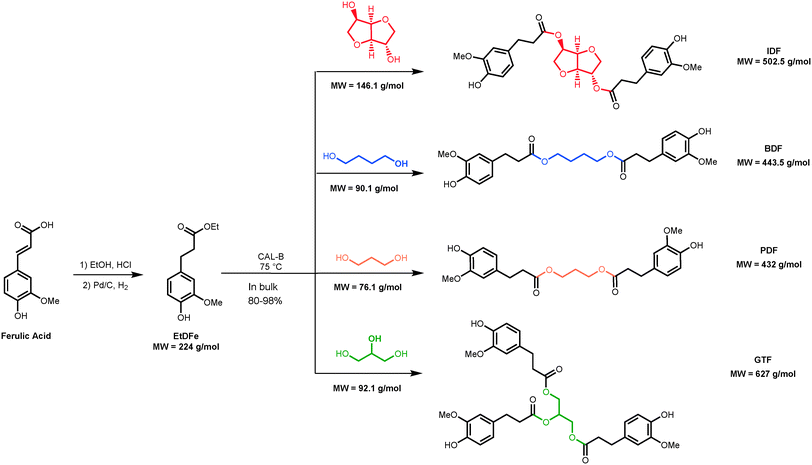
Ferulic acid exhibits antioxidative and photoprotective activities,11 making it a promising raw material for the production of renewable bisphenols through a lipase-mediated process as reported previously by the present authors.12 In this study, ethyl dihydroferulate (EtDFe) – a derivative of ferulic acid – was efficiently esterified with various bio-based aliphatic polyols (i.e. isosorbide, 1,4-butanediol, 1,3-propanediol and glycerol) to produce renewable bisphenols – Fig. 1. The latter showed high antiradical/antioxidant activities similar to that of Irganox® 1010, a widely used commercially available additive in polypropylene.13 Thermal gravimetric analysis (TGA) of such bisphenols highlighted their high thermal stability and the possibility of tailoring their Td by playing with the structure of the bisphenol core. The potentialities of using these bisphenols as eco-friendly and biocompatible antiradical additives in the production of renewable copolyesters,14 poly(ester-urethane)s,15 poly(ester-alkenamer)s,16 epoxy resins17–19 and composites20 are quite promising as a bisphenol A substitute. However, the purification of bisphenols is a step of the utmost importance since it may constrict those valuing pathways. In order to drive the reaction equilibrium towards the production of bisphenols, EtDFe must be in excess (>3 eq. per 1 eq. of polyol), thus its post-reaction removal must be addressed to achieve a final high purity degree of bisphenols.
Flash chromatography on silica gel is an efficient laboratory technique widely applied on the purification of molecules from complex mixtures. This technique was successfully used in the purification of bisphenols at the laboratory scale.12 However, it is difficult to scale-up even at the kilolab scale, involving also high loads of solid waste disposal.21 On the other hand, recrystallization is one of the oldest and most common purification processes employed in the chemical industry. Conventional purification steps include the recrystallization and the precipitation of the target molecule, followed by mother liquor distillation for solvent recovery. Within all the macrobisphenols produced in our laboratory (Fig. 1), bis-O-dihydroferuloyl 1,4-butanediol (BDF) is the only one possible of being efficiently recrystallized with warm methanol.14 However, this technique is known for generating large volumes of solute rich waste (mother liquors) which contains impurities as well as dissolved target molecules up to the saturation limit. Mother liquors are generally discarded as waste and, depending on the target molecule solubility, yield losses can be significant. Indeed, GlaxoSmithKline (GSK) reported that in 2007 less than 50% of all solvents used were recovered and that the majority of waste was still being disposed through on-site incineration.22 For a typical batch chemical process, solvent use can account for as much as 80–90% of the total mass in the process.23 Hence, solvents make a major contribution to both the overall economy and potential toxicity associated with the process. Nevertheless, from an industrial point of view, distillation is the most commonly employed method for solvent recovery mainly due to its operating simplicity and predictability. On the other hand, the main drawback is its high energy demand which it is always a function of the solvent boiling point.
Solvent resistant nanofiltration (SRNF) is a straightforward technology for separating solutes present in an organic solvent (at room temperature) as well as for solvent recovery. This technology is based on molecular weight and since no phase change is needed, the process is energetically less intensive than others, such as recrystallization and distillation.21 The molecular weight (MW) of bisphenols produced in our laboratory varies between 432 and 627 g mol−1 (Fig. 1), while EtDFe, a post-reactant reagent in excess, has a MW of 224 g mol−1. Indeed, these MWs fall in the nanofiltration range.24 Hence, EtDFe permeates through the membrane as the bisphenols are retained, making SRNF a promising platform for bisphenol purification. Constant-volume diafiltration is generally employed for removal of impurities; however, a single membrane unit using currently (and limited) available SRNF membranes leads to a significant trade-off between losses and purity. Indeed, there are two main drawbacks of using such a technique: insufficient separation between solutes when purity is of high importance and high solvent consumption.25 Losses can be overcome by adding stages on the permeate side in combination with retentate recycling, thus employing the membrane cascade concept.26,27 In order to minimize the solvent consumption, an additional nanofiltration step (with a suitable membrane) for solvent recovery can be integrated in the process. Under this context, Kim et al.27 showed the advantages of integrating an additional adsorption step, which leads to significant costs, energy savings and reduction of the carbon footprint. Even if distillation is the most commonly employed method for solvent recovery in industry,23 SRNF has been proposed as a low energy alternative which may be coupled to a distillation unit, thus, using the concept of a hybrid process.28
This article reports on the production of BDF, a renewable bisphenol, at the kilolab scale as well as the evaluation of different purification approaches towards their technical feasibility and environmental sustainability. Energy consumption, solvent intensity and carbon footprint of recrystallization and SRNF were evaluated and compared in detail. Furthermore, the present work also addresses the second major challenge of membrane purification, its extensive solvent consumption. In order to minimize the solvent consumption – i.e. decrease the environmental impact and increase sustainability – an additional step of SRNF was integrated in the process. Finally, a life cycle assessment (LCA) was conducted in order to compare the environmental footprint of recrystallization and different configurations of membrane-based processes.
2 Results and discussion
Synthesis scaling-up and selection of purification technologies to remove post-reaction reagents in excess are not trivial: industrial technical feasibility, economic evaluation, environmental impact, achievable purity grade and product losses must be evaluated to make a compromising decision that leads to a viable manufacturing process. The technical feasibility (synthesis and purification) has to be demonstrated at the lab and kilolab scales, and the selection of operating conditions, solvents and purification methods should be justified through economic and environmental impact factors. In the following sections, all these considerations will be taken into account for the synthesis and purification of BDF by removing the EtDFe, the reactant in excess. The latter was selected within all the bisphenols produced in our laboratory, since it is the only one that is suitable to be purified by flash chromatography, recrystallization and organic solvent nanofiltration, thus, allowing the comparison between them.2.1 Synthesis and purification of BDF at the lab scale
The synthesis of BDF at the lab scale was successfully performed, using the same protocol reported by our group in previous publications.12–16 The reaction was carried-out under vacuum at 1 mbar (considered as medium vacuum). However, the use of such a vacuum may be expensive at the industrial scale and may compromise the economical viability of the process. Therefore, the impact of using a rough vacuum (>1 mbar) on the yield of BDF synthesis must be evaluated.Regarding the overall yield obtained at the lab scale, results showed that it depends on the purification method, thus, in the removal of EtDFe in excess. Indeed, flash chromatography on silica gel eluted with cyclohexane![[thin space (1/6-em)]](https://www.rsc.org/images/entities/char_2009.gif) :
:![[thin space (1/6-em)]](https://www.rsc.org/images/entities/char_2009.gif) AcOEt yields 95% of BDF, with a purity higher than 99% (confirmed by NMR and HRMS, Fig. S2 in the ESI†); while the recrystallization with warm methanol yields 63% of BDF, with a purity of 95% (determined by HPLC, using the BDF produced by flash chromatography as standard). As it can be seen, flash chromatography shows an ideal, almost 100% purification level, at the cost of only a 5% loss of BDF. However, it is the most difficult technique to scale-up even at the kilolab scale and involves high loads of solid waste disposal.21 On the other hand, recrystallization is one of the oldest and most common purification processes employed in the chemical industry. It shows higher product loss (37%), although with an acceptable compensation in the purity achieved (95%, determined by HPLC, using the BDF produced by flash chromatography as standard). This means that recrystallization is a suitable purification method for the scale-up since despite its drawbacks, such as impurity carryover and loss of the product in mother liquor and washing solutions, it still delivers the product in a desired purity and in a crystalline form.
AcOEt yields 95% of BDF, with a purity higher than 99% (confirmed by NMR and HRMS, Fig. S2 in the ESI†); while the recrystallization with warm methanol yields 63% of BDF, with a purity of 95% (determined by HPLC, using the BDF produced by flash chromatography as standard). As it can be seen, flash chromatography shows an ideal, almost 100% purification level, at the cost of only a 5% loss of BDF. However, it is the most difficult technique to scale-up even at the kilolab scale and involves high loads of solid waste disposal.21 On the other hand, recrystallization is one of the oldest and most common purification processes employed in the chemical industry. It shows higher product loss (37%), although with an acceptable compensation in the purity achieved (95%, determined by HPLC, using the BDF produced by flash chromatography as standard). This means that recrystallization is a suitable purification method for the scale-up since despite its drawbacks, such as impurity carryover and loss of the product in mother liquor and washing solutions, it still delivers the product in a desired purity and in a crystalline form.
2.2 Synthesis and purification of BDF at the kilolab scale
The synthesis of BDF at the kilolab scale was successfully carried out, using this time a rough vacuum (250 mbar). The use of such vacuum eliminates an economical restraint for the scale-up at the industrial scale.In order to increase the environmental sustainability, greener solvents for recrystallization were tested (data not shown) and applied to the purification of BDF at the kilolab scale. BDF was purified by recrystallization with warm ethanol yielding a BDF production of 84.4%, with a purity of 94.9% (determined by HPLC – Fig. S5 in the ESI;† and the structure was confirmed by NMR – Fig. S3 in the ESI†). The improvement of yield production to 22%, without compromising the purity grade by using a greener solvent, confirms the technical feasibility of BDF synthesis and purification at the kilolab scale. However, it should be highlighted that within all the bisphenols produced in our laboratory (Fig. 1), BDF is the only one possible of being efficiently recrystallized. Thus, an alternative purification method, easily to implement at the industrial scale is highly demanded.
To develop the purification process based on this emerging technology, several SRNF membranes were evaluated (Table 1) at different transmembrane pressures (ΔP). The membrane with the best performance in discriminating BDF (443.5 g mol−1) from EtDFe (224 g mol−1) was tested using two different configurations: single stage diafiltration (SSD) and two-stage diafiltration (TSD). It should be noted that BDF is one of the bisphenols with the lowest MW (Fig. 1) within all the bisphenols produced in our laboratory, thus, the difference of its MW with EtDFe is the lowest. This means that a membrane suitable for BDF purification should be also more efficient in purifying the other macrobisphenols.
| Membrane | Manufacturer | T max (°C) | P max (bar) | Cut-offa (g mol−1) | Active layer |
|---|---|---|---|---|---|
| a Defined as the molecular weight of a molecule that has a 90% rejection (R) by the membrane. b NS: Not specified. | |||||
| Duramem 150 | Evonik Industries | 50 | 60 | 150 (in acetone) | Modified polyimide |
| Duramem 200 | Evonik Industries | 50 | 60 | 200 (in acetone) | Modified polyimide |
| Duramem 300 | Evonik Industries | 50 | 60 | 300 (in acetone) | Modified polyimide |
| Duramem 500 | Evonik Industries | 50 | 20 | 500 (in acetone) | Modified polyimide |
| GMT-oNF1 | GMT Membrantechnik | 60 | 35 | 327 (R = 88%, in 2-propanol) | Polydimethylsiloxane (PDMS) |
| GMT-oNF2 | GMT Membrantechnik | 60 | 35 | 327 (R = 93% in 2-propanol) | PDMS |
| Nano 450 | Inopor® | NSb | NS | 450 (in water) | TiO2 |
2.2.1.1 Membrane evaluation. Six commercial SRNF membranes from different manufacturers were selected, namely Duramem 200, 300 and 500 from Evonik (U.K.); GMT-oNF1 and GMT-oNF2 from GMT Membrantechnik (Germany) and Nano 450, a TiO2 ceramic membrane from Inopor® (Germany) – Table 1. They were tested in a cross-flow system and in total recirculation operating mode. Acetone was selected as solvent, given the high solubility of bisphenols in acetone and its low price. These membranes are claimed to be acetone resistant, therefore, after compaction, they were tested in terms of flux at different transmembrane pressures (ΔP) using acetone (Fig. 2a) and, afterward, using an acetone-based solution at a concentration of 1 g L−1, containing 20% (w/w) of EtDFe as impurity – Fig. 2b.
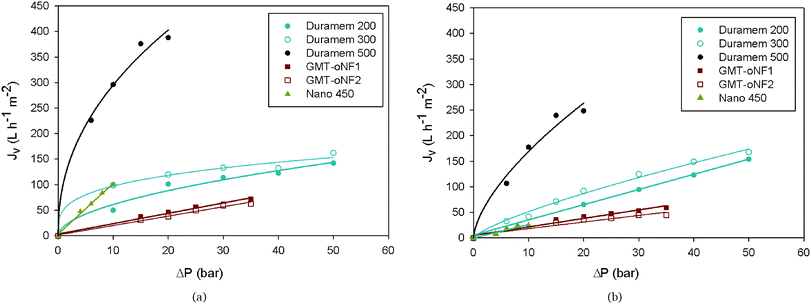 | ||
| Fig. 2 Effect of pressure on the membrane flux using (a) acetone and (b) in an acetone-based solution at a concentration of 1 g L−1, containing 80% (w/w) of BDF and 20% (w/w) of EtDFe. See fitting equations and regression coefficients in Tables S1 and S2 in the ESI.† | ||
As it can be observed in Fig. 2a, the membranes with the highest acetone fluxes (Duramem 500 and Nano 450) are the ones with a higher cut-off (defined as the molecular weight of a molecule that has a 90% rejection by the membrane, see Table 1). All membranes presented a linear relationship between the flux and transmembrane pressure (as expected using Darcy's equation, eqn (1)), except for the Duramem membranes (Fig. 2). The non-linearity phenomenon was already reported by other authors,30–32 being related to the effect of the compaction procedure on the effective membrane thickness. It was postulated that the increase of the transmembrane pressure makes the top layer penetrate into the supporting porous structure, creating as a consequence a new sublayer that contributes additionally to the resistance of the membrane.
On the other hand, as expected, the membrane fluxes observed in BDF solutions were lower than the ones with pure acetone (Fig. 2) most likely due to the presence of foulant compounds. However, this decrease is more obvious in membranes with a higher cut-off.
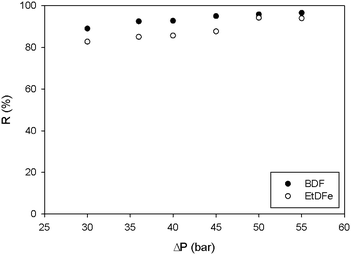
Fig. 3 compares the performance of each membrane in the separation of BDF from EtDFe. Duramem 200, GMT-oNF1 and GMT-oNF2 are the membranes with higher BDF rejection (98.7% at 50 bar, 96.4% and 96.5% at 35 bar, respectively). Within these membranes, GMT-oNF1 and GMT-oNF2 are the ones with the lower EtDFe rejection (70.2% and 71.0% at 35 bar, respectively), thus, leading to a better discrimination between those compounds. Furthermore, for both membranes, it can be seen that the variation of BDF rejection with the pressure increase is not significant (lower than 5%); but the rejection of EtDFe is highly dependent on the transmembrane pressure, varying up to 25%. On the other hand, flux is also a factor to be taken into account for membrane selection since it reflects the solvent consumption in the diafiltration.
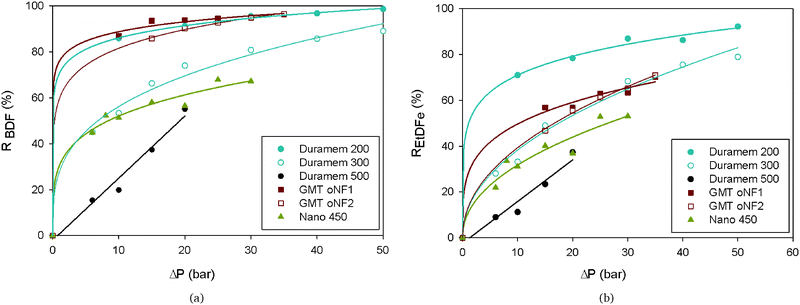 | ||
| Fig. 3 Effect of pressure on the membrane rejection (R) of (a) BDF and (b) EtDFe, in an acetone-based solution at a concentration of 1 g L−1, containing 80% (w/w) of BDF and 20% (w/w) of EtDFe. See fitting equations and regression coefficients in Tables S3 and S4 in the ESI.† | ||
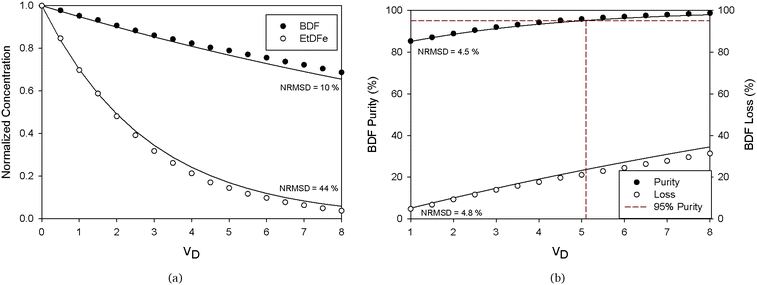
The use of mass-based model equations (see Appendix A, eqn (8)) along with the experimental BDF and EtDFe rejections and membrane flux enabled the prediction of species concentration during diananofiltration. Differential equations were solved for a 95% purity grade of BDF (eqn (3)) and the respective loss of BDF (eqn (4)) and the amount of fresh acetone to be added to the feed tank (expressed as a number of volumes of diananofiltration, VD) determined. These simulations (Table 2) show that GMT membranes present a similar result at 35 bar in terms of BDF loss (18%). However, the membrane GMT-oNF1 needs a lower amount of acetone to obtain a same purity grade of 95% (VD = 5.1), presenting in addition a behavior more regular with the pressure. Therefore, GMT-oNF1 was the membrane selected for the following diafiltration experiments. According to this simulation, 5.1 volumes of diananofiltration would be needed to obtain a 95% purity grade, resulting in a BDF loss of 18.4%.
2.2.1.2 Single stage diafiltration (SSD). Fig. 4 compares the experimental data and the simulation of the normalized concentration profiles of BDF and EtDFe and the performance of membrane separation (purity and loss of BDF), during the diananofiltration. Since the NRSM of the prediction is within the acceptable experimental errors values (<10%), we may conclude that the modeling values are in good agreement with the experimental data. Therefore, all the model assumptions (constant flux and constant rejections) proved to be adequate to describe the physical system. The only exception is for the concentration of EtDFe at higher diafiltration volumes, where the extremely small values induce high errors in the prediction.
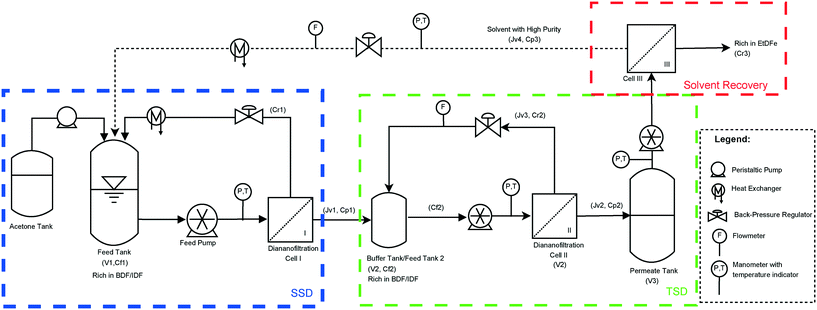
A single stage diafiltration leads to a product loss of 23% for achieving a 95% purity grade (comparable to the one obtained using recrystallization at the kilolab scale, 16%). However in the case of diafiltration, losses can be overcome by adding stages on the permeate side in combination with retentate recycling, thus, employing the membrane cascade concept (see the Experimental section, Fig. 11).
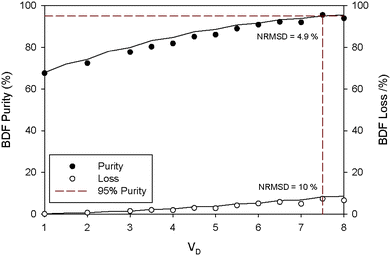
2.2.1.3 Two stage diafiltration (TSD). A mathematical model describing the TSD process was simulated (see Appendix A) in order to predict the process performance. Fig. 5 shows that the simulation is in good agreement with the experimental data (NRSM <10%). Furthermore, it can be seen that operating with two stages can lead to a significant improvement in terms of BDF depletion from the feed solution. Indeed, to obtain 95% purity grade of BDF (determined by HPLC – Fig. S5 in the ESI† – and the structure confirmed by NMR, Fig. S4 in the ESI†), only 5% of the initial amount of BDF will be lost (instead of the 23% obtained with the SSD configuration). Hence, the TSD configuration provides substantial improvement relative to the SSD configuration. This improvement is, however, accomplished with a use of a larger number of diananofiltration volumes (7.5 instead of 5.1 volumes) and expected higher operating and capital investment costs associated with a more complex process design.
In order to warrant the process sustainability, the possibility of solvent recycling should be exploited. Hence, the use of an additional nanofiltration step has been assessed.
2.2.1.4 Solvent recovery. The final permeate waste stream is composed of 60% (w/w) of EtDFe in a concentration of 16 mg L−1 and 40% (w/w) of BDF in a concentration of 11 mg L−1 (both determined by HPLC). These concentrations are quite low, and as a consequence, the efficiency of an additional nanofiltration step may be compromised since the membrane rejection decreases under diluted conditions. Duramem 150 was the selected membrane to carry-out the acetone recovery. Even the fact that its acetone flux is quite low compared to other membranes (Jv = 12 L h−1 m−2 at 50 bar), the Duramem 150 membrane is the one with the lowest cut-off within the set of membranes available (see Table 1).
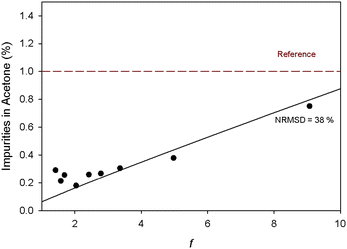
Fig. 6 shows that to obtain an acetone with a low percentage of impurities (<1%), the transmembrane pressure must be set at 50 bar, where the rejections of BDF and EtDFe are higher. Under these conditions, the permeate obtained after TSD was concentrated at least 10 times (f = 10). A mathematical model describing the concentration process was simulated (see Appendix B) in order to predict the process performance in terms of solvent purity as a function of the factor concentration (f).
Fig. 7 shows that the simulated values are not in agreement with the experimental data (NRSM = 38%), which may related with the extremely low concentration of impurities to be predicted and a small deviation may lead to high prediction errors. However, it may be observed that it is possible to recover 90% of the solvent used in the diafiltration with a level of impurities lower than 1%. Furthermore, the unreacted EtDFe recovered in the retentate (40% w/w) may probably be reused in the following reaction batches for BDF production. However, the impact of the presence of BDF (reaction product) in the production yield must be evaluated.
2.3 Green metrics and life cycle assessment (LCA)
Green metrics are values calculated from a single defined equation. Examples of metrics used are the E-factor33 which is defined as the kilograms of waste generated per kilogram of product (eqn (6)) and the solvent intensity34 which is defined as the kilograms of solvents used (excluding water) per kilogram of product (eqn (5)). Both may be used to compare different processes. Table 3 shows the metric values calculated for recrystallization and the SRNF-based processes (SSD, TSD and TSD + solvent recovery) as well as the energy intensity of each process which is defined as the energy consumption (kW h) per kilogram of product.| Process | Energy intensity | Solvent intensity | E-factor |
|---|---|---|---|
| a Calculated for a starting acetone-based solution of 1 g L−1 of BDF. b Assuming 90% of solvent recovery. c Calculated for a starting acetone-based solution of 150 g L−1 of BDF. | |||
| Recrystallization | 1.81 | 9.3 | 7.3 |
| SSDa | 0.14 | 6506 | 5609 |
| TSDa | 0.29 | 8705 | 5957 |
| TSDa + SRb | 36.7 | 3345 | 596 |
| SSDc | 0.10 | 82.5 | 76.4 |
| TSDc | 0.09 | 88.6 | 70.3 |
| TSD + SRb | 0.43 | 25.3 | 7.0 |
As it can be seen in Table 3, the SSD and TSD processes are less energetically intensive purification methods than recrystallization; however the use of diluted starting feed solutions in filtration-based methods (i.e. 1 g L−1 of BDF) leads to a high solvent consumption as well as the generation of high volumes of wastes (measured as the E-factor). Indeed, even taking into account the additional solvent recovery step (TSD + SR), the large use of solvent to be recovered will be reflected in the increase of the energy demand. So, in order to achieve metric values for filtration-based methods in the same magnitude of recrystallization, the starting solution should be higher. Knowing that the solubility of the starting solution (containing 80% w/w of BDF and 20% w/w of EtDFe) in acetone at room temperature is 170 g L−1 (own measurements), firstly, we must assure that the membrane separation efficiency and, secondly, that the membrane flux at 35 bar are not affected if solutions with high solute concentrations are processed.
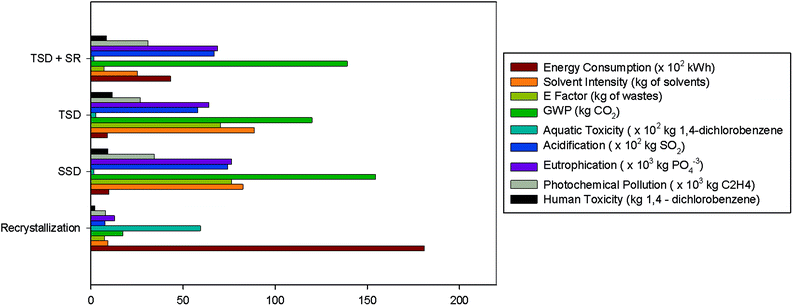
Fig. 8 shows how the latter factors are affected if using higher solution concentrations. As expected, the membrane flux (Jv) decreased along with the solution concentration increase and the discrimination between BDF and EtDFe membrane rejections (R) decrease. This means that the membrane performance must be sacrificed in order to achieve a more environmentally sustainable process (Fig. 9). Indeed, the solvent recovery and the use of a higher starting solution concentration allow achievement of environmental impact values more comparable to recrystallization.
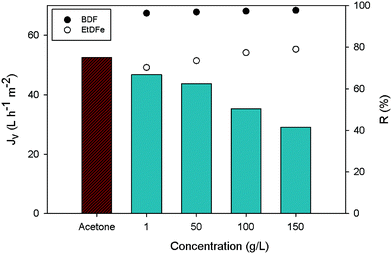 | ||
| Fig. 8 Membrane flux at 35 bar and different solution concentrations (bar chart). Points represent the membrane rejection (R) for BDF and EtDFe. | ||
In such a scenario of solvent recovery (Table 3 and Fig. 9), the TSD + SR becomes not only a less energetically intensive purification method (4-fold) than recrystallization, but also achieves the same mass of waste generated (E-factor = 7). Even so, the solvent intensity remains higher (3-fold), confirming, once more, that diafiltration is a solvent intensive technique. On the other hand, it is interesting to compare the difference of the mass of waste (E-factor) to be removed through solvent recovery between SSD and TSD alone (without solvent recovery). In that case, the total waste generated by using SSD and TSD alone is, respectively, 10 and 11-fold higher than in the scenario where the solvent recovery is taken into account (TSD + SR). This observation highlights the importance of the solvent recovery in intensive techniques.
The calculation of environmental footprint (Fig. 9) takes into account the solvent incineration as well as the steam and fossil energy needed for the overall process. However, the main impact comes from the solvent incineration, where the impact from using steam and electricity is less than 1% of the overall footprint (data not shown). This means that even if recrystallization is a more energetically intensive process, it is still a more environmental sustainable process for most of the environmental indicators, since it is less solvent intensive.
3 Conclusion
The synthesis and purification of BDF, a renewable bisphenol able to substitute bisphenol A with potent antioxidant and antiradical activities, were successfully scaled-up at the kilolab scale, with a significant improvement in the overall yield obtained from the lab to the kilolab scale (from 68% to 84%, respectively) for a similar purity grade of 95% and using recrystallization as the purification method. Recrystallization was shown to be a suitable purification method at the kilolab scale and is easily scalable. However, such a method is based on the difference of solubility in different solvents between the target molecule and impurities, which means that the purification of other bisphenols (such the other ones produced in our laboratory, Fig. 1) is not technically feasible.Solvent resistant nanofiltration (SRNF) is a straightforward and readily scalable purification technology based on the difference of molecular weight between solutes and impurities. A two-stage membrane cascade configuration (TSD) using the GMT-oNF1 membrane was proposed and applied which drastically increased the product yield (from 77% to 95%) without compromising its final purity (95%). Therefore, TSD showed to be suitable to purify BDF with a higher yield than recrystallization (95% compared to 84%). However, even being a less energetically intensive process (6-fold), it consumes a much larger volume of solvent. In order to overcome such a drawback, the solvent recovery was assessed by using an additional nanofiltration step (with Duramem 150 membrane). This procedure allowed the recovery of 90% of the solvent with a level of impurities lower than 1%.
A comparison of green metrics (E-factor, energy and solvent intensities) between recrystallization and filtration-based processes showed that only the use of a concentrated starting solution in filtration-based processes (150 g L−1 instead 1 g L−1) may lead to similar magnitude values. However, the environmental footprint of filtration-based methods is still higher due to solvent consumption (even considering the additional solvent recovery step). Of course, the selection of a technology for purification will also depend on economic and technical constraints. Even so, once technology selected, LCA may help us in taking decisions to minimize the environmental footprint such as process design and favorable starting solution concentration.
4 Experimental section
4.1 Reagents
Candida antarctica lipase B (CAL-B) immobilized on acrylic resin (Novozymes® 435) was purchased from Univar (Fontenay sous Bois, France). The activity of this lipase, as indicated by the supplier, is >9000 U g−1 of solid, which was experimentally confirmed as being 9312 U g−1. The protocol to determine the enzymatic activity was provided by the manufacturer (Novozymes). One PLU unit is defined as the amount of enzyme which, under standard conditions (i.e. at 60 °C and a reaction time 15 minutes), forms 1 μmole of propyl laurate per minute. Analytical-grade 1,4-butanediol (Alfa Aesar, 99%), hydrochloric acid (37%), technical-grade acetone and ethanol (96%) were obtained from VWR Chemicals. Ferulic acid (1) and Pd/C were purchased from Sigma Aldrich and deuterated chloroform (CDCl3) from Euriso-top.4.2 Membranes
Six commercial organic SRNF membranes from different manufacturers were selected, namely the Duramem 150, Duramem 200, Duramem 300 and Duramem 500 from Evonik (U.K.) and GMT-oNF1 and GMT-oNF2 from GMT Membrantechnik (Germany). A TiO2 ceramic membrane from Inopor® (Germany) with a cut-off of 450 Da (Nano 450) was also tested. Table 1 compiles the most relevant information of each membrane provided by their respective manufacturer.4.3 Methods
![[thin space (1/6-em)]](https://www.rsc.org/images/entities/char_2009.gif) :
:![[thin space (1/6-em)]](https://www.rsc.org/images/entities/char_2009.gif) AcOEt 90
AcOEt 90![[thin space (1/6-em)]](https://www.rsc.org/images/entities/char_2009.gif) :
:![[thin space (1/6-em)]](https://www.rsc.org/images/entities/char_2009.gif) 10 to obtain a white powder of EtDFe (245 g, 85%, m.p. 42 C). UV: λmax (THF, nm) 230, 284 and 325. NMR: δH (300 MHz; CDCl3) 1.23 (3 H, t, 3J(H,H) = 7 Hz, H12), 2.59 (2 H, t, 3J(H,H) = 8 Hz, H2), 2.88 (2 H, t, 3J(H,H) = 8 Hz, H3), 3.87 (3 H, s, H10), 4.13 (2 H, q, 3J(H,H) = 7 Hz, H11), 5.52 (1 H, s, H13), 6.68 (2 H, m, H5,9), 6.83 (1 H, d, 3J(H,H) = 8 Hz, H8). δC (75.5 MHz; CDCl3) 14.3 (C12), 30.8 (C3), 36.5 (C2), 55.9 (C10), 60.5 (C11), 111.1 (C5), 114.5 (C8), 121.0 (C9), 132.6 (C6), 144.1 (C7), 146.5 (C4), 173.1 (C1) – Fig. S1 (in ESI†).
10 to obtain a white powder of EtDFe (245 g, 85%, m.p. 42 C). UV: λmax (THF, nm) 230, 284 and 325. NMR: δH (300 MHz; CDCl3) 1.23 (3 H, t, 3J(H,H) = 7 Hz, H12), 2.59 (2 H, t, 3J(H,H) = 8 Hz, H2), 2.88 (2 H, t, 3J(H,H) = 8 Hz, H3), 3.87 (3 H, s, H10), 4.13 (2 H, q, 3J(H,H) = 7 Hz, H11), 5.52 (1 H, s, H13), 6.68 (2 H, m, H5,9), 6.83 (1 H, d, 3J(H,H) = 8 Hz, H8). δC (75.5 MHz; CDCl3) 14.3 (C12), 30.8 (C3), 36.5 (C2), 55.9 (C10), 60.5 (C11), 111.1 (C5), 114.5 (C8), 121.0 (C9), 132.6 (C6), 144.1 (C7), 146.5 (C4), 173.1 (C1) – Fig. S1 (in ESI†).
Several batches were carried-out in order to obtain enough quantity to produce bis-O-dihydroferuloyl 1,4-butanediol BDF at the laboratory and kilolab scales.
1. Recrystallization: the crude product was recrystallized from methanol (200 mL). Then, the resulting precipitate was collected by filtration and dried in a vacuum oven at 50 °C.
2. Flash chromatography on silica gel: the crude product was eluted with cyclohexane![[thin space (1/6-em)]](https://www.rsc.org/images/entities/char_2009.gif) :
:![[thin space (1/6-em)]](https://www.rsc.org/images/entities/char_2009.gif) AcOEt 70
AcOEt 70![[thin space (1/6-em)]](https://www.rsc.org/images/entities/char_2009.gif) :
:![[thin space (1/6-em)]](https://www.rsc.org/images/entities/char_2009.gif) 30 until affording unreacted EtDFe, then a 45
30 until affording unreacted EtDFe, then a 45![[thin space (1/6-em)]](https://www.rsc.org/images/entities/char_2009.gif) :
:![[thin space (1/6-em)]](https://www.rsc.org/images/entities/char_2009.gif) 55 ratio of the same eluent to provide BDF and finally a 0
55 ratio of the same eluent to provide BDF and finally a 0![[thin space (1/6-em)]](https://www.rsc.org/images/entities/char_2009.gif) :
:![[thin space (1/6-em)]](https://www.rsc.org/images/entities/char_2009.gif) 100 ratio of the eluent to afford the monoester.
100 ratio of the eluent to afford the monoester.
UV: λmax (THF, nm) 230, 282 and 325. NMR: δH (300 MHz; CDCl3) 1.61 (4 H, m, H12), 2.59 (4 H, t, 3J(H,H) = 8 Hz, H2), 2.88 (4 H, t, 3J(H,H) = 8 Hz, H3), 3.86 (6 H, s, H10), 4.06 (4 H, m, H11), 5.57 (2 H, s, H13), 6.67 (4 H, m, H5,9), 6.82 (2 H, d, 3J(H,H) = 8 Hz, H8). δC (75.5 MHz; CDCl3) 25.4 (C12), 30.9 (C3), 36.4 (C2), 56.0 (C10), 64.0 (C11), 111.1 (C5), 114.5 (C8), 121.0 (C9), 132.5 (C6), 144.2 (C7), 146.6 (C4), 173.1 (C1) – Fig. S2 (in ESI†).
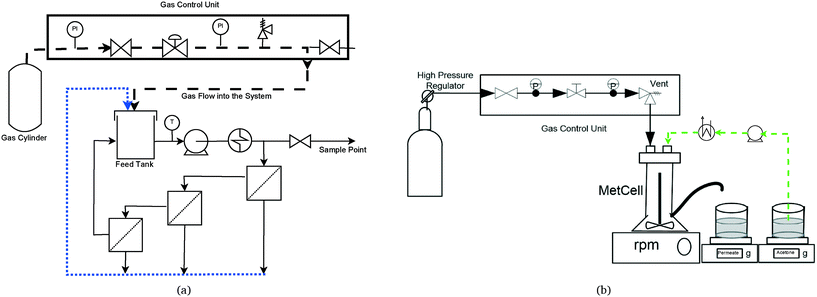
4.3.5.1 Experimental setup. Experiments were performed in a stainless steel METcell cross-flow cell, supplied by Evonik Industries (UK). This system is equipped with three crossflow cells in series (with an effective membrane area of 13 cm2 each) – Fig. 10a. This configuration allows the testing of three membranes simultaneously, since it is known that in nanofiltration the permeate flux is too small compared to the feed flux, thus the feed composition will be the same for the three membranes. The feed reservoir has a total volume of 800 mL and agitation is promoted by a recirculation pump (AEG, 1.2 L min−1). The same system may work in dead-end configuration (Fig. 10b), with a total membrane area of 51.4 cm2. In that case, the feed reservoir has a total volume of 250 mL and the agitation is promoted by a cross head magnetic bar that provides the adequate fluid dynamic conditions. The pressure applied through the membrane in both cases is regulated by a pre-assembled gas unit and the temperature is controlled by a heat exchanger, using a cooler system (Hudson).
The system may work under three operating modes:
1. Total recirculation: the permeate is recirculated to the feed recipient by a HPLC pump (model 306, Gilson).
2. Diafiltration: the permeate is continuously removed and the feed volume was held constant with the addition of acetone at the same rate of the permeate removal.
3. Concentration: the permeate is continuously removed and the retentate is recirculated to the feed recipient. As a consequence, the feed volume is reduced.
In all operating modes, the permeate rate is monitored by acquisition of the permeate weight, using an electronic balance with an accuracy of 0.1 g.
4.3.5.2 Membrane evaluation. Three membranes were tested simultaneously in the cross-flow system, using the total recirculation operating mode (Fig. 10a). Before starting the experiments, each new membrane was compacted with acetone at the maximal operating pressure until a constant value of flux was obtained. The acetone permeability value was measured for all membranes, after their compaction, at different pressures and at 25 °C (average temperature). Acetone permeability (Lp, L h−1 m−2 bar−1) was determined by varying the transmembrane pressure (ΔP, bar) and measuring the permeate flux (Jv, L h−1 m−2), defined as the permeate flow (Qp, L h−1) per unit of the membrane surface (A, m2). Their relationship is theoretically established by the Darcy's equation:
| Jv = Lp (ΔP − Δπ) | (1) |
Afterwards, 200 mL of a BDF solution (1 g L−1 in acetone, containing 20% of EtDFe) as impurities was placed in the feed recipient and processed at different transmembrane pressures, using the total recirculation operating mode. Table 1 presents the membranes selected for this study. The performance of membrane separation for solute i is quantified using the rejection factor (Ri, %), defined as:
 | (2) |
In membrane filtration, the solvent usually permeates faster than the solutes through the membrane. Consequently, there is a buildup of solute very near the membrane surface, resulting in concentration polarization effects.35 The rejection was defined as “observed” in eqn (2) because one consequence of concentration polarization is to make the observed rejection different from the real, or intrinsic rejection. However, for the purpose of this study, it was assumed that the effects of concentration polarization were negligible as the solutions used were quite dilute (1 g L−1), and it was assumed that hydrodynamic turbulence generated at the membrane surface was enough to largely disrupt concentration polarization. In addition, osmotic pressure across the membrane was assumed negligible.
4.3.5.3 Membrane selection. Two parameters were defined for quantifying the efficiency of the system for purity grade (eqn (3)) and loss (eqn (4)) of BDF, defined as:
 | (3) |
 | (4) |
Data of permeability in a solution of BDF (1 g L−1) in acetone and rejections of (4) and (2) at different pressures were taken into account to predict the number of diananofiltration volumes (VD) needed to obtain a BDF purity of 95% (assuming a membrane area of 51.4 cm2) as well as the loss of BDF (eqn (4)) associated with the process. Each 100 mL (initial feed volume) represents one diananofiltration volume (VD), defined as the total volume of permeate collected divided by initial system volume. This dimensionless parameter allows different diananofiltration systems to be compared. The procedure for diafiltration modelling can be found in section 6 – Appendix A.
Membranes were compared according to the purification and the BDF losses criteria.
4.3.5.4 Single stage diafiltration (SSD). Single-stage diafiltration was performed independently with the best membrane at the optimal pressure using the dead-end system (Fig. 10a) and the operating mode shown in Fig. 11. Initially, 200 mL of a BDF solution (1 g L−1) was circulated throughout the system at the optimal pressure. Once steady-state concentration of all the species in the retentate and permeate had been reached, a preparative single stage diafiltration was carried out. The system was maintained at a constant volume by adding the same volume of pure acetone into the system as permeated over the same time. For each 200 mL of permeate collected (representing one diafiltration volume (VD)), a new permeate vessel was placed. Permeate samples in each vessel were analyzed by HPLC at different times and the retentate concentration was determined by mass balance.
4.3.5.5 Two-stage diafiltration (TSD). After carrying-out a single diafiltration stage, a second stage was performed in the same system (Fig. 11). In order to simulate a continuous process, the first permeate produced in the single stage (V1D = 1) was used as the feed for the second stage (V1D = Vf2). The remaining permeate vessels (from the first stage) were fed to the second-stage (instead of pure acetone) at the same rate of the permeate. Permeates were collected in a single vessel. Permeate samples were analyzed by HPLC for each VD while the retentate concentration was determined by mass balance. The solvent of the retentate was evaporated and the BDF was analyzed by NMR – Fig. S4 (in the ESI†). Fig. S5 (in the ESI†) compares the spectra of BDF obtained from different purification systems.
4.3.5.6 Solvent recovery. Duramem 150 (Table 1) was tested in the cross-flow system, using the total recirculation operating mode (Fig. 10b). Before starting the experiments, the membrane was compacted with acetone at 50 bar until a constant value of flux was obtained. Acetone permeability was measured after its compaction, at different pressures and at 25 °C (average temperature). Data of permeability in a BDF solution in acetone and compound rejections at different pressures were taken into account to predict the profile of solvent purity during concentration (assuming a membrane area of 51.4 cm2). The procedure for modelling filtration in concentration mode can be found in section 7. In order to validate the model, 200 mL of permeate obtained after two diafiltration stages was concentrated at least 10 fold in dead-end configuration (Fig. 10a). Permeate samples were analyzed by HPLC while the retentate concentration was determined by mass balance. The remaining solvent in the retentate was evaporated in a rotovapor (Büchi) at 40 °C to obtain the residue. The latter was analyzed by HPLC.
4.3.6.1 HPLC. HPLC analyses were performed on a ThermoFisher Ultimate 3000 equipped with a DA detector (280 nm) and a Thermo Scientific BetaMax Neutral (150 × 4.6 mm, 5 μm) column. All samples were analysed without prior dilution. The following conditions were applied: injection 20 μL, oven temperature 40 °C, flow rate 1.0 mL min−1, elution method (water–acetonitrile): 0–2 min isocratic 95/5, 2–5 min from 95/5 to 40/60, 5–10 min isocratic 40/60, 10–12 min 90/10 to 95/5 and 12–14 min isocratic 95/5. Retention times: tr(EtDFe) = 7.7 min, tr(BDF) = 8.5 min The BDF purity degree achieved by each different purification method was determined by HPLC, using the BDF and EtDFe produced by flash chromatography as standard (see Fig. S5 in the ESI†).
4.3.6.2 NMR. The structure of synthesized compounds (at the laboratory and kilolab scales) was confirmed by NMR (see Fig. S5 in the ESI†). 1H and 13C NMR spectra were recorded in CDCl3 on a Bruker Fourier 300 at 300 MHz and 75 MHz, respectively (reference CDCl3, residual signal at δH = 7.26 ppm and δC = 77.16 ppm).
 | (5) |
 | (6) |
The calculation of energy consumption per kg of product for recrystallization takes into account the acetone and ethanol heat capacities, the heat of vaporization and condensation while for SRNF-based methods, the energy consumed by the working and recirculation pumps to achieve the working pressure of the process was taken into account, assuming the value of pump efficiency of 30%.
LCA was carried out using Bilan Produit® from ADEME (Agence De l'Environnement et de la Maitrise de l'Energie) and the Université de Cergy-Pontoise.36 This program uses Ecoinvent 2.0 as database and the CML method (Centrum voor Milieukunde de Leyde) for impact characterization. The impact of each process in the global warming potential (GWP, kg of CO2 per kg of BDF), water toxicity (kg of 1,4-dichlorobenzene (DCB) per kg of BDF), acidification (kg of SO2 per kg of BDF), eutrophication (kg of PO4−3 per kg of BDF), photochemical pollution (kg of C2H4 per kg of BDF) and human toxicity (kg of DCB per kg of BDF) was determined.
GWP quantifies the emissions in the air susceptible to participate directly in the climatic global warming; water toxicity describes the effects of toxic substances on the aquatic ecosystems for 100 years; acidification reflects the problems related to acid rains which affect the natural and artificial ecosystems and human infrastructures; eutrophication reflects the enrichment potential of water in nutriments, since the excess leads to a biodiversity decrease in humid zones as well as to a water quality decrease; photochemical pollution is related to the transformation of chemical pollutants into oxidant species due to the effect of sun rays; and finally, human toxicity indicates the exposition effects of toxic substances on humans for 100 years.
5 Appendix A: Diafiltration modelling
Diananofiltration in a batch mode of operation at constant pressure can be described by a mass balance for each species i in the system: | (7) |
The observed rejection of solute i (Robs,i) is defined by eqn (2). Replacing the latter into eqn (7) and assuming a fixed feed volume yields:
 | (8) |
This equation can be solved analytically, if assumed that Jv and Robs,i constants. When integrated, the following equation is obtained:
 | (9) |
A similar analysis of the two-stage diafiltration was carried out. As the two stages are interconnected, a total of four ordinary differential equations can be written for species i and j in stages 1 and 2:
 | (10) |
 | (11) |
 | (12) |
 | (13) |
6 Appendix B: Concentration modelling
Filtration in concentration mode at constant pressure can be described by a mass balance for each species i in the system: | (14) |
Taking into account the definition of rejection (eqn (2)), replacing it into eqn (14) and rearranging the equation yields:
 | (15) |
| Cr3,i,t = Cf3,i,0fteRobs3,i | (16) |
 | (17) |
Acknowledgements
The authors are grateful to SFR Condorcet, Région Champagne-Ardenne, Conseil Departemental de la Marne and Reims Métropole for financial support.References
- N. Mukmeneva, E. Gotlib, M. Verizhnikov, G. Nagumanova, L. Grinberg and R. Chakirov, Polym. Degrad. Stab., 2001, 73, 383–386 CrossRef CAS
.
- K. Bhunia, S. S. Sablani, J. Tang and B. Rasco, Compr. Rev. Food Sci. Food Saf., 2013, 12, 523–545 CrossRef CAS
.
- J. Michalowicz, Environ. Toxicol. Pharmacol., 2014, 37, 738–758 CrossRef CAS PubMed
.
- B. Borrel, Nature, 2010, 464, 1122–1124 CrossRef PubMed
.
- F. Aeschelmann and M. Carus, Ind. Biotechnol., 2015, 11, 154–159 CrossRef
.
- W. Boerjan, J. Ralph and M. Baucher, Annu. Rev. Plant Biol., 2003, 54, 519–546 CrossRef CAS PubMed
.
- J. Ralph, K. Lundquist, G. Brunow, F. Lu, H. Kim, P. F. Schatz, J. M. Marita, R. D. Hatfield, S. A. Ralph, J. H. Christensen and W. Boerjan, Phytochem. Rev., 2014, 3, 29–60 CrossRef
.
- T. Lam, K. Kadoya and K. Iiyama, Phytochemistry, 2001, 57, 987–992 CrossRef CAS PubMed
.
- E. Bonnin, L. Saulnier, M. Brunel, C. Marot, L. Lesage-Meessen, M. Asther and J.-F. Thibault, Enzyme Microb. Technol., 2002, 31, 1000–1005 CrossRef CAS
.
- E.-G. Lee, S.-H. Yoon, A. Das, S.-H. Lee, C. Li, J.-Y. Kim, M.-S. Choi, D.-K. Oh and S.-W. Kim, Biotechnol. Bioeng., 2009, 102, 200–208 CrossRef CAS PubMed
.
- S. Itagaki, T. Kurokawa, C. Nakata, Y. Saito, S. Oikawa, M. Kobayashi, T. Hirano and K. Iseki, Food Chem., 2009, 114, 466–471 CrossRef CAS
.
- F. Pion, A. F. Reano, P.-H. Ducrot and F. Allais, RSC Adv., 2013, 3, 8988 RSC
.
- A. F. Reano, J. Chérubin, A. M. M. Peru, Q. Wang, T. Clément, S. Domenek and F. Allais, ACS Sustainable Chem. Eng., 2015, 3, 3486–3496 CrossRef CAS
.
- F. Pion, P.-H. Ducrot and F. Allais, Macromol. Chem. Phys., 2014, 215, 431–439 CrossRef CAS
.
- M. Z. Oulame, F. Pion, S. Allauddin, K. V. Raju, P.-H. Ducrot and F. Allais, Eur. Polym. J., 2015, 63, 186–193 CrossRef CAS
.
- I. Barbara, A. L. Flourat and F. Allais, Eur. Polym. J., 2015, 62, 236–243 CrossRef CAS
.
- R. Menard, S. Caillol and F. Allais, Ind. Crops Prod., 2017, 95, 83–95 CrossRef CAS
.
- R. Menard, S. Caillol and F. Allais, ACS Sustainable Chem. Eng., 2017, 5(2), 1446–1456 CrossRef CAS
.
- M. Janvier, L. Hollande, A. S. Jaufurally, M. Pernes, R. Menard, M. Grimaldi, J. Beaugrand, P. Balaguer, P.-H. Ducrot and F. Allais, ChemSusChem, 2017, 10(4), 738–746 CrossRef CAS PubMed
.
- A. Gallos, G. Paes, D. Legland, F. Allais and J. Beaugrand, Composites, Part A, 2017, 94, 32–40 CrossRef CAS
.
- G. Szekely, M. Gil, B. Sellergren, W. Heggie and F. C. Ferreira, Green Chem., 2013, 15, 210–225 RSC
.
- D. J. C. Constable, C. Jimenez-gonzalez, R. K. Henderson, G. Pharmaceuticals, O. F. Plaza, V. Pennsyl, G. Pharmaceuticals, V. Fi, M. Dri, N. Carolina, G. Pharmaceuticals, P. Road, H. S. G. Odp and U. Kingdom, Org. Process Res. Dev., 2007, 11, 133–137 CrossRef CAS
.
-
C. S. Slater, M. J. Savelski, W. A. Carole and D. J. C. Constable, in Solvent Use and Waste Issues, Wiley-VCH Verlag GmbH & Co. KGaA, 2010, pp. 49–82 Search PubMed
.
-
A. Schäfer, A. Fane and T. Waite, Nanofiltration: principles and applications, Elsevier Science Ltd, 2005 Search PubMed
.
- G. Székely, J. Bandarra, W. Heggie, B. Sellergren and F. C. Ferreira, J. Membr. Sci., 2011, 381, 21–33 CrossRef
.
- J. F. Kim, A. M. F. da Silva, I. B. Valtcheva and A. G. Livingston, Sep. Purif. Technol., 2013, 116, 277–286 CrossRef CAS
.
- J. F. Kim, G. Szekely, I. B. Valtcheva and A. G. Livingston, Green Chem., 2014, 16, 133–145 RSC
.
- G. Szekely, M. F. Jimenez-Solomon, P. Marchetti, J. F. Kim and A. G. Livingston, Green Chem., 2014, 16, 4440–4473 RSC
.
- L. S. White, J. Membr. Sci., 2006, 286, 26–35 CrossRef CAS
.
- M. Dijkstra, S. Bach and K. Ebert, J. Membr. Sci., 2006, 286, 60–68 CrossRef CAS
.
- S. Darvishmanesh, T. Robberecht, P. Luis, J. Degrève and B. Bruggen, J. Am. Oil Chem. Soc., 2011, 88, 1255–1261 CrossRef CAS
.
- A. Teixeira, J. Santos and J. Crespo, J. Membr. Sci., 2014, 470, 138–147 CrossRef CAS
.
- R. A. Sheldon, Green Chem., 2007, 9, 1273–1283 RSC
.
- C. Jimenez-Gonzalez, D. J. C. Constable and C. S. Ponder, Chem. Soc. Rev., 2012, 41, 1485–1498 RSC
.
- S. Sablani, M. Goosen, R. Al-Belushi and M. Wilf, Desalination, 2001, 141, 269–289 CrossRef CAS
.
- ADEME, External link, http://www.base-impacts.ademe.fr/bilan-produit, Accessed on April, 2016
.
Footnotes |
| † Electronic supplementary information (ESI) available. See DOI: 10.1039/c7re00017k |
| ‡ These authors contributed equally to this work. |
| This journal is © The Royal Society of Chemistry 2017 |

