 Open Access Article
Creative Commons Attribution 3.0 Unported Licence
Dispersibility of different sized graphene oxide sheets and their reinforcement on polyamide 6 fibers†
Shiyu Zhang,
Yao Cheng,
Weijuan Xu,
Juan Li,
Jun Sun,
Jianjun Wang,
Chuanxiang Qin and
Lixing Dai *
*
College of Chemistry, Chemical Engineering and Materials Science, Soochow University, Suzhou, Jiangsu 215123, People's Republic of China. E-mail: dailixing@suda.edu.cn; Fax: +86-512-65883354; Tel: +86-512-65883354
First published on 15th December 2017
Abstract
Dispersibility of graphene oxide (GO) as a nano-reinforcer plays a crucial role in polymer-based nanocomposites. However, it is still uncertain whether lateral dimensions of GO could affect their dispersibility in polymer matrix. In this work, crude GO (CGO) was fractionated into large sized GO (LGO), medium sized GO (MGO) and small sized GO (SGO), through in situ polymerization on the fractionated GO (f-GO) surfaces, caprolactam (CPL) was polymerized and polyamide 6 (PA6) grafted GO (g-GO) was prepared, and then PA6/g-GO nanocomposite fibers were prepared through melting spinning. It is obvious that the dispersibility of GO, whatever f-GO or g-GO, increases with the decrease of its size. Particularly, SGO and PA6 grafted SGO (g-SGO) disperse much more uniformly than CGO and the other f-GO and their corresponding g-GO. As a result, PA6/g-SGO nanocomposite (SPA) fiber has outstanding mechanical properties, for example, the strength of the fiber is 5 times more than that of pure PA6 fiber.
1. Introduction
Graphene as an ideal reinforcer significantly improves several properties of polymer-based nanocomposites.1–7 However, due to its surface inertness and smooth structure, graphene sheets always tend to agglomerate by strong van der Waals interactions and large π-conjugated domain between neighboring sheets,8,9 which makes graphene sheets hardly compatible with most of polymers, especially with polymers containing polar groups. As a result, the poor dispersibility of graphene in polymer matrices limits further enhancement in mechanical performance of the nanocomposites.10–12 To solve this problem, chemical oxidation is used to destroy the conjugated domain in graphene basal plane. Ruoff et al. found stable aqueous dispersions of graphitic nanoplatelets were prepared by coating reduced graphite oxide nanoplatelets with an amphiphilic polymer.13 Subsequently, they reviewed various routes used to produce graphene-based materials along with methods for dispersing these materials in various polymer matrices.14 Graphene oxide (GO), containing abundant oxidative groups (e.g., hydroxyl, carboxyl, epoxy, ketone, etc.), could relatively easily disperse in polymer matrices, which contributes to enhancing mechanical behaviors of the resulting polymer-based nanocomposites to some extent. However, GO sheets have a wide size distribution, and most of them have been directly used as an additive to reinforce polymer materials without size fractionation.15–19 Because of the different sizes, there is a probability that a wide size distribution of GO sheets weakens the strengthening effect on matrix materials and moreover leads to nonuniform properties of the nanocomposites. So far, most of work rarely focuses on the effect of GO size on the dispersibility of GO in polymer matrices and the mechanical properties of the polymer nanocomposites.Meanwhile, some work has been reported about size fractionation of GO sheets.20–23 Shi et al. reported a size fractionation method based on pH-assisted sedimentation to separate GO sheets into two portions.20 Kim et al. found liquid crystal size selection of large-size GO flakes from small-size flakes.21 In our previous work, a circular-flow method was used to fractionate crude GO (CGO) sheets into three size ranges with narrow size distributions, namely large sized GO (LGO), medium sized GO (MGO) and small sized GO (SGO).23 In recent years, little work has been reported to improve the mechanical properties of nanocomposites by control of the size of GO sheets. Wallace et al. fabricated LGO sheets and polyurethane (PU) composite fibers with outstanding mechanical performance.24 The dispersibility of GO has been deemed to have critical influence on the mechanical properties of polymer nanocomposites.25,26 A good dispersibility of GO in polymer matrix is essential for avoiding unreinforced regions in the matrix and thereby distributing the load evenly throughout the nanocomposite, but the dispersibility of GO discussed so far is mainly that of un-fractionated GO samples. There are only a few researchers to investigate the effect of GO size on the dispersibility. Jang et al. reported that the GO flake morphology was transformed into a spherical form with small particle size via the ball-milling process, and the small GO nanosheets have outstanding dispersibility in silicone oil.27 Sedrpoushan found excellent dispersibility of nanoscale GO sheets which used in chemoselective oxidative conversion of benzylic C–H as a activated carbocatalyst.28 However, the comparison of dispersibility of different sized fractionated GO (f-GO) in polymer-based nanocomposites has not been reported so far.
Polyamide 6 (PA6), a typical fiber material containing a large amount of polar groups in the molecular chains, has been considered as a suitable matrix for graphene nanocomposites.29–33 In our previous work,29 long chain amine-functionalized GO sheets could more easily graft onto PA6 chains, and the amine-functionalized GO based PA6 composite fiber possessed obviously increased mechanical properties. However, it is still unknown territory about the influence of different sized GO sheets with a relatively narrow size distribution on the properties of PA6-based nanocomposite.
In this paper, CGO was fractionated into three portions, PA6 was grafted on f-GO, and nanocomposite fibers of PA6 and the PA6 grafted GO (g-GO) were prepared using melting spinning process. The dispersibility of f-GO in CPL monomers and corresponding g-GO in PA6 matrix are discussed, and the mechanical properties of the nanocomposite fibers are also investigated.
2. Experimental section
2.1 Materials
Natural flake graphite (50 meshes) was purchased from Qingdao Jinrilai graphite. Co., Ltd (China). Concentrated sulfuric acid (98%), hydrochloric acid (35%), formic acid (88%), sodium nitrate, hydrogen peroxide (10%), potassium permanganate, caprolactam (CPL) were analytical reagents and purchased from Sinopharm Chemical Reagent Co., Ltd (China).2.2 Preparation of CGO
According to the Hummers' method,34 CGO was prepared from natural flake graphite by oxidation with K2MnO4 in concentrated H2SO4, followed by ultrasonication and dialysis.2.3 Size fractionation of CGO
Size fractionation of CGO is carried out according to the method described in our previous work.23 LGO, MGO and SGO were separated from the CGO during the process of the solution circulation. The obtained f-GO was then treated with vacuum freeze-drying for further use.2.4 Preparation of PA6/g-GO nanocomposites
In a typical preparation of PA6 and PA6 grafted SGO (g-SGO) nanocomposites, CPL (40 g), 6-aminocapric acid (2 g) and SGO (4 mg) were added in a 250 ml three-neck flask and sonicated at 80 °C for 2 h. The mixture was reacted at 250 °C for 6 h under N2 with stirring, then crushed into small particles and washed in boiling water for 6 h, and lastly the resulting nanocomposite containing 0.01 wt% SGO was prepared. The obtained nanocomposite containing g-SGO and free PA6 was named SPA0.01, and so similarly the nanocomposites containing 0.05 wt%, 0.1 wt%, 0.2 wt%, 0.5 wt% and 1 wt% were named SPA0.05, SPA0.1, SPA0.1, SGA0.5, and SGA1.0, respectively, to which the naming of the nanocomposites CPA, LPA, and MPA were similar.For comparison with the nanocomposites stated above, SGO was added into formic acid and sonicated for 10 min, then mixed with PA6 at room temperature for 2 h under stirring. Deionized water was added and the mixture marked PA6 + SGO was precipitated and freeze-dried. Lastly, the PA6 + SGO mixture was cut into particles for further use. If the mixture contained x wt% SGO, it was marked PA6 + SGOx, for example, PA6 + SGO0.01 represents the mixture containing 0.01 wt% SGO.
2.5 Melt-spinning for PA6/g-GO nanocomposite fibers
The nanocomposite fibers were prepared using a self-made melt-spinning apparatus. The nanocomposite particles were first melted, and the melt was then forced through a small spinning hole with the diameter of 0.5 mm at 260 °C to the cooling air for coagulation. The series of CPA, LPA, MPA and SPA as-spun fibers were collected on a spool (Fig. S1†).2.6 Characterization
Scanning electron microscopy (SEM) images were taken on a field-emission SEM system (Zeiss, EVO 18). Polarizing optical microscope images were measured under a POM (Leica, DM4000M). Viscosities of dispersions were recorded by rotational viscometer (Fungilab, Smart Series). Transmission electron microscope (TEM) images were observed by 200 kV TEM system (FEI, Tecnai G-20) and 120 kV TEM system (Hitachi, HT7700). Polarization phenomenon of nanocomposites was investigated by hot-stage polarizing microscope (Leica, DM4000M). The mechanical properties of the fibers were measured with a gauge length 10 cm and a crosshead speed 20 mm min−1 using a single fiber strength instrument (Hongda, YG004N+). The confocal laser scanning microscopy (CLSM) images of the fiber fracture were observed by CLSM system (Leica, TCS SP5) excited with a 561 nm visible-light source and with rhodamine 6G as a laser dye. The X-ray diffraction (XRD) patterns were obtained on a XRD diffractometer (Panalytical, X'Per-Pro MPD) with a Cu-Kα radiation source. Atomic force microscope (AFM) images were recorded using a Scanning Probe Microscope (Bruker, MultiMode-8), in which samples were prepared by spin-coating sample solutions onto freshly exfoliated silicon substrates.3. Results and discussion
3.1 Dispersibility of GO in CPL melt
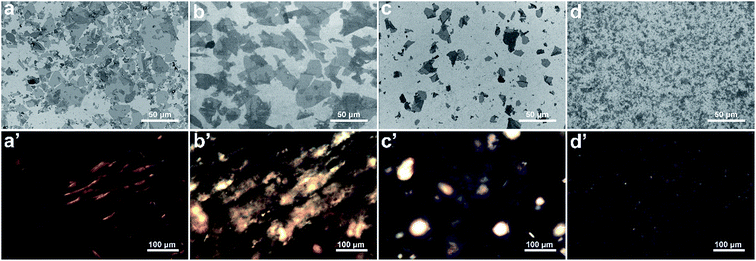
Fig. 1(a)–(d) shows the representative SEM images of CGO, LGO, MGO and SGO sheets. Clearly, the size uniformity of LGO, MGO and SGO sheets are better than CGO sheets, in which particularly SGO has the narrowest size distribution. The details of size characteristics of CGO, LGO, MGO and SGO sheets are shown in Table 1. CGO size ranges from 0.01 to 68.99 μm and its size polydispersity (SPD, details in ESI calculation in ESI data†), is high up to 97.47%, while f-GO sheets have obviously relatively low SPDs, which are 75.41%, 60.46% and 52.38% for LGO, MGO and SGO sheets, respectively. Fig. 1(a′)–(d′) are the representative polarized optical images of CGO, LGO, MGO and SGO neutral aqueous dispersions at 2 mg ml−1 GO concentration. CGO dispersion displays several different sized domains of liquid crystalline (LC) phase under the cross polarizer, and the degree of order is relatively high in the large LC domain. There is some large and orderly LC domain for LGO dispersion and a relatively small LC domain with low degree of order for MGO dispersion, while there are a large number of tiny and uniform nematic domains in SGO dispersion. Clearly, LC domains in GO dispersion are dependent on the GO sizes and SPD. van der Waals interaction and π–π conjugations35–37 among GO sheets increase with the increase of their lateral dimensions, so LGO dispersion has more orderly and larger LC domain than SGO dispersion, inferring that LGO sheets are easier to aggregate than SGO sheets. Conversely, because of obviously small size of SGO sheets, π–π conjugations are largely reduced and aggregation is hindered, which is beneficial for forming numerous dispersive and tiny nematic domains. Furthermore, the lateral dimensions of SGO sheets are relatively uniform, which is also good for its dispersibility.| Sample | Mean (μm) | Maximum (μm) | Minimum (μm) | Standard Derivation (μm) | SPD (%) |
|---|---|---|---|---|---|
| CGO | 7.11 | 68.99 | 0.01 | 6.93 | 97.47 |
| LGO | 17.87 | 66.43 | 1.39 | 13.47 | 75.41 |
| MGO | 8.12 | 27.13 | 1.23 | 4.91 | 60.46 |
| SGO | 0.42 | 2.10 | 0.01 | 0.22 | 52.38 |
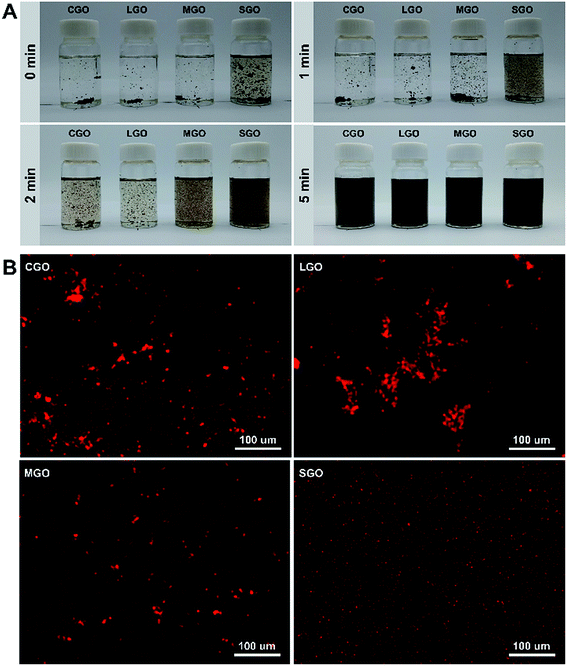
Fig. 2A shows digital photographs of CGO, LGO, MGO and SGO dispersibility in CPL melt with GO loadings 0.01 wt% at 90 °C for different sonication time: 0 min, 1 min, 2 min and 5 min. All GO sheets become gradually dispersive with sonication time, but among them the dispersibility of SGO sheets are best at every sonication time. In order to further observe the dispersibility of different sized GO sheets in CPL, EDS mapping, that is, patterns of iron element of Fe3O4 nanocrystallines anchored on CGO, LGO, MGO and SGO surfaces in CPL are used as shown in Fig. 2B. As shown in Fig. 2B, Fe3O4 nanocrystalline acts as a tracer agent to detect aggregation status of different sized GO sheets in CPL (details in ESI Synthetic method in ESI data†). After sonication for 10 min, clearly there are still aggregation in CGO, LGO and MGO dispersions, particularly in LGO dispersion, while SGO dispersion is extremely uniform, which agrees well with the results above.
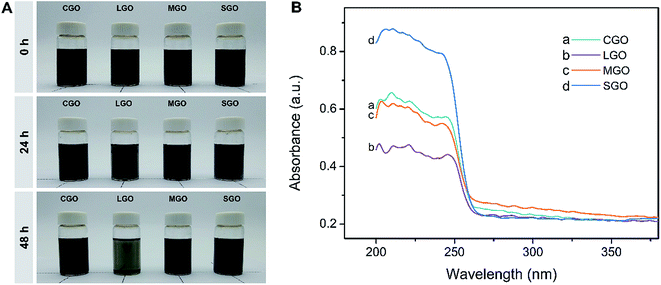
Fig. 3A shows CGO, LGO, MGO and SGO sheets in CPL melt at different standing times after uniform dispersions were formed through sonication for 20 min. In fact, SGO for the loadings from 0.01 to 1.0 wt% looks completely dispersed in the melt after sonification for 3 min (Fig. S2†), reflecting the ease of dispersion of SGO. As shown in Fig. 3A, with the LGO dispersion standing 24 h, its black color fades slightly, implying precipitation of LGO sheets, while the colors of the other dispersions do not show any changes. However, after standing 48 h, the dispersions except that containing SGO are all distinctly precipitated, and particularly, the LGO dispersion has become transparent, indicating serious precipitation. Meanwhile, the color of SGO dispersion almost has no changes, which indicates SGO excellent dispersibility and stability of the dispersion. Fig. 3B is solid-phase UV-vis spectra of upper part of the dispersions in the bottles after standing for 48 h. As shown in Fig. 3B, all samples have absorption peaks in the range from 205–230 nm, which could be attributed to π → π* transitions (conjugation) of polyaromatic C![[double bond, length as m-dash]](https://www.rsc.org/images/entities/char_e001.gif) C groups. The peak intensity of SGO dispersion is far higher than CGO, LGO and MGO dispersions, indicating the highest content of SGO in CPL, that is, excellent dispersibility of SGO sheets.
C groups. The peak intensity of SGO dispersion is far higher than CGO, LGO and MGO dispersions, indicating the highest content of SGO in CPL, that is, excellent dispersibility of SGO sheets.
3.2 Dispersibility of g-GO in PA6 matrix
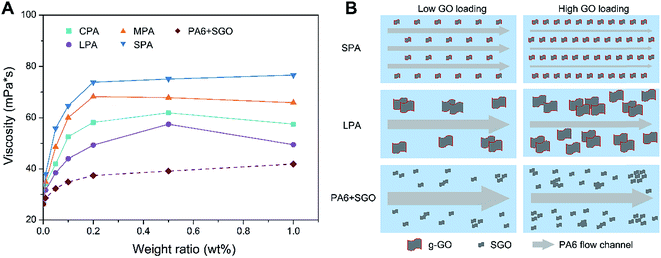
AFM images of CGO, LGO, MGO, SGO sheets are shown in Fig. S3.† The thickness of different sized GO sheets is about 1 nm, suggesting effective size fractionation of different sized GO sheet with single-layer or few-layer structure. Fig. S3†also shows AFM image of g-MGO sheets separated from MPA0.2 nanocomposite. The thickness of g-MGO sheet increases to about 25 nm, suggesting PA6 chains have obviously combined with g-GO. Fig. S4† is XRD patterns of CGO, LGO, MGO and SGO specimens. The XRD diffraction peaks at 10.8°, 11.3°, 10.9° and 9.9° corresponding to the diffraction patterns of CGO, LGO, MGO and SGO respectively, suggesting the success of the size fractionation. There are two diffraction peaks at approximately 20.7° and 24.3°, corresponding to crystal of PA6, while a new peak at 10.1° appears for CPA0.2, LPA0.2, MPA0.2 and SPA0.2, indicating existence of the nanocomposites of g-GO and PA6.Fig. 4A shows the viscosities of CPA, LPA, MPA, SPA and PA6 + SGO dispersions at GO loadings of 0.01 wt%, 0.05 wt%, 0.1 wt%, 0.2 wt%, 0.5 wt% and 1.0 wt%. The concentration of all nanocomposites in 25 mL formic acid is adjusted to 0.1 g ml−1. In each GO loading, the viscosities of CPA, LPA, MPA, SPA dispersions are in the following sequence: SPA > MPA > CPA > LPA, which is coincident with the dispersibility of GO in aqueous solutions and CPL melt. It is known that viscosity is caused by flow resistance among liquid layers, so for example, high viscosity of SPA dispersion means high fluid resistance. As shown in Fig. 4B, because g-SGO in SPA dispersion has excellent dispersibility, the fluid is segmented into many narrow flow channels, which lead to high fluid resistance and high viscosity. In contrast, although dispersibility of PA6 grafted MGO (g-MGO) and LGO (g-LGO) in MPA and LPA dispersions respectively can be increased to some extent compared with ungrafted MGO and LGO in PA6 matrix, g-MGO and g-LGO are still easy to agglomerate. In addition, there are fewer g-MGO and g-LGO sheets than g-SGO sheets at the same g-GO loadings, so the number of g-MGO and g-LGO domains is far less than that of g-SGO domain, leading to low fluid resistance and viscosity. Moreover, the viscosities of all the samples increase with the GO loadings, and the platform appears after 0.2 wt% GO loading, which is likely the balance is reached between the increase of the viscosities and its decrease due to the increase of the degree of order of the GO in the dispersions. In contrast, there is no grafted PA6 on SGO in PA6 + SGO, so weak interaction between PA6 and SGO still results in aggregation of SGO although it has better dispersibility than LGO and MGO, leading to low fluid resistance and low viscosity based on the similar description mentioned above.
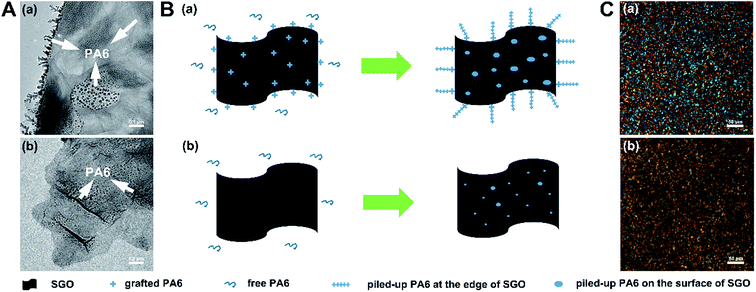
In order to investigate the interaction between g-GO and free PA6 in the nanocomposites, SPA and PA6 + SGO were taken as examples. SPA0.01 was dissolved in formic acid and then trace alcohol as its nonsolvent was gradually added to obtain precipitated g-SGO with some free PA6 piling up on it. At the same conditions, PA6 + SGO0.01 was dissolved and precipitated SGO was obtained. As shown in Fig. 5A(a), there are a number of branches on the edge of g-SGO sheet and some black spots on its surface, which is suggested to be the grafted PA6 and piled-up free PA6, while as shown in Fig. 5A(b), except some spots on SGO surface, there are no branches on its edge. As shown in Fig. 5B(a), due to a number of grafted PA6 on the edge and surface of g-SGO, strong interactions exist between free PA6 and g-SGO, inducing many free PA6 chains piling up on g-SGO. In contrast, as shown in Fig. 5B(b), there are only weak interactions existing between free PA6 and SGO in PA6 + SGO dispersion, leading to less PA6 on SGO surface.
Fig. 5C shows the representative polarized optical images of SPA0.01 and PA6 + SGO0.01 samples. As shown in Fig. 5C(a), SPA0.01 sample displays a large number of uniform tiny LC domains, and almost inherits polarization behavior of its parent SGO dispersions as shown in Fig. 1(d′). However, as shown in Fig. 5C(b), several black areas appear, suggesting some aggregation of SGO sheets in PA6 + SGO sample, which is different from cross extinction phenomenon of pure PA6 (Fig. S5†). As mentioned above, SGO sheets in water and in CPL melt have excellent dispersibility, but if it is in PA6, without further interaction (e.g. grafting) it is also difficult to obtain uniform dispersibility in PA6 matrix.
3.3 Effect of dispersibility of g-GO on the mechanical properties of nanocomposite fibers
Fig. 6 is schematic of a self-made melt-spinning setup for the nanocomposite fiber preparation and the spun fibers with GO loadings of 0.1 wt%, 0.2 wt% and 0.5 wt%. Clearly, at the same GO loadings, the uniformity of these fibers, mainly g-GO dispersibility in the fibers are increase with the decrease of the size of g-GO sheet, which is in accordance with g-GO dispersibility in PA6 matrix discussed above. Particularly, SPA fibers show the best uniformity among these composite fibers.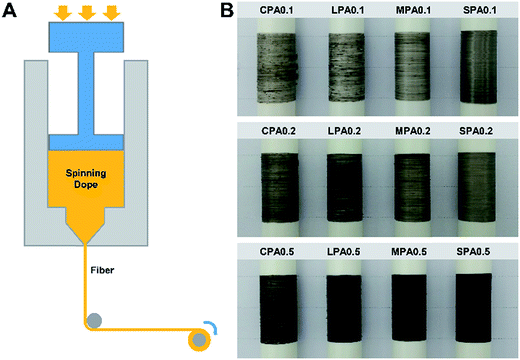 | ||
| Fig. 6 (A) Schematic of melt-spinning setup. (B) Photographs of CPA, LPA, MPA and SPA nanocomposite fibers collected on spools. | ||
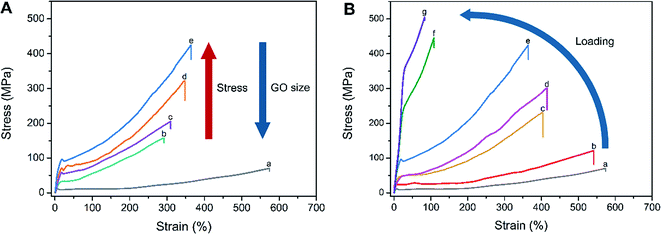
The stress–strain curves for PA6/g-GO nanocomposite fibers containing different sized GO at the same loading 0.2 wt% are recorded in Fig. 7A. The details of mechanical properties of CPA0.2, LPA0.2, MPA0.2 and SPA0.2 fibers are shown in Table S1.† The sequence of the fiber strength is SPA0.2 > MPA0.2 > LPA0.2 > CPA0.2 > PA6, while the sequence of extensibility is PA6 > SPA0.2 > MPA0.2 > LPA0.2 > CPA0.2. The larger of GO the nanocomposites, the larger of van der Waals interaction and π–π conjugations. So larger sized GO is easier to aggregate, leading to decrease of the strength and strain of the nanocomposites. Because there are some impurities graphite oxides existing in CPA, which more seriously hinders stress transfer from PA6 to GO. Meanwhile, because of the reinforcement of GO sheets, the strength of the nanocomposite fibers (more than 150 MPa) is much higher than pure PA6 (64 MPa). As we know, g-SGO has excellent dispersibility, so SPA fiber has the highest strength (423 MPa) among the three sized g-GO nanocomposite fibers, while CPA fiber contains wide size range of CGO sheets, leading to nonuniform stress transfer and low strength. It is important to stress that the fibers produced in the current study have not undergone any post drawing, which could further improve the properties. Furthermore, due to high extensibility of as-spun fibers, SPA0.2 fiber actually bears 1988 MPa on critical fracture from true stress–strain curves (Fig. S6†). As shown in Fig. S7, † knot strength is nearly not different from the normal break strength as shown in Fig. 7A, indicating the nanocomposite fibers keep relatively good toughness.
Addition of GO reduces extensibility of PA6-based nanocomposite which is similar to the report in the literatures.38,39 As shown in Fig. 7B, the stress–strain curves of SPA nanocomposite fibers obviously vary with GO loadings, and the extensibility of SPA fibers decreases with the rise of GO loadings, which is consistent with the results reported.31,40 High content of g-SGO reinforces PA6-based nanocomposite fiber, but they meanwhile reduce the inherent extensibility PA6 possesses. The tensile strength of SPA fibers increases with the rise of GO loadings, but after rising to a certain value (0.2 wt%), the extent to increase slows down obviously, which agrees with statement of the literature.38
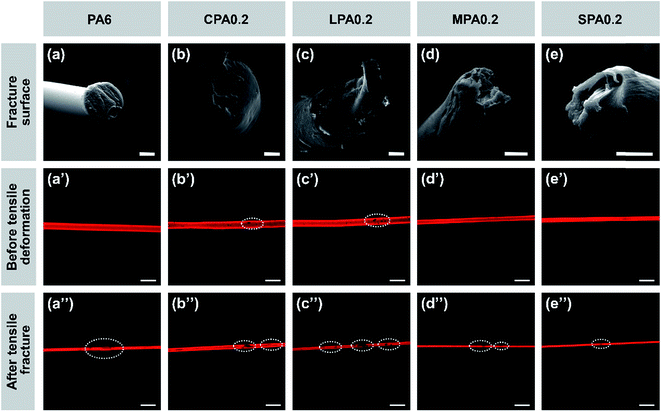
SEM images of tensile fracture cross sections of the nanocomposite fibers and their longitudinal CLSM images before drawing and after tensile fracture as shown in Fig. 8 can further explain effect of g-GO on the mechanical properties of the composite fibers. As shown in Fig. 8(a)–(e), the fracture surface of pure PA6 fiber is nearly in a even plane, while the fracture surfaces of the fibers added g-GO display different unevenness. For example, the fracture of LPA0.2 fiber has obvious brittleness character, while the fracture of SPA0.2 has the characteristics of toughness, which is suggested to be a result of uniform dispersibility and good interaction between g-SGO and PA6.
As shown in Fig. 8(b′)–(d′), before drawing there are some clear aggregations (black spots) of g-GO in CPA0.2, LPA0.2, and MPA0.2, while SPA0.2 fiber is uniform without any spots, which agrees with the dispersibility of g-GO in PA6 matrix as mentioned above. As shown in Fig. 8(a′′)–(e′′), after tensile fracture, obviously the black spots have developed and new spots appear for CPA, LPA and MPA fibers, while there are only very few small defects for SPA and PA6 fibers. Particularly, g-SGO in SPA fiber has small sizes in narrow distribution, good dispersibility and strong interaction with PA6, leading to few breakage points and finally high strength and large extensibility.
It is well-established that Raman spectroscopy can be used to verify the micromechanics of deformation in a wide range of different carbon-based nanocomposites.41–43 The Raman D band of GO at around 1330 cm−1 usually presents its structure defects.43 During deformation of the nanocomposite fibers, the stress induces deformation of GO, which can be understood the extension of C–C bond of GO, leading to downshift of D band. The fiber samples at 290% strain, which is below the elongation at break of CPA0.2 fiber, are chosen to test the downshift of D bands to ensure integrality of all the samples. As shown in Fig. 9, the shifts of D band between undrawn and drawn fibers for CPA0.2, LPA0.2, MPA0.2 and SPA0.2 nanocomposite fibers correspond to 8.5, 16.3, 6.2 and 2.9 cm−1, respectively. The full range (4000–400 cm−1) of Raman spectra of the prepared samples are shown in Fig. S8.† Obviously, SPA0.2 fiber shows the minimum D band shift, while LPA0.2 fiber shows the maximum shift. At the same GO loadings, there are larger number of g-GO with better dispersibility in SGA, so after drawing, each g-SGO sheet in SGA undergoes uniform stress, leading to little amount of deformation or structure defects. In this way, SPA fiber can tolerate larger stress, that is, it has higher break strength. Contrarily, g-LGO in LPA fiber is aggregated and nonuniformly distributed, leading to the relatively small stress tolerated during drawing and low break strength.
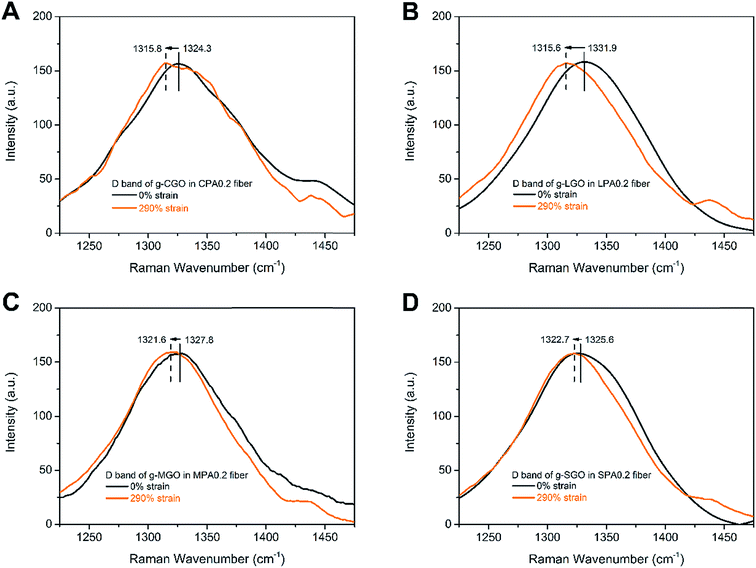 | ||
| Fig. 9 Raman D band of (A) CPA0.2, (B) LPA0.2, (C) MPA0.2 and (D) SPA0.2 nanocomposite fibers before and after tensile deformation. The intensity of D bands has been rescaled to the same level. | ||
4. Conclusions
This study presents the excellent dispersibility of SGO sheets in aqueous dispersion and CPL melt, compared with that of CGO, LGO and MGO sheets. However, unmodified SGO sheets do not disperse so satisfied in PA6 matrix. After grafted PA6 for SGO, g-SGO sheets shows obviously dispersibility in PA6, which is attributed to strong interaction between g-SGO and free PA6. Yet, g-SGO still show the best dispersibility in PA6 among the different sized g-GO, and g-SGO/PA6 composite fibers also show the fewest defects. The excellent dispersibility of g-SGO sheets and the strong interaction between g-SGO and free PA6 are suggested to promote stress transfer from free PA6 matrix to g-SGO sheets, resulting in substantially improved mechanical properties of the composite fibers. The distinct reinforcement effect of SGO with narrow size distribution on PA6 fiber provides a new approach for graphene used as a reinforcement for polymeric materials.Conflicts of interest
There are no conflicts to declare.Acknowledgements
This research is supported by National Key Research and Development Program of China (2017YFB0309401), a Project Funded by the Priority Academic Program Development of Jiangsu Higher Education Institutions and the State & Local Joint Engineering Laboratory for Novel Functional Polymeric Materials.References
- H. Li, S. Wu, J. Wu and G. Huang, J. Polym. Res., 2014, 21, 456–463 CrossRef.
- F. Wang, S. S. Jyothirmayee Aravind, H. Wu, J. Forys, V. Venkataraman, K. Ramanujachary and X. Hu, Mater. Sci. Eng., C, 2017, 79, 728–739 CrossRef CAS PubMed.
- D. Zhu, Y. Ren, G. Liao, S. Jiang, F. Liu, J. Guo and G. Xu, J. Appl. Polym. Sci., 2017, 134, 45332 CrossRef.
- S. Chen, W. Ma, H. Xiang, Y. Cheng, S. Yang, W. Weng and M. Zhu, J. Power Sources, 2016, 319, 271–280 CrossRef CAS.
- Q. Xu, C. Wang, B. Wang, Y. Chen and H. Wang, RSC Adv., 2017, 7, 33477–33485 RSC.
- N. Yeole, S. N. Kutcherlapati and T. Jana, J. Colloid Interface Sci., 2015, 443, 137–142 CrossRef CAS PubMed.
- M. Hazarika and T. Jana, Compos. Sci. Technol., 2013, 87, 94–102 CrossRef CAS.
- J. H. Lee, A. Avsar, J. Jung, J. Y. Tan, K. Watanabe, T. Taniguchi, S. Natarajan, G. Eda, S. Adam, A. H. Castro Neto and B. Ozyilmaz, Nano Lett., 2015, 15, 319–325 CrossRef CAS PubMed.
- Y. V. Shtogun and L. M. Woods, J. Phys. Chem. Lett., 2010, 1, 1356–1362 CrossRef CAS.
- H. Kim, A. A. Abdala and C. W. Macosko, Macromolecules, 2010, 43, 6515–6530 CrossRef CAS.
- J. Luo, S. Jiang, Y. Wu, M. Chen and X. Liu, J. Polym. Sci., Part A: Polym. Chem., 2012, 50, 4888–4894 CrossRef CAS.
- Y. Yang, J. Dai, Y. Li, M. Jia and X. Huang, Carbon, 2017, 115, 285–292 CrossRef CAS.
- S. Stankovich, R. D. Piner, X. Chen, N. Wu, S. T. Nguyen and R. S. Ruoff, J. Mater. Chem., 2006, 16, 155–158 RSC.
- J. R. Potts, D. R. Dreyer, C. W. Bielawski and R. S. Ruoff, Polymer, 2011, 52, 5–25 CrossRef CAS.
- S. Song, Y. Zhai and Y. Zhang, ACS Appl. Mater. Interfaces, 2016, 8, 31264–31272 CAS.
- O. C. Compton, S. W. Cranford, K. W. Putz, Z. An, L. C. Brinson, M. J. Buehler and S. T. Nguyen, ACS Nano, 2012, 6, 2008–2019 CrossRef CAS PubMed.
- A. Jabbar, G. Yasin, W. Q. Khan, M. Y. Anwar, R. M. Korai, M. N. Nizam and G. Muhyodin, RSC Adv., 2017, 7, 31100–31109 RSC.
- H. Zhang and M. M. Lerner, Nanoscale, 2016, 8, 4608–4612 RSC.
- B. Fatima, F. Jabeen, Z. Padashbarmchi and M. Najam-ul-Haq, RSC Adv., 2015, 5, 23658–23665 RSC.
- X. Wang, H. Bai and G. Shi, J. Am. Chem. Soc., 2011, 133, 6338–6342 CrossRef CAS PubMed.
- K. E. Lee, J. E. Kim, U. N. Maiti, J. Lim, J. O. Hwang, J. Shim, J. J. Oh, T. Yun and S. O. Kim, ACS Nano, 2014, 8, 9073–9080 CrossRef CAS PubMed.
- J. Chen, Y. Li, L. Huang, N. Jia, C. Li and G. Shi, Adv. Mater., 2015, 27, 3654–3660 CrossRef CAS PubMed.
- S. Zhang, Y. Li, J. Sun, J. Wang, C. Qin and L. Dai, RSC Adv., 2016, 6, 74053–74060 RSC.
- M. Z. Seyedin, J. M. Razal, P. C. Innis, R. Jalili and G. G. Wallace, Adv. Funct. Mater., 2015, 25, 94–104 CrossRef CAS.
- Y. Li, J. Sun, J. Wang, C. Qin and L. Dai, Polym. Int., 2016, 65, 1054–1062 CrossRef CAS.
- J. Guo, L. Ren, R. Wang, C. Zhang, Y. Yang and T. Liu, Composites, Part B, 2011, 42, 2130–2135 CrossRef.
- K. Y. Shin, S. Lee, S. Hong and J. Jang, ACS Appl. Mater. Interfaces, 2014, 6, 5531–5537 CAS.
- M. Heidari, A. Sedrpoushan and F. Mohannazadeh, Org. Process Res. Dev., 2017, 21, 641–647 CrossRef CAS.
- W. Hou, B. Tang, L. Lu, J. Sun, J. Wang, C. Qin and L. Dai, RSC Adv., 2014, 4, 4848 RSC.
- A. O'Neill, D. Bakirtzis and D. Dixon, Eur. Polym. J., 2014, 59, 353–362 CrossRef.
- Z. Xu and C. Gao, Macromolecules, 2010, 43, 6716–6723 CrossRef CAS.
- P. Ding, S. Su, N. Song, S. Tang, Y. Liu and L. Shi, Carbon, 2014, 66, 576–584 CrossRef CAS.
- X. Zhang, X. Fan, H. Li and C. Yan, J. Mater. Chem., 2012, 22, 24081 RSC.
- W. S. Hummers and R. E. Offeman, J. Am. Chem. Soc., 1958, 80, 1339 CrossRef CAS.
- D. Deng, X. Jiang, L. Yang, X. Hou and C. Zheng, Anal. Chem., 2014, 86, 758–765 CrossRef CAS PubMed.
- D. R. Dreyer, S. Park, C. W. Bielawski and R. S. Ruoff, Chem. Soc. Rev., 2010, 39, 228–240 RSC.
- L. Wu, L. Liu, B. Gao, R. Munoz-Carpena, M. Zhang, H. Chen, Z. Zhou and H. Wang, Langmuir, 2013, 29, 15174–15181 CrossRef CAS PubMed.
- J. B. Gao, M. E. Itkis, A. P. Yu, E. Bekyarova, B. Zhao and R. C. Haddon, J. Am. Chem. Soc., 2005, 127, 3847–3854 CrossRef CAS PubMed.
- P. Zhang, D. Qiu, H. Chen, J. Sun, J. Wang, C. Qin and L. Dai, J. Mater. Chem. A, 2015, 3, 1442–1449 CAS.
- J. Dong, C. Yin, X. Zhao, Y. Li and Q. Zhang, Polymer, 2013, 54, 6415–6424 CrossRef CAS.
- Q. Li, Y. L. Kang, W. Qiu, Y. L. Li, G. Y. Huang, J. G. Guo, W. L. Deng and X. H. Zhong, Nanotechnology, 2011, 22, 225704 CrossRef PubMed.
- C. Xu, T. Xue, J. Guo, Y. Kang, W. Qiu, H. Song and H. Xie, Mater. Lett., 2015, 161, 755–758 CrossRef CAS.
- Z. Li, R. J. Young and I. A. Kinloch, ACS Appl. Mater. Interfaces, 2013, 5, 456–463 CAS.
Footnote |
| † Electronic supplementary information (ESI) available: Experimental data, characterization details of different sized GO and PA6/g-GO nanocomposite fibers. See DOI: 10.1039/c7ra12261f |
| This journal is © The Royal Society of Chemistry 2017 |

