DOI:
10.1039/C7RA11926G
(Paper)
RSC Adv., 2017,
7, 56697-56703
Resistivity and piezoelectric properties of Ca3TaGa1.5Al1.5Si2O14 single crystals for high temperature sensors†
Received
30th October 2017
, Accepted 11th December 2017
First published on 15th December 2017
Abstract
High quality colorless Ca3TaGa1.5Al1.5Si2O14 (CTGAS) single crystals are successfully grown by the Czochralski method for high temperature (over 200 °C) sensor applications. The full set of properties, including thermal expansion, resistivity, dielectric, elastic and piezoelectric constants, is characterized as a function of temperature for the first time. The thermal expansion of CTGAS is nearly isotropic, which is beneficial to prevent stress and cracking after growth and in various temperature applications. The variation of the dielectric permittivities is about 4% between room temperature and 650 °C, while the dielectric loss is less than 2%. In the same temperature range, the piezoelectric coefficient d11 increases from 4.15 to 5.03 pC N−1 (about 21%). The average temperature coefficient frequency of the (XYt) −30° plate is as small as −15 ppm K−1. Furthermore, the resistivity of CTGAS grown under an low oxygen partial pressure atmosphere is as high as ∼4 × 10¹⁰ Ω cm at 400 °C, which is more than two orders of magnitude better than that of the reference candidate La3Ta0.5Ga5.1Al0.4O14. Altogether, CTGAS exhibits excellent electric and piezoelectric properties at elevated temperatures, and therefore is a promising candidate for high temperature sensor applications.
Introduction
Piezoelectricity was firstly discovered by the Curie brothers in 1880. Since then, it has developed rapidly and now is widely used in modern science and engineering. One of the main applications of piezoelectric materials is sensors due to the high sensitivity, fast response and compactness. In recent years, the field of sensing applications has continued to grow, particularly in those areas involving high temperature (HT).1–5 For example, a piezoelectric combustion pressure sensor is one relevant case of HT applications.6 The sensor is installed inside automobile engines for real-time monitoring of the combustion process in order to optimize the combustion efficiency and minimize the formation of environment-harmful gases such as CO2 and NOx.
However, the use of piezoelectric materials for HT sensor applications presents many challenges. On the one hand, the most common limitation is the structural instability. For example, the well-known and most widely used lead zirconate titanate (PZT) ceramics undergo a ferroelectric–paraelectric phase transition at relatively low temperatures since their Curie temperatures lie below 350 °C.1 The α-quartz is the another widely used piezoelectric material that presents excellent piezoelectric properties at room temperature (RT), such as high resistivity, low mechanical loss, narrow bandwidth and excellent thermally piezoelectric stability.1 Although it is non-ferroelectric, it also has a crystallographic phase transition (at 570 °C), and the maximum temperature for practical applications is even lower due to high electric losses above 450 °C.7 On the other hand, recently, several materials with relatively good piezoelectric properties have been proposed, however, these present another kind of drawbacks for HT applications. For instance, GaPO4 exhibits a high resistivity and a good thermal stability up to 930 °C, but the growth of single crystals is rather difficult, which seriously limits its potential for commercial applications.5 On the contrary, rare-earth calcium oxyborate crystals (RECOB) can be easily grown with the Czochralski (Cz) technique and can maintain high resistivity and good piezoelectric properties at HT, however, their pyroelectricity is detrimental for practical sensing applications.8 Furthermore, AlN has been also considered for HT applications due to its high thermal conductivity and resistivity, as well as excellent dielectric breakdown strength. It turned out, however, that its usage at HT is limited by a poor oxidation resistance.1,5,9
The langasite La3Ta0.5Ga5.5−xAlxO14 (LTGA, x = 0–0.5) single crystal is being considered for HT sensor applications. This compound is characterized by the absence of pyroelectricity and phase transitions up to its melting point (∼1500 °C), and a high value of piezoelectric coefficient d11 (three times larger than that of α-quartz at RT). Further, it can be grown by the standard Cz technique, so that the production of large-size crystals is feasible.10,11 However, the structure of LTGA is disordered, which is the cause for a low resistivity at HT (about 108 Ω cm at 400 °C).12 Instead, the resistivity of ordered langasite CTGS single crystal reaches the 1010 Ω cm order at 400 °C, i.e. about two orders of magnitude better than that of the reference candidate LTGA. It should be noted that a high electrical resistivity is mandatory to minimize losses and to guarantee a reasonable signal/noise ratio.1 Therefore, the CTGS single crystal is attracting much attention for HT sensors.13–15 Recently we have shown that the resistivity and piezoelectric coefficient d11 of CTGS can be gradually enhanced by the incorporation of Al on the Ga site. We have even succeeded to grow the fully Al-substituted Ca3TaAl3Si2O14 (CTAS) crystal, which exhibits the best performance for HT applications.16 Nevertheless, it was observed that the substitution of Ga by Al favors a structural instability, which manifests as a tendency in CTAS to contain inclusions and to crack.17,18 A partially substituted crystal is a plausible way to compromise the meritorious growth characteristics of CTGS with the better properties of CTAS. In this sense, it is found that a ratio Ga![[thin space (1/6-em)]](https://www.rsc.org/images/entities/char_2009.gif) :
:![[thin space (1/6-em)]](https://www.rsc.org/images/entities/char_2009.gif) Al of 50
Al of 50![[thin space (1/6-em)]](https://www.rsc.org/images/entities/char_2009.gif) :
:![[thin space (1/6-em)]](https://www.rsc.org/images/entities/char_2009.gif) 50, i.e. Ca3TaGa1.5Al1.5Si2O14 (CTGAS), can combine the advantages of both. To date some of the elastic and piezoelectric constants such as s11 and d11, have been studied, however, a complete characterization of all of the temperature dependent electro-elastic constants of CTGAS is still missing. Beyond these properties, the electrical resistivity is a key parameter that can be influenced by the growth atmosphere and that needs to be studied in detail.
50, i.e. Ca3TaGa1.5Al1.5Si2O14 (CTGAS), can combine the advantages of both. To date some of the elastic and piezoelectric constants such as s11 and d11, have been studied, however, a complete characterization of all of the temperature dependent electro-elastic constants of CTGAS is still missing. Beyond these properties, the electrical resistivity is a key parameter that can be influenced by the growth atmosphere and that needs to be studied in detail.
The purpose of this work is to fully determine the dielectric, elastic and piezoelectric parameters of CTGAS single crystal. For it, CTGAS crystals were grown by the Cz technique. In order to determine the more favorable growth atmosphere for high electrical resistivity, crystals were grown under high and low oxygen partial pressures. The quality of grown crystals was accessed by X-ray rocking curve (XRC) measurements, the thermal expansion by powder X-ray diffraction (XRD), and the electro-elastic properties were investigated by the resonance method as a function of the temperature.
Experimental section
CTGAS single crystals were grown by the Cz technique using a 30 kW RF generator. Commercial oxides powders of 4 N purity, namely CaCO3 (Furuuchi Chemical Co.), Ta2O5 (H.C. Starck GmbH), Ga2O3 (Kojundo Chemical Laboratory Co., Ltd), Al2O3 (Kojundo Chemical Laboratory Co., Ltd) and SiO2 (Furuuchi Chemical Co.), were weighed stoichiometrically, cold pressed at 300 MPa, and sintered at 1250 °C for 20 hours. Resulting polycrystalline CTGAS ceramics were loaded into Pt crucibles, molten and kept at around its melting point (about 1430 °C) for 10–15 hours before seeding in order to homogenize the melt. Afterwards, two CTGAS single crystals were pulled up using an a-oriented CTGS seed, under N2 + 1% O2 and air, respectively, in order to study the effect of oxygen partial pressure during growth. It should be noted that oxygen was introduced in both cases to prevent Ga evaporation from melt. The rotation rate and pulling speed were fixed at 12 rpm and 0.5 mm h−1, respectively, from the seeding to final crystal separation.
Single crystal XRD analysis was carried out at RT using a Rigaku VariMax Saturn diffractometer equipped with a Mo Kα radiation (λ = 0.71073 Å) and CCD detector. A submillimeter-size single crystal was fixed on a thin glass fiber. The collected data were refined and reduced with the Rigaku suite CrystalClear (d*trek program package). The structure was solved using the dual-space algorithm method (SHELXT) and refined by the full-matrix least squares on F2 using SHELXL-2016/6 in the WinGX program package.19–21 The XRC measurements were carried out using a PANalytical X'Pert MRD diffractometer equipped with a Cu Kα1 target (λ = 1.54059 Å) and a hybrid two-bounce Ge (220) monochromator. High-resolution data were recorded on a polished c-cut CTGAS plate with a scan step of 0.0001° and 0.5 s integration time. Powder XRD was performed with a Rigaku SmartLab 9 kW diffractometer equipped with a Cu Kα1 radiation and a one-dimensional semiconductor X-ray detector. The diffraction data were collected at RT, then every 100 °C up to 1000 °C, and finally every 50 °C until 1200 °C. The dielectric, elastic and piezoelectric parameters were determined by the resonance method using an Agilent 4294A impedance analyzer. CTGAS belongs to the trigonal system with the space group P321, so that there are in total ten independent material parameters: two dielectric permittivities εij, two piezoelectric coefficients dij, and six elastic constants sij. In order to determine them, the samples were cut based on the IEEE standards on piezoelectricity,22 as shown in detail in Table 1. The electrical resistivity was measured under air using a HIOKI SM8220 Super Megohmmeter. The samples were 10 mm square Y-cut plates of 1 mm thickness, with 5 mm square Pt electrodes deposited in the middle of both sides with a Hitachi E-1030 ion sputter.
Table 1 Orientation and dimensions of CTGAS samples used for the measurement of dielectric, piezoelectric and elastic constants
| Specimens |
Dimensions (mm3) |
Vibration mode |
Related coefficients |
| Y-cut plate |
5 × 5 × 0.5 |
— |
ε11 |
| Z-cut plate |
5 × 5 × 0.5 |
— |
ε33 |
| XY plate |
10 × 0.5 × 2 |
Length extension |
d11, s11 |
| YX plate |
10 × 0.5 × 2 |
Thickness/face shear |
s12, s44 |
| (XYt) +30° plate |
10 × 0.5 × 2 |
Length extension |
d14, s13, s14, s33 |
| (XYt) +15° plate |
10 × 0.5 × 2 |
Length extension |
|
| (XYt) −15° plate |
10 × 0.5 × 2 |
Length extension |
|
| (XYt) −30° plate |
10 × 0.5 × 2 |
Length extension |
|
Results and discussion
Crystal growth
Fig. 1 shows the photographs of the two CTGAS single crystals grown under low and high oxygen partial pressures, namely (a) N2 + 1% O2 and (b) air. As can be seen, both crystals are highly transparent and colorless. This contrasts with the typical yellowish coloration observed in crystal grown using Ir crucibles,23 indicating that the color-related defects have been eliminated. On the other hand, these crystals show a strong faceting character. The facets were determined to be {100} and {001} by the back-reflection Laue technique, in accordance with the habit (schematic of Fig. 1) estimated by the DFDH method,24,25 using the software Materials Studio.26
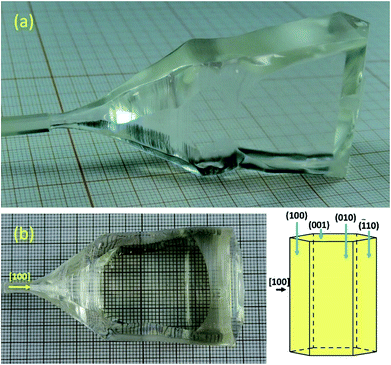 |
| | Fig. 1 Photographs of CTGAS single crystals grown under low and high oxygen partial pressures: (a) N2 + 1% O2 and (b) air. The expected habit shape based on the DFDH method is shown in the bottom-right schematic. | |
Crystal structure
The structure data and refinement of CTGAS are listed in Table 2. The corresponding cif file is given in the ESI.† This compound crystallizes in the trigonal system with the space group of P321. The unit cell parameters are a = b = 8.0801 Å, c = 4.9553(4) Å, Z = 1, and V = 280.18(5) Å3. Fig. 2 shows the crystal structure of CTGAS single crystal projected to (a) 〈001〉 and (b) 〈110〉 directions. There are four different cationic sites: Ca is located at decahedral site, Ta at the octahedral site, Si at the small tetrahedral site, while Ga and Al occupy randomly another relatively large tetrahedral site. The large Ca ions are in 8 oxygen coordination, with four different Ca–O bond distances resulting from three distinguished oxygen sites. Instead, the large Ta ions are in 6 oxygen coordination, with a single bond distance to one of the oxygen sites. Smaller Ga and Al ions are surrounded by 4 oxygens from two sites, while the Si bond to oxygen in triangular pyramids. From Fig. 2(b), we can see that the large Ca and Ta ions form a two-dimension-layer structure parallel to the c-plane. Similarly, small Al and Si ions form another layer, and both alternate between oxygen layers.
Table 2 Structure data and refinement of CTGAS single crystal
| Chemical formula |
Ca3TaGa1.5Al1.5Si2O14 |
| Formula weight (g mol−1) |
726.42 |
| Temperature (K) |
293(2) |
| Crystal system |
Trigonal |
| Space group |
P321 (no. 150) |
| Lattice constants (Å) |
a = b = 8.0801(6), c = 4.9553(4) |
| Volume (Å3) |
280.18(5) |
| Density (g cm−3) |
4.305 |
| Z |
1 |
| F000 |
339 |
| Absorption coefficient (mm−1) |
15.129 |
| Crystal size (mm3) |
0.189 × 0.075 × 0.044 |
| Theta range (deg.) |
2.91–46.06 |
| Limiting indices |
−16 ≤ h ≤ 16, −16 ≤ k ≤ 16, −8 ≤ l ≤10 |
| Reflection number |
5938 |
| Unique/collected reflection number |
1606/1605 |
| Rint |
0.0406 |
| R/wR factors [I > 2σ(I)] |
0.0237/0.0597 |
| R/wR factors (all data) |
0.0237/0.0597 |
| Goodness of fit |
1.212 |
| Largest difference peak/hole (e/Å3) |
4.046/−3.012 |
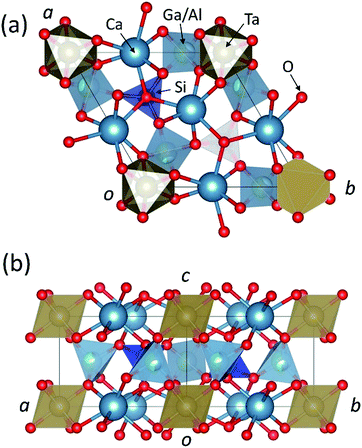 |
| | Fig. 2 Crystal structure of CTGAS single crystal projected to: (a) 〈001〉 and (b) 〈110〉 directions. | |
X-ray rocking curve measurement
The XRC of the (002) diffraction peak is shown in Fig. 3. The curve is very symmetric with a full width at half maximum (FWHM) as narrow as 21′′, indicating the high crystallinity of grown crystal.
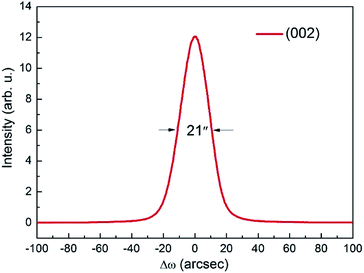 |
| | Fig. 3 (002) XRC of CTGAS single crystal. | |
Powder XRD and thermal expansion
Powder XRD patterns were recorded from RT up to 1200 °C. All patterns are similar, with a gradual decrease of 2-theta angles with the increase of temperature due to the lattice expansion. As an example, Fig. 4 shows the good agreement between the measured patterns at 1200 °C and the simulated one from the CTGAS structure at RT. The lack of phase transitions or additional phases up to HT guarantees the stability and viability of CTGAS for HT applications.
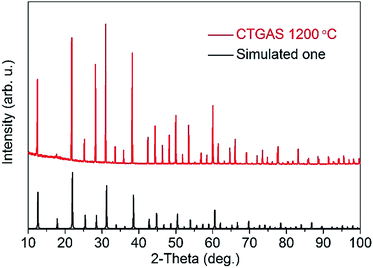 |
| | Fig. 4 XRD patterns of CTGAS at 1200 °C, compared with the calculated one at RT. | |
The lattice parameters were calculated from the XRD data using the software Fullprof.27 Fig. 5 shows the lattice constants of CTGAS crystal at RT, together with the reported values for CTGS (Al content, x = 0) and CTAS (Al content, x = 3).14,18 The insert illustrates the cation coordination of CTGAS crystal. As can be seen in Fig. 5, the lattice constants decrease linearly with the Al content, in good agreement with the Vegard's law. In addition, the lattice parameters a, c and cell volume V are shown in Fig. 6 as a function of the temperature. All these values increase with temperature due to the thermal expansion. Furthermore, the resulting relative thermal expansion versus temperature is fitted with following equations:
| | |
Δa/a0 = 1.48 × 10⁻⁹T2 + 6.57 × 10⁻⁶T − 2.58 × 10⁻⁴,
| (1) |
| | |
Δc/c0 = 1.87 × 10⁻⁹T2 + 6.22 × 10⁻⁶T − 2.10 × 10⁻⁴,
| (2) |
where Δ
a and Δ
c are the variation of lattice parameters respect to RT,
a0 and
c0 are the lattice parameters at RT, and
T is the temperature. For the sake of comparison, the linear thermal expansion coefficients were estimated and are listed in
Table 3 together with those of LTGA, CTGS, CTAS and α-quartz crystals.
1,12,14,18 As can be seen, compared to other single crystals, the thermal expansion coefficients of CTGAS along
a- and
c-axes are quite close, namely 8.44 × 10
−6 and 8.58 × 10
−6 K
−1, respectively. The similarity of these two values indicates a small anisotropy on thermal expansion, which is beneficial to avoid cracking for HT applications.
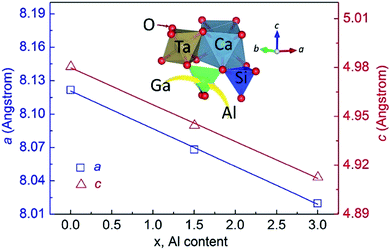 |
| | Fig. 5 Lattice constants as a function of Al content at RT. The insert illustrates the coordination of the cations (the errors are smaller than the point size). | |
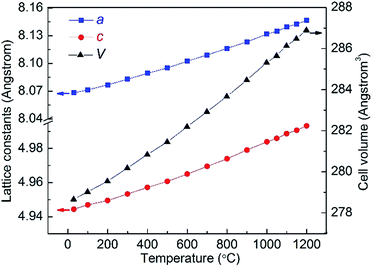 |
| | Fig. 6 Lattice constants a, c and cell volume V of CTGAS single crystal as a function of temperature (the errors are smaller than the point size). | |
Table 3 Thermal expansion coefficients of CTGAS single crystal in comparison with LTGA, CTGS, CTAS and α-quartz crystals
| Single crystal |
a-Axis (K−1) |
c-Axis (K−1) |
| LTGA |
8.48 × 10⁻⁶ |
6.32 × 10⁻⁶ |
| CTGS |
8.49 × 10⁻⁶ |
8.17 × 10⁻⁶ |
| CTGAS (this work) |
8.44 × 10⁻⁶ |
8.58 × 10⁻⁶ |
| CTAS |
8.51 × 10⁻⁶ |
9.15 × 10⁻⁶ |
| α-Quartz |
13.7 × 10⁻⁶ |
7.5 × 10⁻⁶ |
Dielectric, elastic and piezoelectric properties
Table 4 lists the RT dielectric, elastic and piezoelectric properties of CTGAS crystal, in comparison with those of CTGS, CTAS and α-quartz crystals. The dielectric permittivities εT11/ε0 and εT33/ε0 at 100 kHz, with values 15.03 and 17.73, respectively, are more than 3 times larger than those of α-quartz. On the other hand, both dielectric parameters decrease with the increase of Al content, in concordance with what can be expected from the Clausius–Mossotti model,28 which says that the dielectric permittivity increases with the ionic polarizability. The ionic polarizability of Al3+ (∼0.79 Å3) is about half of that of Ga3+ (∼1.50 Å3), thus the dielectric permittivity becomes smaller in the order CTGS, CTGAS and CTAS. The elastic compliance constants sE11, sE12, sE13, sE14, sE33 and sE44 were measured to be 8.80, −3.96, −2.46, −0.16, 5.08 and 22.30, respectively. Apart from sE14, all other constants show same decreasing tendency with Al-substitution as the dielectric permittivities. The piezoelectric coefficients d11 and d14 are 4.2 and 8.3 pC N−1, respectively, which are about 2 and 11 times larger than those of α-quartz, with values 2.31 and 0.727 pC N−1, respectively. The increase of d11 values with Al content may be related to the enhanced lattice distortion with Al substitution.16
Table 4 Dielectric, elastic and piezoelectric constants of CTGAS crystal at RT in comparison with CTGS, CTAS and α-quartz crystals
| Crystals |
Dielectric permittivities εTij/ε0 at 100 kHz |
| εT11/ε0 |
εT33/ε0 |
| CTGS |
16.29 |
21.62 |
| CTGAS |
15.03 |
17.73 |
| CTAS |
13.50 |
15.30 |
| α-Quartz |
4.51 |
4.63 |
| |
Elastic compliance constants sEij (pm2 N−1) |
| sE11 |
sE12 |
sE13 |
sE14 |
sE33 |
sE44 |
| CTGS |
9.02 |
−4.01 |
−2.88 |
−0.17 |
8.13 |
25.02 |
| CTGAS |
8.80 |
−3.96 |
−2.46 |
−0.16 |
5.08 |
22.30 |
| CTAS |
8.63 |
−2.90 |
−2.08 |
−0.49 |
4.32 |
19.09 |
| α-Quartz |
12.77 |
−1.79 |
−1.22 |
4.50 |
9.60 |
20.04 |
| |
Piezoelectric coefficients dij (pC N−1) |
| d11 |
d14 |
| CTGS |
4.0 |
−14.1 |
| CTGAS |
4.2 |
8.3 |
| CTAS |
4.5 |
5.0 |
| α-Quartz |
2.31 |
0.727 |
The dielectric properties measured at 100 kHz as a function of temperature are shown in Fig. 7. As can be seen, both εT11/ε0 and εT33/ε0 present a remarkable thermal stability. The εT11/ε0 exhibits a nearly non-temperature-dependent behavior, showing values around 15 within the measured temperature range. In the case of εT33/ε0, it firstly decreases from 17.73 to 17.00 with a variation of about −4% when temperature increases from RT to 500 °C, and then it almost keeps constant until 650 °C. The up-right insert shows the corresponding dielectric losses, tan![[thin space (1/6-em)]](https://www.rsc.org/images/entities/char_2009.gif) δ11 and tan
δ11 and tan![[thin space (1/6-em)]](https://www.rsc.org/images/entities/char_2009.gif) δ13, as a function of temperature in comparison with that (tan
δ13, as a function of temperature in comparison with that (tan![[thin space (1/6-em)]](https://www.rsc.org/images/entities/char_2009.gif) δ11) of the reference candidate LTGA. It can be seen the dielectric losses of CTGAS are notably low, being even below 2% at temperatures as high as 650 °C. On the contrary, the dielectric losses of LTGA become significant at temperatures above 400 °C.
δ11) of the reference candidate LTGA. It can be seen the dielectric losses of CTGAS are notably low, being even below 2% at temperatures as high as 650 °C. On the contrary, the dielectric losses of LTGA become significant at temperatures above 400 °C.
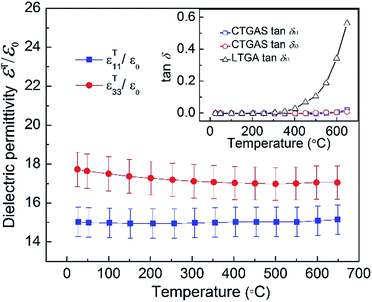 |
| | Fig. 7 Dielectric permittivity and tan δ of CTGAS crystal as a function of temperature. | |
Fig. 8 shows the variation of the resonance frequency as a function of temperature and the rotation angle for X-cut CTGAS samples. In the case of (XYt) +30° plate, the resonance frequency could not be measured due the weak electromechanical effect. The resonance frequency presents a negative dependence for all samples, with the maximum variation being found on the (XYt) +15° plate with a temperature coefficient frequency (TCF) of −60 ppm K−1 in the range RT-650 °C. Of particular interest is the (XYt) −30° plate, which exhibits a high thermal stability and an average TCF of only −15 ppm K−1 in the same temperature interval.
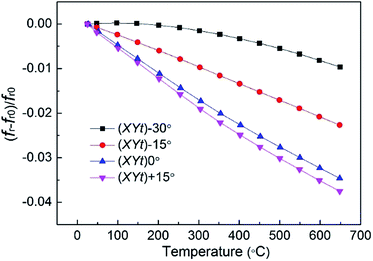 |
| | Fig. 8 Variation of the resonance frequency as a function of temperature and rotation angle for X-cut CTGAS crystals (the errors are smaller than the point size). | |
The elastic compliance constants versus temperature are shown in Fig. 9. As can be seen, all the measured constants increase in the range RT-650 °C: from 8.80 to 9.44, −3.96 to −4.34, −2.46 to −2.80, −0.16 to −0.47, 5.08 to 5.90 and 22.30 to 22.81 pm2 N−1 for sE11, sE12, sE13, sE14, sE33 and sE44, respectively.
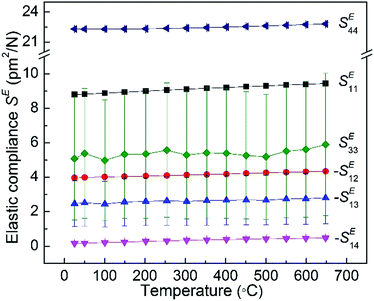 |
| | Fig. 9 Elastic compliance constants of CTGAS crystal versus temperature. | |
Fig. 10 illustrates the piezoelectric coefficients of CTGAS crystal as a function of temperature. The d11 increases from 4.15 pC N−1 at RT to 5.03 pC N−1 at 650 °C with a variation of 21%, while the d14, on the contrary, shows a negative dependence on temperature, decreasing 37% from 8.30 pC N−1 at RT to 5.09 pC N−1 at 650 °C.
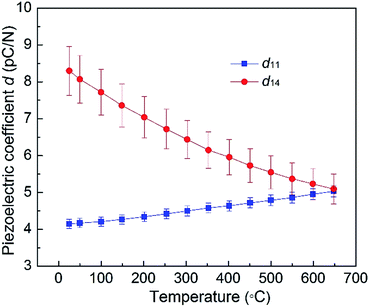 |
| | Fig. 10 Piezoelectric coefficients of CTGAS crystal as a function of temperature. | |
Electrical resistivity
The temperature dependence of the electrical resistivity of CTGAS crystals is shown in Fig. 11 together with the reported for reference LTGA.12 As can be seen, the resistivity exhibits a linear Arrhenius behavior. It is found that the resistivity of CTGAS depends on the oxygen partial pressure, being higher the lower the oxygen content. At 400 °C it reaches a maximum value of ∼4 × 10¹⁰ Ω cm, which is more than two orders of magnitude higher than that of LTGA reference at the same temperature. On the other hand, the effect of the oxygen partial pressure on activation energy Ea (which determines the slope) is negligible, suggesting that the origin of carriers is the same while its concentration varies. Furthermore, the Ea of CTGAS was calculated to be 1.38 eV, which is larger than that of LTGA with 0.82 eV.
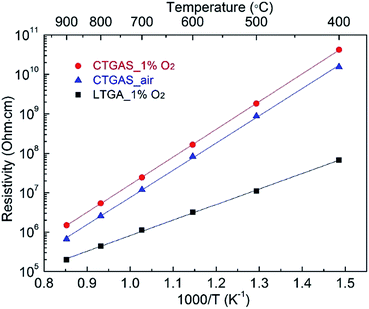 |
| | Fig. 11 Temperature dependence of resistivity of CTGAS crystals together with reported LTGA (the errors are smaller than the point size). | |
Conclusions
Crack- and inclusion-free CTGAS single crystals have been successfully grown by the Cz method under low and high oxygen partial pressures. The crystals were colorless and of high crystalline quality, with a XRC FWHM as narrow as 21 arcsec. XRD analysis indicated that CTGAS did not present neither phase transitions nor second phase segregation up to 1200 °C at least, and that its thermal expansion was almost isotropic. The dielectric, elastic and piezoelectric constants have been fully investigated as a function of the temperature. The dielectric permittivities of CTGAS showed a high thermal stability, while the dielectric losses were below 2% up to 650 °C. The piezoelectric coefficients d11 and d14 increase in the same temperature range (RT-650 °C), with values 4.15–5.03 pC N−1 and 8.30–5.09 pC N−1, respectively. The crystal grown under the lower oxygen pressure exhibited the highest resistivity. With a value of ∼4 × 10¹⁰ Ω cm at 400 °C, the resistivity of CTGAS is more than two orders of magnitude better than that of LTGA reference. Therefore, CTGAS crystal could be promising for HT piezoelectric sensor applications.
Conflicts of interest
There are no conflicts to declare.
Acknowledgements
This work has been partially supported by the Ministry of Education, Culture, Sports, Science and Technology (MEXT) Element Strategy Initiative to Form Core Center of Japan.
Notes and references
- S. Zhang and F. Yu, J. Am. Ceram. Soc., 2011, 94, 3153–3170 CrossRef CAS.
- C. Shen, H. Zhang, H. Cong, H. Yu, J. Wang and S. Zhang, J. Appl. Phys., 2014, 116, 044106 CrossRef.
- C. Shen, S. Zhang, D. Wang, T. Xu, H. Yu, W. Cao, J. Wang and H. Zhang, CrystEngComm, 2015, 17, 1791–1799 RSC.
- F. Yu, Q. Lu, S. Zhang, H. Wang, X. Cheng and X. Zhao, J. Mater. Chem. C, 2015, 3, 329–338 RSC.
- H. Fritze, J. Electroceram., 2011, 26, 122–161 CrossRef CAS.
- K. Tsukada, M. Takeuchi, S. Tokumitsu, Y. Ohmura and K. Kawaguchi, R&D Review of Toyota CRDL, 1993, 28, 49–57 CAS.
- R. W. Cernosek, J. R. Bigbie, M. T. Anderson, J. H. Small and P. S. Sawyer, Presented in part at the Solid-State Sensor and Actuator Workshop, South Carolina, 1998 Search PubMed.
- F. Yu, F. Chen, S. Hou, H. Wang, Y. Wang, S. Tian, C. Jiang, Y. Li, X. Cheng and X. Zhao, 2016 Symposium on Piezoelectricity, Acoustic Waves, and Device Applications (SPAWDA), 2016, pp. 1–7 Search PubMed.
- T. Kim, J. Kim and X. Jiang, Nondestructive Characterization and Monitoring of Advanced Materials, Aerospace, and Civil Infrastructure, 2017, vol. 2017, p. 10169, 101691H Search PubMed.
- I. H. Jung, T. Fukuda and K. H. Auh, J. Electroceram., 2004, 13, 471–478 CrossRef CAS.
- H. Takeda, S. Tanaka, H. Shimizu, T. Nishida and T. Shiosaki, Key Eng. Mater., 2006, 320, 239–242 CrossRef CAS.
- X. Fu, E. G. Víllora, Y. Oshima, K. Shimamura and N. Ohashi, J. Alloys Compd., 2015, 647, 1086–1090 CrossRef CAS.
- F. Yu, X. Zhao, L. Pan, F. Li, D. Yuan and S. Zhang, J. Phys. D: Appl. Phys., 2010, 43, 165402 CrossRef.
- X. Fu, E. G. Villora, Y. Matsushita, Y. Kitanaka, Y. Noguchi, M. Miyayama, K. Shimamura and N. Ohashi, J. Ceram. Soc. Jpn., 2016, 124, 523–527 CrossRef CAS.
- T. Ma, S. Hou, F. Yu, C. Xie, S. Zhang, J. Wang, J. Du, J. Zhan, X. Cheng and S. Wang, J. Alloys Compd., 2017, 728, 518–524 CrossRef CAS.
- X. Fu, E. G. Víllora, Y. Matsushita, Y. Kitanaka, Y. Noguchi, M. Miyayama, K. Shimamura and N. Ohashi, J. Alloys Compd., 2016, 687, 797–803 CrossRef CAS.
- J. Xin, Y. Zheng, H. Kong, H. Chen, X. Tu and E. Shi, Cryst. Growth Des., 2008, 8, 2617–2619 CAS.
- X. Fu, E. G. Villora, Y. Matsushita, Y. Kitanaka, Y. Noguchi, M. Miyayama, K. Shimamura and N. Ohashi, Cryst. Growth Des., 2016, 16, 2151–2156 CAS.
- L. J. Farrugia, J. Appl. Crystallogr., 1999, 32, 837–838 CrossRef CAS.
- G. M. Sheldrick, Acta Crystallogr., Sect. C: Struct. Chem., 2015, 71, 3–8 CrossRef PubMed.
- G. M. Sheldrick, Acta Crystallogr., Sect. A: Found. Adv., 2015, 71, 3–8 CrossRef PubMed.
- IEEE Standard on Piezoelectricity, ANSI/IEEE Std 176–1987, NY Search PubMed.
- A. Yoshikawa, Y. Shoji, Y. Ohashi, Y. Yokota, V. I. Chani, M. Kitahara, T. Kudo, K. Kamada, S. Kurosawa and A. Medvedev, J. Cryst. Growth, 2016, 452, 135–140 CrossRef CAS.
- A. Bravais, Etudes Crystallographiques, Academie des Sciences, Paris, 1913 Search PubMed.
- J. D. H. Donnay and D. Harker, Am. Mineral., 1937, 22, 463 Search PubMed.
- Accelrys, MS Modeling Getting Started, Accelrys Software Inc., San Diego, 2006 Search PubMed.
- J. Rodríguez-Carvajal, Phys. Rev. B: Condens. Matter Mater. Phys., 1993, 192, 55–69 CrossRef.
- R. D. Shannon, J. Appl. Phys., 1993, 73, 348–366 CrossRef CAS.
Footnote |
| † Electronic supplementary information (ESI) available. See DOI: 10.1039/c7ra11926g |
|
| This journal is © The Royal Society of Chemistry 2017 |
Click here to see how this site uses Cookies. View our privacy policy here.  Open Access Article
 *a,
Encarnación G. Vílloraa,
Yoshitaka Matsushitaa,
Yuuki Kitanakab,
Yuji Noguchib,
Masaru Miyayamab,
Kiyoshi Shimamuraac and
Naoki Ohashiad
![[thin space (1/6-em)]](https://www.rsc.org/images/entities/char_2009.gif) :
:![[thin space (1/6-em)]](https://www.rsc.org/images/entities/char_2009.gif) Al of 50
Al of 50![[thin space (1/6-em)]](https://www.rsc.org/images/entities/char_2009.gif) :
:![[thin space (1/6-em)]](https://www.rsc.org/images/entities/char_2009.gif) 50, i.e. Ca3TaGa1.5Al1.5Si2O14 (CTGAS), can combine the advantages of both. To date some of the elastic and piezoelectric constants such as s11 and d11, have been studied, however, a complete characterization of all of the temperature dependent electro-elastic constants of CTGAS is still missing. Beyond these properties, the electrical resistivity is a key parameter that can be influenced by the growth atmosphere and that needs to be studied in detail.
50, i.e. Ca3TaGa1.5Al1.5Si2O14 (CTGAS), can combine the advantages of both. To date some of the elastic and piezoelectric constants such as s11 and d11, have been studied, however, a complete characterization of all of the temperature dependent electro-elastic constants of CTGAS is still missing. Beyond these properties, the electrical resistivity is a key parameter that can be influenced by the growth atmosphere and that needs to be studied in detail.

![[thin space (1/6-em)]](https://www.rsc.org/images/entities/char_2009.gif) δ11 and tan
δ11 and tan![[thin space (1/6-em)]](https://www.rsc.org/images/entities/char_2009.gif) δ13, as a function of temperature in comparison with that (tan
δ13, as a function of temperature in comparison with that (tan![[thin space (1/6-em)]](https://www.rsc.org/images/entities/char_2009.gif) δ11) of the reference candidate LTGA. It can be seen the dielectric losses of CTGAS are notably low, being even below 2% at temperatures as high as 650 °C. On the contrary, the dielectric losses of LTGA become significant at temperatures above 400 °C.
δ11) of the reference candidate LTGA. It can be seen the dielectric losses of CTGAS are notably low, being even below 2% at temperatures as high as 650 °C. On the contrary, the dielectric losses of LTGA become significant at temperatures above 400 °C.


