 Open Access Article
Surface modification of electrospun nanofibrous membranes for oily wastewater separation
Fatma Yalcinkaya *a,
Anna Siekierkab and
Marek Bryjakb
aTechnical University of Liberec, Institute for Nanomaterials, Advanced Technology and Innovation, Studentska 1402/2, 46117 Liberec, Czech Republic. E-mail: yenertex@hotmail.com
bWroclaw University of Science and Technology, Faculty of Chemistry, 27 Wybrzeze Stanislawa, Wyspianskiego, 50-370 Wroclaw, Poland
First published on 15th December 2017
Abstract
This paper presents a method for producing nanofibrous composite membranes for the separation of a vegetable oil–water mixture. Neat polyvinylidene fluoride (PVDF), polyacrylonitrile (PAN) nanofibres and PVDF/PAN mixtures were used to prepare the membranes. Argon plasma treatment, followed by a chemical surface modification, was applied to alter the hydrophilicity and oleophobicity of the membranes. The obtained results showed that the membranes change their surface character (hydrophilicity and oleophilicity) in relation to the mixing ratio of the PVDF/PAN nanofibres and the surface modification parameters. These results can extend the application of PVDF, PAN and PVDF/PAN nanofibrous membranes to the treatment of oily water.
1. Introduction
Oil–water emulsions emitted into the soil or water from domestic and industrial wastewater are one of the most severe issues that threaten human life and ecological systems, with a significant amount of oily wastewater generated every day. Thus, there is a growing demand to produce an oil–water separation system that has high selectivity, high efficiency, low fouling properties and is easy to apply and manage.Microfiltration membranes are applied for oil–water separation treatment, along with other methods, such as bioremediation and chemical methods.1–3 The production of high-performance membranes with anti-fouling properties still remains challenging. Surface absorption, surface grafting and blending are some of the methods used for the surface modification of membranes4–10 to improve their anti-fouling properties. A hydrophilic membrane surface helps to reduce bio-fouling and protein adhesion in microfiltration. Blending materials is considered the simplest and most inexpensive approach for surface modification. Recently, the plasma modification method has attracted interest due to its extremely short modification time and non-destructive action. However, the modification is usually not permanent on most polymer surfaces, often disappearing within hours or days of treatment.11–13 To counteract this phenomenon, a post-treatment method should be applied to provide a permanent surface modification.
Polyvinylidene fluoride (PVDF) is one of the most frequently used polymers in membrane technology due to its outstanding chemical, thermal and oxidation resistance properties,14–16 while polyacrylonitrile (PAN) is a common polymer that is characterised by its thermal stability, tolerance to most solvents, strong antioxidant capacity and commercial availability.17,18 PVDF has better mechanical properties than PAN.19 PAN is a hydrophilic polymer, whereas PVDF is a hydrophobic polymer. The versatility of both polymers thus makes them suitable for manufacturing membranes for liquid/liquid and liquid/solid separations.
The objective of this paper is to evaluate the properties of modified nanofibrous composite membranes obtained from PVDF, PAN and PVDF/PAN mixtures. Mixing the polymers should increase the hydrophilicity of the nanofibre web while also increasing the strength of the web by binding its fibres together. However, the main disadvantage regarding the use of nanofibres in filtration is their lack of mechanical integrity. Two of the novelties of this paper are that the nanofibre layers were produced with the Nanospider industrial equipment,20 and that the layers strongly adhered to a nonwoven supporting layer without any damage, using hot-press lamination technology to improve their performance in liquid filtration applications. The microwave plasma technique, followed by a chemical post-treatment, was used to hydrophilise the membrane surfaces. While similar papers dealing with the plasma modification of polymer membranes have been published,21–26 none have considered the use of a nanofibre web surface modification with both plasma and chemical treatments for liquid/liquid and liquid/solid separations. This study may thus provide a better understanding of the effects of surface modifications on the permeability and liquid selectivity of the membranes as a function of chemical modification time.
2. Materials and methods
PAN (Elmarco s.r.o., Czech Republic) was dissolved in dimethylformamide (DMF) to produce an 8% wt. PAN solution, and PVDF (Solef 1015, Belgium) was dissolved in dimethylacetamide (DMAc) to produce a 13% wt. PVDF solution. The DMF and DMAc solvents were purchased from Penta s.r.o., Czech Republic. The solutions were stirred overnight. Five different samples were prepared, defined by their PVDF/PAN nanofibre blend ratios (Table 1). A Nanospider electrospinning device (Elmarco s.r.o., Czech Republic) was used to produce the nanofibres under controlled and stable processing conditions, following previous studies (Fig. 1).27 A solution carriage feeds the polymer solution on a 0.2 mm moving stainless steel wire. The speed of the carriage is 245 mm s−1. High voltage suppliers are connected to the wire electrode (60 kV) and the collector electrode (−15 kV). When the applied voltage exceeds a critical value, the polymer solution jets move towards the collector, the solvent evaporates, and the nanofibre web is collected on baking paper moving in front of the collector electrode. The speed of the movement of the baking paper is 10 cm min−1. The distance between the electrodes is 18 cm. The temperature and humidity of input air are set to 23 °C and 20% by the air-conditioning system. The intake and outlet airflows are 100 and 115 m3 h−1, respectively.| Sample code | PVDF/PAN wt ratio | Viscosity (mPa) | Area weight (g m−2) | Pore size (nm) |
|---|---|---|---|---|
| S1 | 1/0 | 969.3 | 3.52 ± 0.5 | 2030 ± 562 |
| S2 | 0/1 | 190.9 | 1.29 ± 0.5 | 710 ± 344 |
| S3 | 2/1 | 718.0 | 1.99 ± 0.5 | 790 ± 516 |
| S4 | 1/1 | 499.3 | 4.35 ± 0.5 | 910 ± 245 |
| S5 | 1/2 | 348.5 | 0.72 ± 0.5 | 820 ± 324 |
The zero-shear viscosity of the polymer solutions was measured using a Fungilab Expert viscometer at 23 °C.
Pressure-driven liquid filtration applications require that the membranes possess sufficient mechanical strength to withstand the operational conditions. The nanofibres were thus laminated onto a nonwoven spunbond supporting material to improve the mechanical strength of the membranes. The surface of the membranes was characterised by Scanning Electron Microscope (SEM, Vega 3SB) and the fibre diameters were analysed using the Image-J image processing software. The surface contact angle of the samples was measured at room temperature using a Kruss Drop Shape Analyzer DS4 with distilled water on the clean and dry samples. The PVDF/PAN mixture of polymeric nanofibres was evaluated using Fourier transform infrared spectroscopy (FTIR, Nicolet iZ10 by Thermo Scientific). A 1200-AEL capillary flow porometer (Porous Media Inc., Ithaca, NY) was used in this study to measure the pore size of the samples.
The prepared nanofibrous composite membranes were cut into 5 cm × 5 cm squares and subjected to the standard plasma treatment.10 Microwave-induced low vacuum argon (Ar) plasma was used to modify the surface for 5 min. The scheme of the plasma reactor is shown in Fig. 2. After the plasma treatment, the samples were exposed to the atmosphere for 20 min and then immersed in 1 M sodium hydroxide (NaOH) aqueous solution. The times of sample immersion were 0, 2, 4, 6 and 24 h. The samples were then rinsed and kept in distilled water.
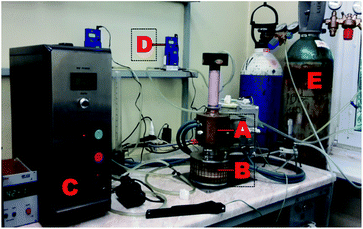 | ||
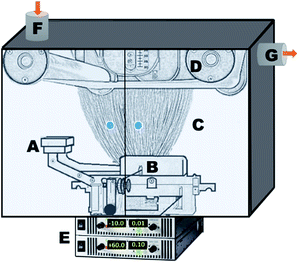
| Fig. 2 Remote microwave plasma device, with key components labelled. (A) Low vacuum microwave plasma head; (B) reaction chamber; (C) MW generator; (D) Ar gas flowmeter; and (E) Ar gas tank. | ||
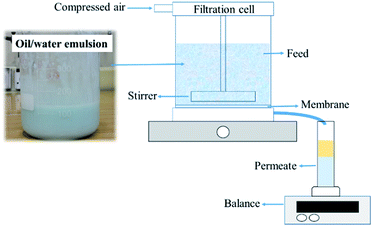
A Millipore Amicon 50 mL stirred filtration cell (Millipore Corporation Billerica, Massachusetts, USA), with an active filtration area of 13.4 cm2, was used to evaluate membrane performance (Fig. 3). The feed solution was prepared by mixing blue-coloured distilled water with vegetable (kitchen) oil in a 1![[thin space (1/6-em)]](https://www.rsc.org/images/entities/char_2009.gif) :
:![[thin space (1/6-em)]](https://www.rsc.org/images/entities/char_2009.gif) 1 volume ratio. Water was coloured using methylene blue to properly observe the separation process. The feed solution was mixed with a hand mixer for a few minutes until a uniform mixture was obtained. The tested dry membrane was placed in the filtration cell, which was then filled with 20 mL of filtrated distilled water. The separation conditions were created under 0.02 bar pressure. A 50 mL oil–water mixture was used for each test. The oil–water mixture did not separate into two phases during filtration. A magnetic stirrer was used to mix the feed solution during filtration. After the separation test, the permeate solution was collected in a glass graduated cylinder tube and sealed tightly to avoid evaporation. The permeate was kept for 24 h to separate into two phases and then determine the resultant water and oil percentages in volume ratio. The oil and water contents were calculated according to eqn (1):
1 volume ratio. Water was coloured using methylene blue to properly observe the separation process. The feed solution was mixed with a hand mixer for a few minutes until a uniform mixture was obtained. The tested dry membrane was placed in the filtration cell, which was then filled with 20 mL of filtrated distilled water. The separation conditions were created under 0.02 bar pressure. A 50 mL oil–water mixture was used for each test. The oil–water mixture did not separate into two phases during filtration. A magnetic stirrer was used to mix the feed solution during filtration. After the separation test, the permeate solution was collected in a glass graduated cylinder tube and sealed tightly to avoid evaporation. The permeate was kept for 24 h to separate into two phases and then determine the resultant water and oil percentages in volume ratio. The oil and water contents were calculated according to eqn (1):
 | (1) |
The permeate flux (F) and permeability (k) of the membrane were calculated according to eqn (2) and (3), respectively:
 | (2) |
 | (3) |
3. Results and discussion
3.1. Surface analysis and characterisation of the unmodified membranes
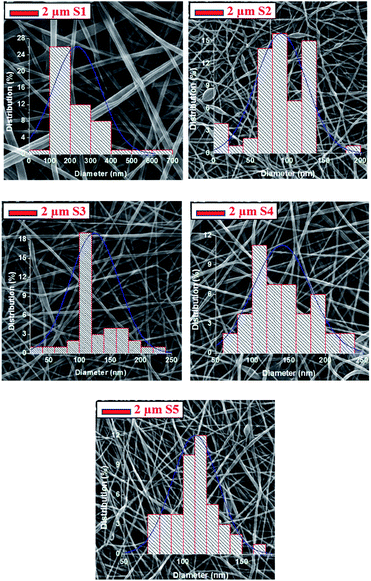
The SEM images in Fig. 4 show that there is no damage to the fibres on the top surface of the substrate, which suggests that the lamination was done successfully.It should be noted that the PVDF nanofibres possess a fibre diameter that is ∼2.5 times larger than that of the PAN nanofibres. Mixing the PVDF polymer with PAN yields a fibre diameter that is ∼1.6 times smaller than that of the neat PVDF sample nanofibres. It was observed that the neat PAN nanofibres have a beaded structure, which could be due to the low viscosity of the PAN solution (Table 1). Bead-free nanofibres were obtained after mixing PAN with PVDF. There were no visible changes in the observed fibre diameter after lamination.
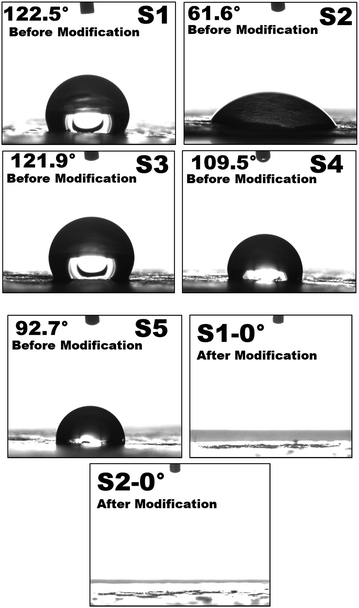
Water contact angle measurements are one of the simplest and easiest methods for determining the hydrophilic or hydrophobic nature of chemical groups attached to the surface of the layers. Based on the water contact angle observations (Fig. 5), it was evident that the addition of PAN increased the hydrophilicity of the resultant PVDF/PAN membranes. The results showed that a neat PAN (S2) web, with a contact angle of less than 90°, could be considered as a hydrophilic material.28 Sample S5 had a contact angle close to 90°, while samples S1, S3 and S4 each had angles larger than 90° and exhibited hydrophobic characteristics. The contact angles changed after surface modification. The plasma and chemical modifications resulted in fully wettable surfaces with a contact angle of 0°. Only two modified images are shown in Fig. 5. Tran et al.29 found that using non-polymer-forming plasma gas treatments, such as Ar, He and O2 plasma treatments, increase the membrane surface hydrophilicity and membrane permeability. Similarly, superhydrophilic PVDF electrospun membranes have been obtained by oxygen plasma treatment. Moreover, the plasma treatment did not significantly influence the average size and morphology of the nanofibres.30 Another study showed that both the surface modifications of PVDF and the surface wettability improved under plasma exposure.31 The most significant result is the hydrophilic modification of the PVDF membrane.
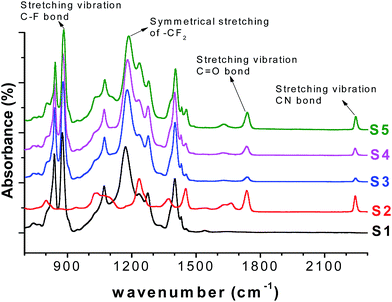
The FTIR spectra were collected to investigate the chemical structure of the PVDF/PAN nanofibrous webs, shown in Fig. 6. The spectra confirmed the presence of both polymers in the blends, the absorption bands at 2240 cm−1 and 1664 cm−1 for the PAN nitrile groups and the stretching bands at 1173 cm−1 and 876 cm−1 for the –CF2 and C–F groups of PVDF, respectively. The characteristic peaks for PVDF and PAN were modified according to the composition of the PVDF/PAN mixture.
3.2. Characterisation of the modified membranes
The mechanism of plasma deposition and chemical surface modification is shown in Fig. 7. Ar plasma treatment and chemical operation with NaOH were used to modify the membrane surfaces. The Ar plasma treatment should crosslink the polymers on the surface fibres and introduce polar groups there, while the chemical operation with NaOH should turn the nitrile groups into more polar carboxylic functionalities. The exploitation of both methods of surface modification should provide more stable and highly hydrophilic properties for the long-lasting service of the membranes.FTIR spectra were used to verify the effect of the plasma and chemical modifications on the composite membrane surfaces of S1, S2 and S4 (Fig. 8–10). Fig. 8–10 show that the modification caused a marked change in the surface functionality for the PVDF membranes, while only slight changes were observed for the PAN and PVDF/PAN (1/1) membranes. Tables 2 and 3 describe the key absorbance peaks of the evaluated membranes in greater detail.
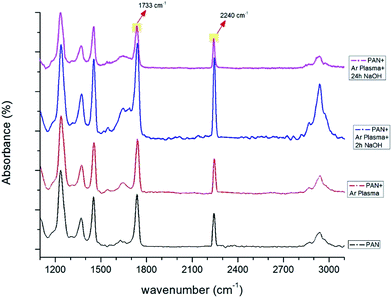 | ||
| Fig. 8 FTIR spectra of PAN membranes before and after surface treatment (only Ar plasma, Ar plasma + 2 h NaOH, Ar plasma + 24 h NaOH). | ||
| Wavelength (cm−1) | Explanation |
|---|---|
| 1240, 1369, 1453, 2938 | Vibration of aliphatic CH groups (CH, CH2, CH3)32 |
| 1733, 1737 | Stretching vibration of the C![[double bond, length as m-dash]](https://www.rsc.org/images/entities/char_e001.gif) O bond. The presence of this C O bond. The presence of this C![[double bond, length as m-dash]](https://www.rsc.org/images/entities/char_e001.gif) O peak could be due to residual DMF in the PAN fibers.32 Moreover, additional surface treatment changes the intensity of the peak due to the carboxylic group on the surface O peak could be due to residual DMF in the PAN fibers.32 Moreover, additional surface treatment changes the intensity of the peak due to the carboxylic group on the surface |
| 2240, 2242 | Stretching vibration of the nitrile groups (CN) in acrylonitrile structure33 |
| Wavelength (cm−1) | Explanation |
|---|---|
| 725 | Methylene swing in-plane vibration due to C–C rocking vibrations in –(CH2)n. The absorbance is originating from exposure of the polymer + plasma bond to air for 20 min34,35 |
| 841 | C–F stretching vibration of PVDF36 |
| 881 | C–C–C asymmetrical stretching vibration of PVDF36 |
| 1175 | Band for –CF2 symmetrical stretching and α phase of PVDF37–39 |
| 1242 | Enhanced carbonyl absorption peak –C–O– stretching band40,41 |
| 1401 | –C–F– stretching39 |
| 1546 | Carboxylate peak asymmetric –O–C–O–42 |
| 1638–1718 | Carbonyl (C![[double bond, length as m-dash]](https://www.rsc.org/images/entities/char_e001.gif) O) stretching vibrations. Primarily centred around 1710–1720 cm−1 (ref. 43) O) stretching vibrations. Primarily centred around 1710–1720 cm−1 (ref. 43) |
| 2853 | Symmetric stretching of CH2 |
| 2925 | Asymmetric stretching of C–H44 |
| 3020 | Asymmetric starching vibration of the CH2 groups45 |
| 2500–3300 | O–H stretching absorption46 |
Compared to unmodified PAN membranes, the peak at 1737 cm−1 shifted to 1733 cm−1 after surface modification (Fig. 8). A sharp increase in the peak at 1733 cm−1 was observed after the plasma treatment and NaOH surface modification, likely due to the presence of an extra carboxylic group on the modified surface.
Significant differences were observed after surface modification of the PVDF membranes (Fig. 9). The very broad and less intense peak between 2500 and 3500 cm−1 was due to O–H functionalities that improve the hydrophilicity of the membranes. The change in peak shape was due to of the extent of hydrogen bond stretching among the alcohol or carboxylic acid groups. These peaks change significantly with the surface modification and length of NaOH treatment. The peak at 2928 cm−1 indicated the C–H stretching frequency due to the parent hydrocarbon chain of the compound.
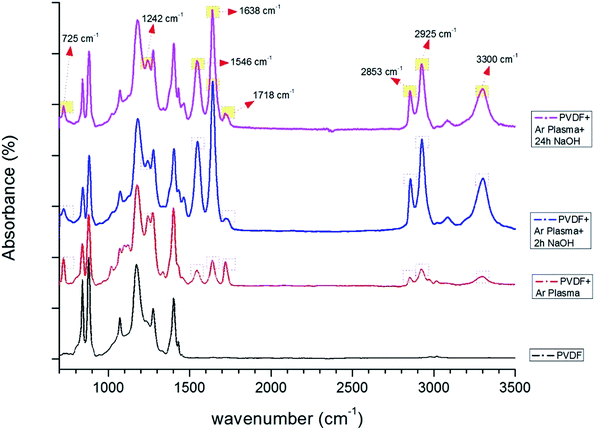 | ||
| Fig. 9 FTIR spectra of PVDF membranes before and after surface treatment (only Ar plasma, Ar plasma + 2 h NaOH, Ar plasma + 24 h NaOH). | ||
There were no significant changes in the PVDF/PAN 1/1 mixture after surface modification (Fig. 10). The FTIR results indicate that the surface of the PVDF membrane was successfully modified, following the modification mechanism shown in Fig. 7. Given the presence of carboxylic groups on the membrane surface, one can expect the highly permeable and anti-fouling reaction of such materials.
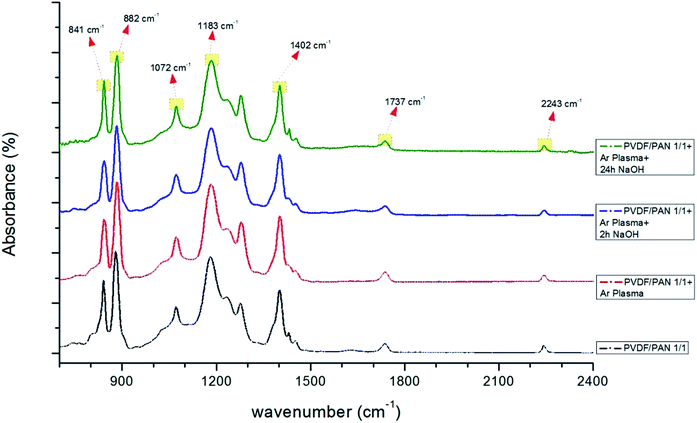 | ||
| Fig. 10 FTIR spectra of PVDF/PAN (1/1) membranes before and after surface treatment (only Ar plasma, Ar plasma + 2 h NaOH, Ar plasma + 24 h NaOH). | ||
3.3. Oil–water separation
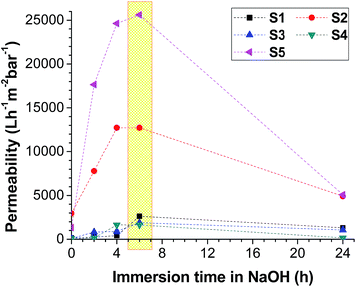
Surface treatment allows for the creation of specific surface chemistries that increase membrane permeability and reduce membrane fouling. However, separation of the oil–water mixture is always difficult, so several microfilters are used for this purpose.The filtration results for the unmodified membranes, as well as the membranes modified by the Ar plasma and NaOH treatments, are shown in Fig. 11. The permeability of the membranes was compared before and after surface modification. The time “0” refers to the membranes without any treatment. The distilled water permeability values increased tremendously for the modified membranes.
The permeability of all of the composite membranes depends on both the surface modification and modification time. It was found that the immersion of the samples in NaOH for 6 h resulted in the highest permeability result for each membrane type (Fig. 11). The highest permeability was achieved for the S5 sample, which was 20 times higher than the permeability of the untreated S5 sample.
It was observed that the permeabilities of S2, S4 and S5 decreased after increasing the NaOH immersion to 24 h (Fig. 11). A commercially available ultrafiltration membrane of PAN was pre-treated in NaOH solution.47 The NaOH-induced hydrolysis of nitrile groups on the membrane surface led to a decrease in both the pore diameter and permeability of the membrane. The average pore diameter underwent a 4.3-fold decrease during the hydrolysis. The results showed that modification of the membrane surface by anchoring carboxylic groups made the surface less prone to protein deposition. The hydrolysis of PAN and PAN/PVDF membranes resulted in the swelling of the PAN polymers and a decrease in pore diameter. The pore sizes of the membranes were not measured after surface modification. The swollen pores apparently reduced the permeability of the membranes. A 6 h NaOH treatment seems optimum for all membranes.
An example filtration procedure for an oil–water mixture through the prepared membranes is shown in Fig. 12, with the results of the separation included in Table 4.
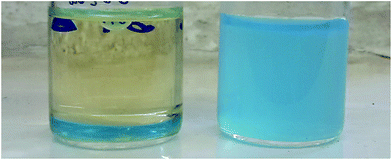 | ||
| Fig. 12 Permeates after oil–water filtration. Sample S1 (left) and S2 (right) after 4 h in NaOH solution. | ||
| Time in NaOH (h) | Water content (%) | Oil content (%) | ||||||||
|---|---|---|---|---|---|---|---|---|---|---|
| S1 | S2 | S3 | S4 | S5 | S1 | S2 | S3 | S4 | S5 | |
| 0 | 0 | 100 | 0 | 50 | 73 | 100 | 0 | 100 | 50 | 27 |
| 2 | 10 | 100 | 26 | 100 | 81 | 90 | 0 | 74 | 0 | 19 |
| 4 | 18 | 100 | 50 | 100 | 86 | 82 | 0 | 50 | 0 | 14 |
| 6 | 74 | 100 | 100 | 100 | 100 | 26 | 0 | 0 | 0 | 0 |
| 24 | 78 | 100 | 100 | 100 | 100 | 22 | 0 | 0 | 0 | 0 |
The results in Table 4 show that the modification of the nanofibrous membranes had a great effect on the selectivity of the membranes. The membranes in the first row, with a zero immersion time, had no surface treatment. Opposite to unmodified PAN, the unmodified PVDF shows hydrophobic/oleophilic properties. Similar results were recorded in the literature, where the neat PVDF membranes showed hydrophobic/oleophilic characteristics either in surfactant-free water-in-oil emulsion or a surfactant-stabilised water-in-oil emulsion.48–50 The hydrophilicity and oleophilicity of the unmodified membranes change based on the ratio of PVDF/PAN. In the sample of PAN composite membranes, the hydrophilic/oleophobic characteristics of the PAN did not change after surface modification. However, the water permeability of the PAN composite membranes underwent a 4-fold improvement after 6 h of immersion in the NaOH solution. It was observed that surface modification of neat PVDF allowed the material to exhibit hydrophilic properties. The literature showed that treated PVDF membranes can convert the membrane from being highly hydrophobic to being superhydrophilic when wetted with water and with a high permeability.51,52 When the porous hydrophobic material is immersed in water, the water cannot penetrate the pores. However, the reduction of the surface tension of the solution (by the addition of salt or NaOH) made the membranes ‘permeable’ for water. The effects of both the surface modification and the increase in pore permeability improve the membrane hydrophilicity. Zhang et al.53 prepared a superhydrophilic/superoleophobic PAN ultrafiltration membrane by an alkaline-induced phase inversion process by the addition of NaOH into coagulation bath. This induced the in situ hydrolysis of –CN groups in the PAN chain to –COOH groups, which resulted in the superwetting of the PAN membranes. The membrane showed ultralow oil adhesion, thus endowing the membrane with superior oil–water separation properties and a high water permeability.
The mixture of polymers showed that it was possible to control the oil or water uptake by altering the time of modification. In general, it is possible to conclude that the surface modification of the membranes improves their hydrophilicity while decreasing their oleophilicity. PVDF nanofibres had a better mechanical and abrasion resistance compared to the PAN nanofibres. Surface-modified PVDF nanofibres seem to be suitable for the separation of water from water–oil mixtures. Moreover, it was found that a mixture of PVDF with PAN can be hydrophilic/oleophobic and gain a higher permeability compared to neat PVDF and neat PAN membranes.
The study presents the first industrial nanofibre production method to fabricate nanofibres for the separation of oily wastewater. Moreover, easy spinnable polymers and an inexpensive surface modification method were used to change surface hydrophilicity and oleophobicity. Compared to similar studies in the literature, the membranes tested here showed very high permeability after separation.54–58
Based on the permeability and selectivity results, S5 was selected as the best candidate for the filtration of oily wastewater. The surface morphology of S5 was investigated by SEM image after surface modification and separation test, as shown in Fig. 13.
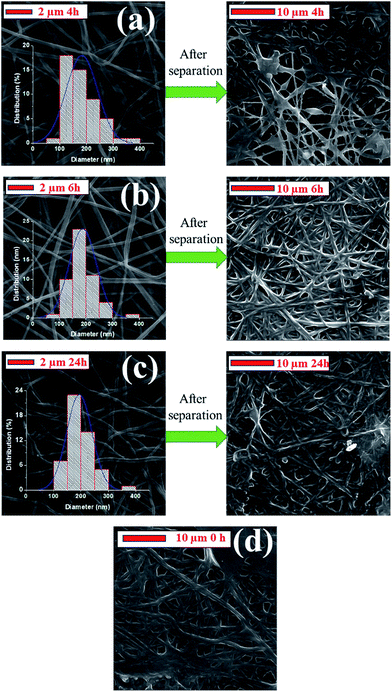 | ||
| Fig. 13 SEM images of sample S5 after: (a) 4 h, (b) 6 h and (c) 24 h surface modification and their SEM images after the separation test, (d) unmodified membrane after the separation test. | ||
The SEM results showed that the diameter of the nanofibres increased with increasing immersion time, while the size distribution of the nanofibres improved. This is due to the swelling of PAN nanofibres in the NaOH aqueous solution. Similar results were obtained in the literature.47 Yang et al.59 found that after immersing the PAN membranes in NaOH, the hydraulic permeability decreased, and an increase in the rejection of dextran was observed due to the swelling of the hydrolysed layer. Kim et al.60 found that the annealed PAN membrane underwent a decrease in pore size after it was treated with 2 M NaOH or CH3ONa for over 2 h. The reason for this is that NaOH-induced hydrolysis of the nitrile groups on the membrane surface results in membranes with decreasing pore diameters. The pore diameters of the samples were not measured after modification, because the pore size measurements were done on dry membranes. Drying the wet nanofibre web would cause cracking on the surface of the nanofibres, which highlights that it is better to keep the membrane in a wet condition once it has been wetted. After surface modification, the membranes were kept in distilled water until the separation test was run. The SEM results indicate that fibres grew and became flattened, likely due to the decrease in pore size. After separation, the membranes were dried in the oven without any cleaning, and the SEM images were taken. The images showed that after oil separation, all membrane surfaces were contaminated with oil (Fig. 13). The fibres are barely visible under a cake layer. The permeability results of the 24 h modification were quite low compared to the 2, 4 and 6 h separation tests. It is visible from the SEM image that the total surface of the 24 h modified membrane was totally covered with an oil film, which led to a marked decrease in its permeability.
4. Conclusions
Functional PVDF, PAN and PVDF/PAN nanofibrous composite membranes were successfully fabricated for the separation of an oily wastewater. It was found that both the polymer blending method and modification of the membranes can change the surface hydrophilicity and oleophilicity. These changes can be attributed to structural changes in the membranes to decrease surface energy and increase in pore permeability.The membrane permeability can also be altered based on the chemical treatment parameters. In the case of membranes with modified PAN, water permeability increases dramatically. Depending on modification parameter, a permeability of 25![[thin space (1/6-em)]](https://www.rsc.org/images/entities/char_2009.gif) 000 L m−2 h bar−1 was achieved with Ar plasma exposure followed by NaOH modification. The FTIR results confirm the polymer mixture and surface modification. Contact angle measurements showed that after surface treatment, membranes become highly hydrophilic, with the water drop immediately disappearing. SEM studies revealed no physical damage to the polymer surface lamination.
000 L m−2 h bar−1 was achieved with Ar plasma exposure followed by NaOH modification. The FTIR results confirm the polymer mixture and surface modification. Contact angle measurements showed that after surface treatment, membranes become highly hydrophilic, with the water drop immediately disappearing. SEM studies revealed no physical damage to the polymer surface lamination.
The distilled water flux for the modified membranes increased dramatically because of its high hydrophilicity. The oily wastewater fouling was considerably reduced by the membrane flux for modified membranes.
Improved strength and, in the instance of PVDF, the improved wettability of the membranes, make them more suitable for aqueous filtration. These prepared membranes could thus be used for the practical microfiltration of oily wastewater.
Conflicts of interest
There are no conflicts to declare.Acknowledgements
This work was supported by the Ministry of Education, Youth and Sports of the Czech Republic in the framework of the targeted support of the “National Programme for Sustainability I” (project LO1201) and the Czech Republic Operational Programme Research and Development for Innovation (OPR & DI; project CZ.1.05/2.1.00/19.0386). The authors would also like to thank Mrs Jana Mullerova for her help in the FTIR measurements.Notes and references
- M. A. Zahed, H. A. Aziz, M. H. Isa, L. Mohajeri and S. Mohajeri, Bioresour. Technol., 2010, 101, 9455–9460 CrossRef CAS PubMed.
- A. Vidyasagar, K. Handore and K. M. Sureshan, Angew. Chem., Int. Ed., 2011, 50, 8021–8024 CrossRef CAS PubMed.
- R. R. Fouad, H. A. Aljohani and K. R. Shoueir, Mar. Pollut. Bull., 2016, 112, 46–52 CrossRef CAS PubMed.
- J. Kim and B. Van der Bruggen, Environ. Pollut., 2010, 158, 2335–2349 CrossRef CAS PubMed.
- X. Zhao, Y. Su, W. Chen, J. Peng and Z. Jiang, J. Memb. Sci., 2012, 415–416, 824–834 CrossRef CAS.
- S. Kang, A. Asatekin, A. M. Mayes and M. Elimelech, J. Memb. Sci., 2007, 296, 42–50 CrossRef CAS.
- X. X. Xu, C. L. Zhou, B. R. Zeng, H. P. Xia, W. G. Lan and X. M. He, Sep. Purif. Technol., 2012, 96, 229–236 CrossRef CAS.
- S.-H. Oh, J.-W. Ma, J. M. Bae, Y. Kang, J.-P. Ahn, H.-K. Kang, J. Chae, D. Suh, W. Song, S. Kim and M.-H. Cho, Appl. Surf. Sci., 2017, 419, 1–8 CrossRef CAS.
- Z. Xu, K. Miyazaki and T. Hori, Appl. Surf. Sci., 2016, 370, 243–251 CrossRef CAS.
- I. Gancarz, M. Bryjak, J. Wolska, A. Siekierka and W. Kujawski, Chem. Pap., 2016, 70, 350–355 CAS.
- M. Tsuchida and Z. Osawa, Colloid Polym. Sci., 1994, 272, 770–776 CAS.
- I. Punga and G. Borcia, J. Adv. Res. Phys., 2013, 4, 1–5 CrossRef PubMed.
- J. G. A. Terlingen, H. F. C. Gerritsen, A. S. Hoffman and J. Feijen, J. Appl. Polym. Sci., 1995, 57, 969–982 CrossRef CAS.
- K. Y. Wang, S. W. Foo and T. S. Chung, Ind. Eng. Chem. Res., 2009, 48, 4474–4483 CrossRef CAS.
- W. Chen, Y. Su, J. Peng, X. Zhao, Z. Jiang, Y. Dong, Y. Zhang, Y. Liang and J. Liu, Environ. Sci. Technol., 2011, 45, 6545–6552 CrossRef CAS PubMed.
- A. K. Manna, M. Sen, A. R. Martin and P. Pal, Environ. Pollut., 2010, 158, 805–811 CrossRef CAS PubMed.
- M. Amirilargani, A. Sabetghadam and T. Mohammadi, Polym. Adv. Technol., 2012, 23, 398–407 CrossRef CAS.
- B. P. Tripathi, N. C. Dubey, R. Subair, S. Choudhury, M. Stamm, K. T. Gause, J. J. Richardson, F. Caruso and V. Abetz, RSC Adv., 2016, 6, 4448–4457 RSC.
- R. M. Elkhaldi, S. Guclu and I. Koyuncu, Desalin. Water Treat., 2016, 57, 26003–26013 CrossRef CAS.
- O. Jirsak, F. Sanetrnik, D. Lukas, V. Kotek, L. Martinova and J. Chaloupek, WO Pat., WO/2005/024101, 2005.
- K. Smolinska, M. Bryjak, J. Wolska and W. Kujawski, Mater. Chem. Phys., 2014, 148, 548–553 CrossRef CAS.
- K. Smolinska and M. Bryjak, Desalination, 2012, 300, 64–69 CrossRef CAS.
- M. Ulbricht and G. Belfort, J. Memb. Sci., 1996, 111, 193–215 CrossRef CAS.
- D. S. Wavhal and E. R. Fisher, J. Memb. Sci., 2002, 209, 255–269 CrossRef CAS.
- M. Suzuki, A. Kishida, H. Iwata and Y. Ikada, Macromolecules, 1986, 19, 1804–1808 CrossRef CAS.
- M. Gorjanc, M. Mozetič, G. Primc, A. Vesel, K. Spasić, N. Puač, Z. L. Petrović and M. Kert, Appl. Surf. Sci., 2017, 419, 224–234 CrossRef CAS.
- Y. Fatma, A. Siekierka, M. Bryjak and J. Maryska, IOP Conf. Ser.: Mater. Sci. Eng., 2017, 254, 102011 CrossRef.
- F. Yalcinkaya, B. Yalcinkaya, J. Hruza and P. Hrabak, Sci. Adv. Mater., 2017, 9, 747–757 CrossRef CAS.
- T. D. Tran, S. Mori and M. Suzuki, Thin Solid Films, 2007, 515, 4148–4152 CrossRef CAS.
- D. M. Correia, C. Ribeiro, V. Sencadas, G. Botelho, S. A. C. Carabineiro, J. L. G. Ribelles and S. Lanceros-Méndez, Prog. Org. Coatings, 2015, 85, 151–158 CrossRef CAS.
- M. D. Duca, C. L. Plosceanu and T. Pop, Polym. Degrad. Stab., 1998, 61, 65–72 CrossRef CAS.
- J. Li, S. Su, L. Zhou, V. Kundrát, A. M. Abbot, F. Mushtaq, D. Ouyang, D. James, D. Roberts and H. Ye, J. Appl. Phys., 2013, 113, 24313 CrossRef.
- S. N. M. Salleh, M. Z. Abdullah and A. A. Wahab, MATEC Web Conf., 2014, 13, 4014 CrossRef.
- E.-G. Schlosser, Angew. Chemie, 1987, 99, 284 CrossRef.
- N. Naresh Kumar, S. Yap, F. bt Samsudin, M. Khan and R. Pattela Srinivasa, Polymers, 2016, 8, 295 CrossRef.
- H. Bai, X. Wang, Y. Zhou and L. Zhang, Prog. Nat. Sci.: Mater. Int., 2012, 22, 250–257 CrossRef.
- R. Li, C. Chen, J. Li, L. Xu, G. Xiao, D. Yan, B. Liu, G. M. Veith, S. Dai, Q. H. Yang, H. M. Ning, J. H. Li, Y. Li and Y. H. Zhao, J. Mater. Chem. A, 2014, 2, 3057 CAS.
- D. Mandal, K. Henkel and D. Schmeisser, J. Phys. Chem. B, 2011, 115, 10567–10569 CrossRef CAS PubMed.
- F. Yalcinkaya, B. Yalcinkaya, A. Pazourek, J. Mullerova, M. Stuchlik and J. Maryska, Int. J. Polym. Sci., 2016, 2016, 4671658 Search PubMed.
- B. Yan and B. Zhang, Analytical methods in combinatorial chemistry, CRC Press, 2011 Search PubMed.
- R. Bodîrlău, R. Bodîrlău and C. A. Teacă, Rom. J. Phys., 2008, 93–104 Search PubMed.
- G. E. Dunn and R. S. McDonald, Can. J. Chem., 1969, 47, 4577–4588 CrossRef CAS.
- V. N. Rai, C. Mukherjee and B. Jain, Indian J. Pure Appl. Math., 2017, 55, 775–785 Search PubMed.
- G. C. Nille, V. K. Singh and K. R. C. Reddy, J. Ayurveda Holist. Med., 2016, 4, 1–11 Search PubMed.
- A. Bashir, S. K. Raghuvanshi, S. Hartha, N. P. Sharma, J. B. M. Krishna and M. A. Wahab, Prog. Nanotechnol. Nanomater., 2013, 2, 42–46 Search PubMed.
- B. S. Gupta, B. P. Jelle, T. Gao and T. Gao, Int. J. Spectrosc., 2015, 2015, 1–7 CrossRef.
- M. Bryjak, H. Hodge and B. Dach, Appl. Macromol. Chem. Phys., 1998, 260, 25–29 CAS.
- W. Zhang, Z. Shi, F. Zhang, X. Liu, J. Jin and L. Jiang, Adv. Mater., 2013, 25, 2071–2076 CrossRef CAS PubMed.
- J. Kong and K. Li, Sep. Purif. Technol., 1999, 16, 83–93 CrossRef CAS.
- Z. Zhou and X.-F. Wu, Mater. Lett., 2015, 160, 423–427 CrossRef CAS.
- M. Obaid, H. O. Mohamed, A. S. Yasin, M. A. Yassin, O. A. Fadali, H. Kim and N. A. M. Barakat, Water Res., 2017, 123, 524–535 CrossRef CAS PubMed.
- W. Zhang, Y. Zhu, X. Liu, D. Wang, J. Li, L. Jiang and J. Jin, Angew. Chem., Int. Ed., 2014, 53, 856–860 CrossRef CAS PubMed.
- F. Zhang, S. Gao, Y. Zhu and J. Jin, J. Memb. Sci., 2016, 513, 67–73 CrossRef CAS.
- C. Yang, G. Zhang, N. Xu and J. Shi, J. Memb. Sci., 1998, 142, 235–243 CrossRef.
- X. Hu, Y. Yu, J. Zhou, Y. Wang, J. Liang, X. Zhang, Q. Chang and L. Song, J. Memb. Sci., 2015, 476, 200–204 CrossRef CAS.
- M. H. Tai, P. Gao, B. Y. L. Tan, D. D. Sun and J. O. Leckie, ACS Appl. Mater. Interfaces, 2014, 6, 9393–9401 CAS.
- C.-T. Hsieh, J.-P. Hsu, H.-H. Hsu, W.-H. Lin and R.-S. Juang, Surf. Coat. Technol., 2016, 286, 148–154 CrossRef CAS.
- C. Li, C. Song, P. Tao, M. Sun, Z. Pan, T. Wang and M. Shao, Sep. Purif. Technol., 2016, 168, 47–56 CrossRef CAS.
- M.-C. Yang and J.-H. Tong, J. Memb. Sci., 1997, 132, 63–71 CrossRef CAS.
- I.-C. Kim, H.-G. Yun and K.-H. Lee, J. Memb. Sci., 2002, 199, 75–84 CrossRef CAS.
| This journal is © The Royal Society of Chemistry 2017 |

