 Open Access Article
Creative Commons Attribution 3.0 Unported Licence
Poly(anhydride) nanoparticles act as effective adjuvants to elicit a persistent immune response†
Caixia Liu‡
,
Qiuxai Shen‡,
Wenwen Zheng,
Yao Lv,
Xinyu Chen,
Xiaoheng Li,
Qiqi Zhu,
Xiaoling Guo,
Renshan Ge* and
Chao Li *
*
The Second Affiliated Hospital and Yuying Children’s Hospital of Wenzhou Medical University, 109 Xueyuan West Road, Wenzhou 325027, P. R. China. E-mail: dishboy@163.com; r_ge@yahoo.com
First published on 7th December 2017
Abstract
In order to evoke an efficient immune response to prevent and eliminate infectious and malignant diseases, it is critical to develop more effective and safer vaccines or adjuvants to enhance the antigenicity of natural antigens. The objective of this study is to produce nanoparticles composed of poly(methyl vinyl ether-co-maleic anhydride) (PVM/MA) and the model antigen ovalbumin (OVA), termed as p-OVAs, to assess the antigen sustained release property and the effectiveness in the immune responses in BALB/c mice. The results showed that the p-OVAs were spherical, evenly distributed with an average diameter of ∼290 nm, and had a sustained release property in vitro. After immunization of BALB/C mice with p-OVA, strong OVA-specific cellular and humoral immune responses were observed in vivo. The whole blood cell tests and histological results also suggested that immunization with p-OVA is both effective and relatively safe. Overall, here we provide new insight into future vaccine and/or adjuvant design with PVM/MA, which is promising for the immunotherapy of cancer and autoimmune diseases.
1. Introduction
Many infectious and malignant diseases are expected to be preventable and/or eliminated with effective vaccines. However, due to the weak or non-specific antigenicity of natural pathogens or mutations, these antigens often arouse feeble immune responses in vivo,1 and therefore an adjuvant is often introduced in vaccination.2 By altering the surface or physical properties of antigen, the adjuvant can produce effective lymphatic system stimulation, prolong the antigen retention time, enhance antigen processing, have effect on mononuclear phagocytes, increase lymphocyte differentiation, and expand the coverage of the immune response in vivo.3 However, the traditional adjuvants, including aluminum-based and Freund’s adjuvants, due to their failure to induce cell immunity, unsuitability for some antigens, and side effects, are not allowed as formulations for the vaccination of humans or animals.4,5 Therefore, it is crucial to develop more effective and safer adjuvants to evoke an efficient immune response in vivo.In vaccine development and delivery, nanotechnology plays significant roles and has shown promising potential. To date, several types of nanocarrier, such as ultra-small graphene oxide (GO)6,7 and polymeric nanoparticles,8 as well as nanomaterial-based cell fusion,9 have been investigated intensively, and have led to many achievements in vaccine delivery and adjuvant stimulation. As an immunopotentiator, the nanoparticle-based delivery system has the effects of promoting the persistence of the antigen in peripheral circulation, facilitating the access of the antigen to antigen-presenting cells (APCs), regulating the antigen presentation pathway, and enhancing the antigen-specific immune response in vivo.10 Nanoparticle-based adjuvants also offer the protective effects of preventing antigen degradation by proteolytic enzymes.11 In the nanoparticle preparation, the antigen can be integrated with nanomaterials by adsorption, chemical conjugation, or encapsulation, resulting in a high-intensity intermolecular linkage between the antigen and nanomaterials that will facilitate the prevention of the rapid degradation of the antigenic components effectively.12
Although many remarkable achievements with nanomaterial-based adjuvants have been presented in previous reports, including with ultra-small GO,6,7 inorganic silicon nanoparticles,13 and gold nanoparticles,14 there are still many unsolved problems, such as the final outcome and the in vivo degradation pathway, which need further clarification. Therefore, to prepare safer and more effective immune adjuvants, a non-cytotoxic and biodegradable material should be the ideal candidate for controlled antigen release.
Copolymers of lactic acid and glycolic acid (PLGA) as a biodegradable material have been widely used in drug delivery and adjuvant research.15,16 However, the final metabolites of the lactic acid and glycolic acid of PLGA may cause subtle changes in the micro-environment in vivo,17 which results in the decreased stability of the entrapped antigen, or they may become encapsulated in nanoparticles, as well as having a negative impact on the immunogenicity.
Compared with the PLGA system, poly(anhydride) is also a biodegradable material, with carboxylic acid as the main final metabolite, and it has fewer acidic groups and a lower acidity content than the PLGA system, and has no mutagenicity or cytotoxicity.18 Moreover, the poly(anhydride) of the poly(methyl vinyl ether-co-maleic anhydride) copolymer (PVM/MA) has been widely used in drug carrier and antigen delivery,19,20 and the nanoparticles prepared with the PVM/MA system have shown ideal bioadhesive interactions with mucosa.21,22 Cooperating with the anhydride-based antigen delivery system and bioadhesive interaction, the PVM/MA-based nano-adjuvants have been proven to enhance the Th1 immune response in vivo.23,24
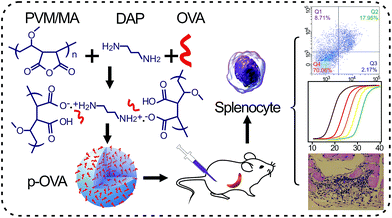
In this study, we attempt to elucidate the potential mechanism of the PVM/MA-based nanomaterial as an adjuvant and its interaction with the immune system in vitro and in vivo. Ovalbumin (OVA), the model antigen, was introduced to prepare PVM/MA-based OVA-containing nanoparticles (p-OVAs) via a cross-linking agent (Scheme 1). The OVA release kinetics from p-OVA in biological fluids and the in vivo immune activation were evaluated systematically. Our results reveal that the p-OVA nano-adjuvant has a slow and sustained antigen-releasing ability, elicits the antigen-specific immune responses, and activates immune memory cells and cytotoxic T lymphocyte cells (CTLs) in vivo. The results also confirmed that the p-OVA system can be introduced as a potential immune agonist to achieve satisfactory antigen-release persistence and to trigger and produce the appropriate immune response in vivo.
2. Materials and methods
2.1 Materials
Poly(methyl vinyl ether-co-maleic anhydride) (PVM/MA, average MW: 216![[thin space (1/6-em)]](https://www.rsc.org/images/entities/char_2009.gif) 000), 1,3-diaminopropane (DAP, 98%), ovalbumin (OVA), ethanol, acetone, and chloral hydrate were purchased from Aladdin Co., Ltd. (Shanghai, China). The following reagents were also used for the experiments: X-vivo medium (Lonza, Walkersville, MD, USA), Micro-BCA protein assay kits, a WST-1 kit, and a CFDA-SE kit (Beyotime, Shanghai, China). The fluorescence-labeled antibodies, including PE-anti-CD3e, FITC-anti-CD4, PerCP-Cy5.5-anti-CD8a, and Trizol reagent, were bought from BD Biosciences (Mountain View, CA, USA). The reverse transcription system was bought from Promega Corporation (Madison USA) and LightCycler® 480 SYBR Green I Master was obtained from Roche (Indianapolis, USA). The anti-OVA antibody ELISA (IgG) kit was purchased from Abcam (Cambridge, UK).
000), 1,3-diaminopropane (DAP, 98%), ovalbumin (OVA), ethanol, acetone, and chloral hydrate were purchased from Aladdin Co., Ltd. (Shanghai, China). The following reagents were also used for the experiments: X-vivo medium (Lonza, Walkersville, MD, USA), Micro-BCA protein assay kits, a WST-1 kit, and a CFDA-SE kit (Beyotime, Shanghai, China). The fluorescence-labeled antibodies, including PE-anti-CD3e, FITC-anti-CD4, PerCP-Cy5.5-anti-CD8a, and Trizol reagent, were bought from BD Biosciences (Mountain View, CA, USA). The reverse transcription system was bought from Promega Corporation (Madison USA) and LightCycler® 480 SYBR Green I Master was obtained from Roche (Indianapolis, USA). The anti-OVA antibody ELISA (IgG) kit was purchased from Abcam (Cambridge, UK).
2.2 Preparation and characteristics of p-OVA nanoparticles
The p-OVAs were prepared by the solvent displacement method.25 Briefly, 50 mg PVM/MA and 5 mg OVA were dissolved in 2.5 mL acetone and 2.5 mL deionized water, respectively. The solutions were mixed and stirred at 37 °C for 1 h to form a homogeneous solution and for nucleation occur, then different doses of the cross-linking agent, 1,3-diaminopropane (DAP, 98%), and 5 mL ethanol were added, and the solutions were stirred for another 10 min to solidify the p-OVA nanoparticles. The products were purified with ultrafilter (50 kDa cutoff, Millipore, USA) against deionized water three times, lyophilized, and stored at 4 °C for later use. The plain nanoparticles of PVM/MA without OVA were prepared in parallel as the control.The optical properties of the initial OVA, PVM/MA, and p-OVA solutions were measured in UV-visible spectrophotometer (Cary 50 Conc, Varian, Palo Alto, CA, USA). The hydrodynamic diameter and ζ-potential of the p-OVAs were investigated by Zetasizer Nano ZSP (Malvern Instruments, Ltd., Worcestershire, UK). In order to evaluate the NPs’ stability over time with n additions, we re-suspended the PVM/MA NPs and p-OVAs in PBS (pH 7.4) at room temperature, and the particle size distribution was measured every day for a week. The size and morphology of the p-OVAs were also determined using transmission electron microscopy (TEM, JEM-2100, JEOL Ltd., Japan) and field-emission scanning electron microscopy (SEM, ZEISS Supra 55, Germany). Further characteristics of OVA, PVM/MA, and p-OVA were determined with Fourier transform infrared spectroscopy (FTIR, Equinox 55, Bruker, Karlsruhe, Germany).
In order to determine the OVA encapsulation efficiency, the ultrafiltrate was collected during the preparation of the p-OVA nanoparticles, and the OVA content in the filtrate was determined by the Micro-BCA protein assay kit following the protocol provided by the manufacturer. The standard curve was established with pure OVA dissolved in PBS, and the filtrate of the blank PVM/MA nanoparticles was collected as the blank control. The encapsulation efficiency was calculated according to the formula: (1 − Cf/Ct) × 100% (Cf: the amount of OVA in the filtrate; Ct: total OVA added in the p-OVA synthesis).
2.3 Release property of p-OVA in vitro
The in vitro release property of OVA from the p-OVA nanoparticles was measured in PBS at 37 °C. Briefly, 1.7 mg p-OVA nanoparticles (containing 1 mg OVA) was dispersed homogeneously in 5 mL PBS and centrifuged at 13![[thin space (1/6-em)]](https://www.rsc.org/images/entities/char_2009.gif) 000 × g at 4 °C for 10 min. The supernatant was aspirated and stored at −20 °C for the 0-time point test. The precipitant was re-suspended in 5 mL of fresh PBS and gently stirred at 120 rpm at 37 °C for 1/4, 1/2, 1, 2, 3, 4, 6, 8, 18, 24, 36, 48, and 72 h. The amount of OVA released from the p-OVAs into the supernatant was determined by the Micro-BCA protein assay kits and expressed as the cumulative mean of three independent experiments. The standard curve was plotted for a standard volume of OVA in PBS.
000 × g at 4 °C for 10 min. The supernatant was aspirated and stored at −20 °C for the 0-time point test. The precipitant was re-suspended in 5 mL of fresh PBS and gently stirred at 120 rpm at 37 °C for 1/4, 1/2, 1, 2, 3, 4, 6, 8, 18, 24, 36, 48, and 72 h. The amount of OVA released from the p-OVAs into the supernatant was determined by the Micro-BCA protein assay kits and expressed as the cumulative mean of three independent experiments. The standard curve was plotted for a standard volume of OVA in PBS.
2.4 Animal immunization
The animal experiments were carried out in accordance with the Guide for Care and Use of Laboratory Animals published by the US National Institute of Health (NIH publication no. 85-23, revised 1996) and approved by the Ethics Committee for Animal Experimentation, Wenzhou Medical University (SYXK-2015-0009). The mice were purchased from Nanjing University Model Animal Institute (Nanjing, China), and handled and cared in the animal house facility with free access to food and water. A total of 32 male BALB/c mice (8 weeks old, 21 ± 2 g) were divided into 4 groups for PBS, PVM/MA (1 mg mL−1), OVA (1 mg mL−1), and p-OVA (1 mg mL−1 of OVA), respectively. On day 0, 10, and 20, the mice were immunized by intramuscular injection in the right hind leg. 2 weeks and 6 weeks after the last immunization, half of the mice were anesthetized with chloral hydrate (10%, 4 μg g−1 body weight), the whole blood and the main organs were collected, and the lymphocytes were extracted from parts of the spleen and cultured in ex vivo.2.5 Lymphocyte proliferation and viability after OVA stimulation
6 weeks after immunization, the splenocytes were extracted from the different groups (PBS, PVM/MA, OVA, and p-OVA), seeded in 96-well plates (2 × 10⁴ cells per well), and stimulated with OVA (1, 10, and 50 μg mL−1) for 72 h again, and the cell viability was assessed with a WST-1 kit. To assess the proliferative performance, 5 × 10⁶ splenocytes for each group were labeled with the CFDA-SE kit and cultured with OVA (10 μg mL−1) for an additional 72 h. The proliferative ratios were tested using flow cytometry (Beckman 2000) and the proliferation index was analyzed by recording the total number of cells after proliferation to the total number of cells before proliferation with FlowJo (v 5.7.2, Tree Star, Ashland, Oregon).2.6 The percentage of CD4+ and CD8+ T cells
BALB/c mice were vaccinated with PBS, PVM/MA, OVA, and p-OVA (50 μg OVA each time) three times within 20 days. Six weeks later, the splenocytes were collected, and 2 × 10⁶ cells were seeded in 35 mm plates and cultured with OVA (10 μg mL−1) for 72 h. The stimulated splenocytes were harvested and stained with fluorescent anti-mouse antibodies, including PE-anti-CD3e, FITC-anti-CD4, and PerCP-Cy5.5-anti-CD8a, and analyzed by flow cytometry.2.7 Quantitative PCR analysis of cytokine-related mRNA expression
According to the previous reports, the mRNA levels of IFN-γ, IL-17A, TNF-α, IL-10, and IL-6 in splenocytes were detected by qPCR, and GAPDH was used as the internal reference. Briefly, the total RNA was extracted with Trizol reagent from the spleen of the mice 2 weeks and 6 weeks following the final immunization, and the PrimerScript® RT reagent kit with a gDNA eraser was used for reverse transcription. The qPCR was performed with the reverse transcription system and LightCycler® 480 SYBR Green I Master. The primers were designed with Primer Premier Software (PREMIER, Biosoft International, Canada) and are listed in Table S1.† The variation of the expression levels of the target genes was calculated with the standard curve method.2.8 Anti-OVA antibody titer by ELISA
2 weeks and 6 weeks following the last immunization, half of the mice in the four groups (PBS, OVA, PVM/MA, and p-OVA) were sacrificed, serums were collected, and the titers of anti-OVA antibody (IgG) in the serum were determined by ELISA. The anti-OVA antibody titers were calculated from the standard curve and the OD value of 450 nm for the test. All experiments were repeated three times.2.9 Histological and complete blood cell analysis
Six weeks following the final immunization, the main organs (heart, liver, lung, kidney, spleen, and muscle) were collected for H&E staining as routine. In addition, the whole blood of the immunized mice was collected into blood collection tubes (BD Biosciences, USA), and the cells were counted using the HF-3800 system (Healife, Beijing).2.10 Statistical analysis
All data are shown as the means ± SD in the legends. Data were treated by SPSS 11 software. Comparison of the means used the Student’s t-test and one-way analysis of variance to determine the statistical difference; when the p-value was 0.05 or less, the differences were considered statistically significant.3. Results and discussion
3.1 Characterization of p-OVA
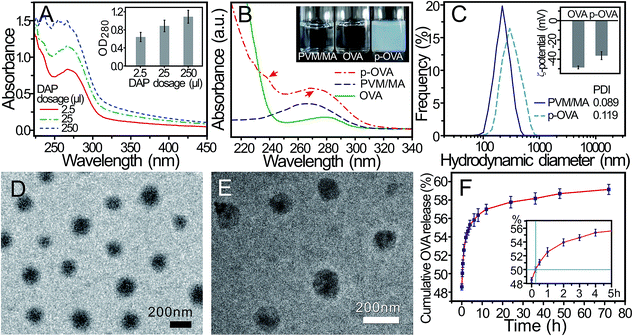
In the preparation of the p-OVA nanoparticles, the dosage of the cross-linking agent directly determines many important parameters of the final products, such as the particle size and OVA encapsulation efficiency. In this study, different doses of DAP (2.5, 25, and 250 μL) were used to prepare the p-OVA nanoparticles (5 mL). The UV-vis spectra of the final products were recorded with a UV-visible spectrophotometer and the absorbance of p-OVA at 280 nm was recorded to estimate the encapsulation efficiency.As shown in Fig. 1A, with the increased dose of DAP, the absorbance of the p-OVA nanoparticles at 280 nm increased synchronously (the inset in Fig. 1A), as well as the encapsulation efficiency increasing. However, with a dosage of DAP above 25 μL, the size of the final cross-linked products will exceed the nanoscale and some aggregates can be observed. When the dosage of DAP reached 250 μL, a great deal of agglomeration occurred. Therefore, in the later experiments, we used 2.5 μL DAP as the best cross-linker volume for 5 mL of the p-OVA product, and the encapsulation efficiency was determined to be 84.3 ± 2.6%.
Fig. 1B shows the regular interval UV-vis spectra of PVM/MA in acetone and the aqueous solutions of OVA and p-OVA; the absorption peaks of PVM/MA and OVA are located at 266 nm and 280 nm, respectively. The solutions of PVM/MA in acetone and OVA in water are all transparent and colourless (the inset in Fig. 1B). After the solutions were mixed and the cross-linking agent (DAP, 2.5 μL) was added, the p-OVA nanoparticles were formed, and the solution became milky white and translucent (the inset in Fig. 1B). Two weak peaks located at 239 nm and 272 nm can be found in the p-OVA spectra (red arrows), and this curve indicates the formation of the doped nanoparticles of p-OVA26 and the shift of the absorption peak originates primarily from the light absorption and scattering of p-OVA.
To further investigate the characteristics of the p-OVA nanoparticles, the hydrodynamic diameter of p-OVA and the ζ-potential of OVA and p-OVA were assessed by dynamic light scattering (DLS) and electrophoretic light scattering (ELS), respectively. Fig. 1C demonstrates the uniform distribution of the hydrodynamic diameters of the PVM/MA NPs and p-OVAs with the centre at 220 ± 21.3 nm and 290 ± 37.5 nm, respectively. The measurement of the size distribution over time showed that the PVM/MA NPs and p-OVAs maintained good stability in PBS under ambient conditions, and the particle size of the PVM/MA NPs did not change significantly within one week (Fig. S1†). The ζ-potential of OVA and p-OVA was measured as −48.7 ± 1.5 mV and −36.4 ± 4.1 mV at pH 7 (the inset in Fig. 1C). It is these negative charge properties that allow the nanoparticles to maintain high stability and uniformity under physiological conditions. Meanwhile, this also meant that OVA had been doped into the p-OVA nanoparticles successfully, which will help with eliciting the OVA-specific immune response in vivo.
The TEM and SEM images of p-OVA revealed that the p-OVAs were of a regular spherical shape, well dispersed, and without agglomeration. The size distributions in the TEM and SEM images were calculated as 137.9 ± 10.7 and 143.8 ± 26.0 nm, respectively (Fig. 1D and E). Compared with the hydrodynamic diameter, the discrepancy of the p-OVA size distribution might be due to the drying and Au foil spatter processes of the sample preparation for TEM and SEM.
The in vitro release property of OVA from the p-OVA nanoparticles is shown in Fig. 1F. At the beginning of the test, an initial burst release can be observed at the 0-time point (about 48.6% released). The inset shows that the half-time release (T1/2) of p-OVA was about 15 min. After that, the release profile followed the sustained release model and prolonged OVA release beyond 72 h (about 59.2% released). Therefore, we can envision that, after the first vaccination, the adsorbed OVA on the surface of p-OVA can provide adequate and quick initial antigen exposure at the injection site, and the encapsulated OVA in p-OVA can provide long-term antigen stimulation, which is a critical factor for the long-lasting immune response in vivo.
3.2 FTIR spectral analysis of the OVA, PVM/MA, and p-OVA nanoparticles
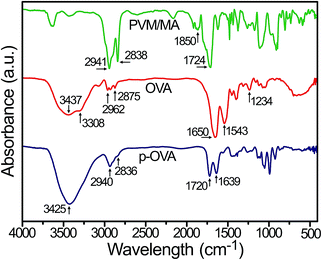
In this study, FTIR was used to confirm the successful cross-linking of OVA to PVM/MA by the characteristic peaks in the spectra. As shown in Fig. 2, due to the PVM/MA anhydride groups readily reacting with water to produce carboxyl groups,27 the carbonyl absorption bands of PVM/MA appeared at 1724 cm−1. The peak at 1850 cm−1 was recognized as typical for anhydride groups of PVM/MA.28 Moreover, the two peaks at 2838 cm−1 and 2941 cm−1 corresponded to –CH2 symmetric and asymmetric stretching vibration, respectively.29 The spectrum of OVA showed the typical absorption peaks of proteins, such as the free N–H stretching vibration band at 3437 cm−1, the amide A band at 3308 cm−1, and the amide B band at 2875–2962 cm−1, and the bands at 1650 cm−1, 1543 cm−1, and 1234 cm−1 corresponded to amide I, II, and III, respectively.30In the p-OVA spectrum, the free N–H stretching band shifted to 3425 cm−1, which meant that stable hydrogen bonds and a helix structure were formed, and the peak shifted to a lower frequency.31 The peak for carbonyl absorption appeared at 1720 cm−1, whereas the –CH2 stretching peaks shifted to 2940 and 2836 cm−1 respectively. In addition, in the p-OVA spectrum, the amide group from OVA also changed greatly. The band of amide I shifted to 1639 cm−1, while the bands for amide II and III were almost indistinguishable in the p-OVA spectrum. The changes in the amide bands were correlated with the physical interactions between the amino group of OVA and the carboxyl group of PVM/MA, such as van der Waals forces of attraction or dipole moments or weak hydrogen bonds,32 which changed the secondary structure of OVA. Partial protein unfolding or higher molecular weight aggregate (p-OVA) formation33 caused changes in the strength of the bond between the C![[double bond, length as m-dash]](https://www.rsc.org/images/entities/char_e001.gif) O and N–H moieties, and consequently affected the protein solubility.34 Thus, the FTIR spectroscopy results clearly confirm that the model antigen of OVA has been doped in the PVM/MA nanoparticles successfully.
O and N–H moieties, and consequently affected the protein solubility.34 Thus, the FTIR spectroscopy results clearly confirm that the model antigen of OVA has been doped in the PVM/MA nanoparticles successfully.
3.3 Lymphocyte proliferation and viability after OVA stimulation
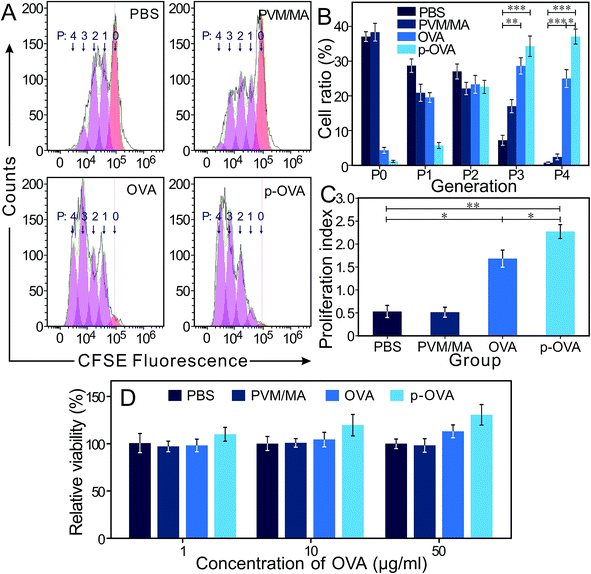
Ideally, a good adjuvant should trigger a rapid immune response to a second exposure of the same antigen. 6 weeks after immunization, the splenocytes were stained with CFDA-SE kits and exposed to OVA (10 μg mL−1) for an extra 72 h; the FACS results showed that most of the cells in the OVA and p-OVA groups were in the active state of division (2nd–4th posterity, P2 and P4), and the cells in the PBS and PVM/MA groups were still in the P0 and P1 generation (Fig. 3A). The differences between the p-OVA and OVA and PBS and PVM/MA groups were extremely significant (p < 0.01) (Fig. 3B). CFDA-SE results showed that the proliferation index of the p-OVA group was much higher than that of the OVA, PBS, and PVM/MA groups (Fig. 3C). This also meant that after the mice were immunized with OVA or p-OVA, once the splenocytes were re-exposed to the same antigen again, the proliferative capacity of the lymphocytes can be initiated to a higher degree than that in the antigen-free immunized groups (PBS and PVM/MA). The hypothesis is as follows: after free antigen (OVA) intramuscular injection, the antigen is quickly absorbed and degraded to contact and stimulate the immune system just for a short time, while the cross-linked nano-adjuvant of p-OVA can anti-erode for rather longer periods, maintaining sustained antigen release to stimulate the immune system constantly and produce long-lasting OVA-specific immunity in vivo.As shown in Fig. 3D, compared with the PBS, PVM/MA, and OVA groups, the splenocytes of the mice immunized with p-OVA manifested the highest cell viability and showed a dose-independent tendency with a second exposure to different concentrations of OVA. For the OVA-immunized group, the lymphocyte viability was a little bit stronger than that of the PBS and PVM/MA groups and also showed a dose-dependent trend on re-exposure to a higher concentration of OVA. These results showed that the mice immunized with p-OVA could induce antigen-specific immune responses with a single vaccination, almost irrespective of the concentration of the second exposure to the antigen. However, for the mice immunized with pure OVA, only exposure to higher concentrations of antigen could trigger a corresponding immune response. These results suggested that immunization with p-OVA could produce better immune memory in mice.
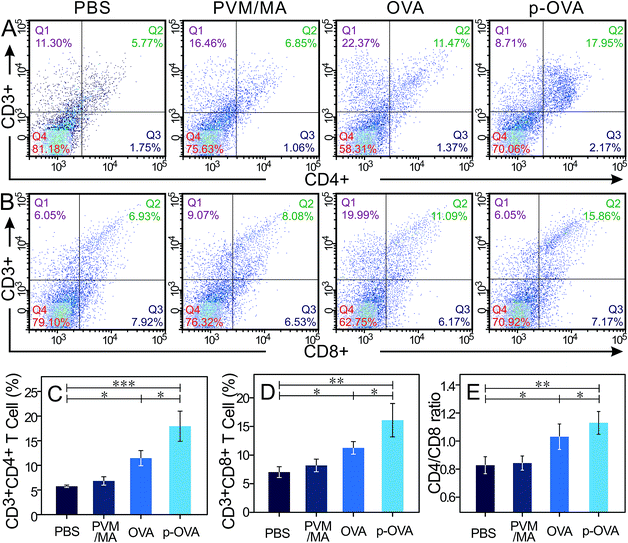
3.4 Analysis of OVA-specific CD4+ and CD8+ T cell activation
The cell-mediated immune response can identify and eliminate abnormal cells, including malignant mutations and pathogen-infected cells. Activation of antigen-specific CD4+ T cells and CD8+ T cells (most are CTLs) is the primary strategy to activate cellular immunity in vivo. CD4 molecules are mainly distributed on the surfaces of T helper/suppressor cells, combined with non-polymorphic antigens of MHC II on the antigen-presenting cell (APC) surface. CD4 molecules can assist T helper (Th) cells to identify the complex of foreign antigen and MHC II molecules on the APC cell surface. After stimulation by the antigen, activated CD4+ T cells can secrete various cytokines to regulate the function of other types of T cell, including CTL and B cells.35 CD8 molecules, distributed on the cell surfaces of the suppressor T lymphocytes (Ts) and CTLs, are also known as killer T cells. Cooperating with non-polymorphic MHC I molecules and foreign antigens, the antigen-specific CD8+ cells can exert a cytotoxic effect and eliminate infected or malignant cells.36In order to investigate whether the immunization can induce persistent immune memory and enhance the CTL prophylactic immune response for the OVA and p-OVA groups, the splenocytes were extracted from the spleens of mice 6 weeks post-immunization and treated with OVA for 72 h again, and the number of OVA-reactive CD4+ and CD8+ cells was measured with flow cytometry.
As shown in Fig. 4A and B, vaccination with free PVM/MA did not result in statistically significant CD4+ and CD8+ T cell production compared to that with PBS. However, immunization with free OVA and p-OVA engendered the increase of the proliferation rate and cell number of CD4+ and CD8+ T cells. Particularly for the p-OVA group, the rise in CD4+ and CD8+ cells was extremely statistically significant (p < 0.01, Fig. 4C and D). The CD4/CD8 ratios in PBS, PVM/MA, OVA, and p-OVA also showed an upward trend, and the p-OVA group had the highest ratio of 1.132 (p < 0.01, Fig. 4E). The number of CD4+ and CD8+ cells and the CD4/CD8 ratio for the OVA and p-OVA groups were also statistically different (Fig. 4C–E, p < 0.05). The FACS results demonstrated that the antigen-specific immune response was enhanced after immunization three times, and the immune system can be fully activated by p-OVA to trigger the proliferation of CD4+ and CD8+ T lymphocyte cells.
3.5 The cytokine-related mRNA level of splenocytes
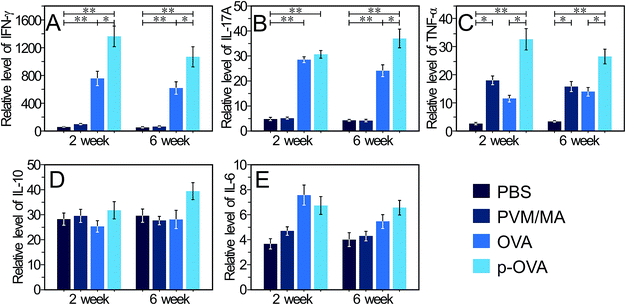
IFN-γ is mainly produced by Th-1 cells, natural killer T cells (NKT), and natural killer (NK) cells, and is strongly associated with type 1 responses driven by Th1 polarized cells. Furthermore, IFN-γ plays important roles in the development, survival, differentiation, and/or proliferation of B cells that are the main participants in humoral immunity.37 Our results showed that 2 weeks after immunization with OVA and p-OVA, IFN-γ-related mRNA expression in splenocytes increased significantly, and the mRNA level of the p-OVA-immunized group was higher than that of the OVA-immunized group (p < 0.05). 6 weeks after immunization, the level of IFN-γ-related mRNA expression was slightly decreased in the OVA and p-OVA groups but was still significantly different (p < 0.01) compared with that in the PBS group (Fig. 5A). The stimulation of IFN-γ can result in a greater ability to induce OVA-specific CD4+ T cell proliferation,38 which in turn enhances IFN-γ production by CD4+ T cells, and as such, the self-amplifying positive feedback loop forms,39 as well as the response of dendritic cells (DCs) to OVA-stimulating molecules improving.40 Our results suggest that immunization with p-OVA can induce a higher level of IFN-γ mRNA expression, resulting in a more potent adaptive immune response in vivo.IL-17A was originally described as a product of memory CD4+ T cells, but now it is known that IL-17A can be secreted by diverse cell types, including the newly discovered CD4+ helper T cell subset (Th)-17 cells, activated CD4+ memory T cells, and γδ T cells.41 In addition, IL-17A mainly contributes to the clearance of allogeneic pathogens via various biological processes, including lymphoid cell and macrophage initialization, neutrophil recruitment, and induction of the expression of cytokines, chemokines, and antimicrobial peptides.42 In this study, 2 weeks after immunization with OVA and p-OVA, a significant increase in IL-17A mRNA expression was observed in the splenocytes (Fig. 5B). The mRNA level of IL-17A was still maintained at a relatively higher level 6 weeks after p-OVA immunization, compared with that of the other groups, and the difference was significant (p < 0.05, Fig. 5B). Theoretically, large numbers of αβ T lymphocytes would accumulate at the primary site of antigen exposure, with the early increased local production of IL-17A,43 which can effectively enhance the adaptive immune response to vaccination. Our results closely coincide with the theory and suggest that p-OVA vaccination can achieve better adaptive immune response in vivo.
Tumour necrosis factor (TNF)-α belongs to the TNF/TNFR cytokine superfamily,44 and is also the pro-inflammatory cytokine, which is mainly produced by activated macrophages, NK cells, and T lymphocytes.45 In common with other family members, TNF-α is involved in the maintenance and homeostasis of the immune system, inflammation, and host defence.44 In adaptive immunity, TNF-α and its type I receptor (expressed in activated T cells) coordinate in cells to enable a maximal response to vaccination.44 This increases the phagocytosis of neutrophils, thereby enhancing the function of antibody-dependent cell-mediated cytotoxicity (ADCC), promoting the expression of the MHC class I antigen on T cells, and promoting the proliferation of lymphocytes as well as the cytokine secretion, such as IL-2, CSF, and IFN-γ. In this study, the mice immunized with pure OVA induced an elevated mRNA expression of TNF-α in splenocytes. In contrast, the p-OVA-immunized mice showed significantly higher levels of TNF-α mRNA in splenocytes, compared with the PBS-treated mice, and the difference was extremely significant (p < 0.01, Fig. 5C), which suggests that p-OVA immunization can lead to a more effective immune response in vivo. Interestingly, immunization with PVM/MA nanoparticles also resulted in a significant increase in mRNA expression of TNF-α, compared with that of the PBS group (p < 0.05, Fig. 5C). This result is completely consistent with previous reports, where PVM/MA NPs can provoke DC cells via Toll-like receptor (TLR)-2, -4, and -5 pathways, activate Th1-specific cytokine release (IFN-γ, IL-12),23 and elevate the expression of CD54 and CD86 co-stimulatory molecules multiple times, and as OVA is a small molecule protein, it induces less Th1-specific cytokine release than the PVM/MA NPs.24 Therefore, after immunization, the PVMA NP group produced a stronger immune response than the control group.
In 2010, a human B cell subset with a strong ability to produce IL-10 and the capacity to suppress the Th1 immune response was described,37 and today, IL-10 is classified as a Th2 cell-specific cytokine with a wide variety of anti-inflammatory properties.38 IL-10 exerts its biological effects mainly by inhibiting the secretion of type I cytokines (IL-1, TNF-α, and IL-12) and down-regulating the expression of MHC II molecules in immune cells.46 In this study, mice immunized with four different immunoconjugates did not induce a different mRNA expression of IL-10 in vivo (Fig. 5D), suggesting that the PVM/MA-based nano-vaccine would not induce detectable immunosuppression in vivo.
Interleukin (IL)-6 as a lymphokine is produced by a variety of cells, including lymphocytes, fibroblasts, and peripheral blood mononuclear cells (PBMCs).37 IL-6 has broad effects on the configuration of adaptive immunity47 and often displays hormone-like characteristics that affect homeostatic processes. IL-6 is considered a key driver of IL-17-secreting CD4+ or CD8+ T cells, and is also a major regulator of the balance between regulatory T (Treg) cells and Th17 cells.48 IL-6 over-production promotes inflammation through the generation of pathogenic antibodies and increases proliferation of pathogenic T cells.49 Our results showed that the expression of IL-6-related mRNA in splenocytes increased slightly 2 weeks after immunization with OVA and p-OVA, indicating that the immunization had effectively activated the survival and proliferation of antibody-producing B cells (Fig. 5E). 6 weeks after immunization, the mRNA level was still relatively higher than the levels of the other groups (Fig. 5E), but the difference was not significant. These results indicated that immunization with p-OVA is relatively safe and does not lead to pathological over-expression of IL-6.
3.6 Anti-OVA antibody level in mouse serum
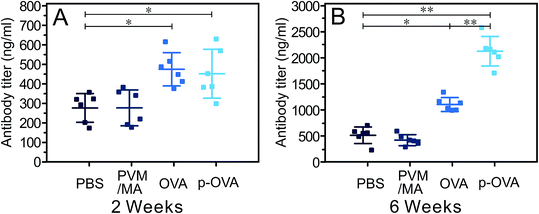
2 and 6 weeks following the last immunization, the titers of anti-OVA antibody (IgG) in serums were measured by ELISA. As shown in Fig. 6A, both OVA and p-OVA vaccination induced specific anti-OVA antibodies 2 weeks after immunization, and the antibody titers in the OVA and p-OVA groups were significantly higher than that of the PBS group (nearly 2-fold, p < 0.05), but the difference between the OVA and p-OVA groups was not statistically significant. 6 weeks after immunization, after more time had passed, the antibody titers of the OVA group increased to a higher level, but the antibody titer of the p-OVA group was significantly higher than that of all the other groups, and the difference was significant (Fig. 6B, p < 0.01). These results suggest that the pure OVA immunization can induce antigen-specific immunity in vivo, due to the rapid absorption and enzymolysis of OVA, and the time of antigen stimulation is short and the immune response is relatively weak. However, for the p-OVA group, the OVA antigen was encapsulated in the PVM/MA-based nanoparticles, and released slowly with the slow metabolism of PVM/MA, resulting in a long-lasting tendency to induce the antigen-specific immunization. This also suggests that the synthesized p-OVA can promote a more potent and sustained humoral immune response in vivo.3.7 Histological analysis
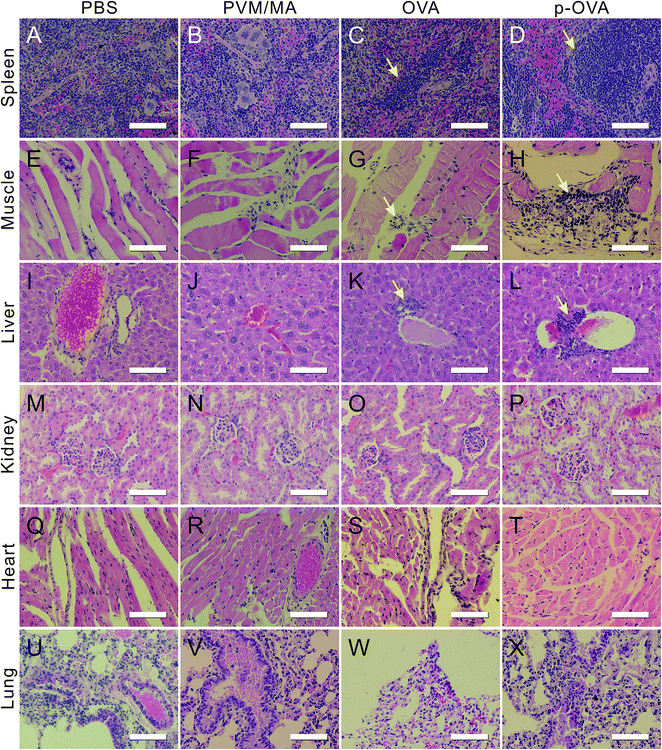
Biopsy is the important key factor for the prediction and tactics for predicting adjuvant efficacy and biocompatibility. In this study, we collected the main organs of the mice 6 weeks following the final immunization for the sectioning and HE staining. The biopsy results showed that, compared with the PBS group, the mice immunized with PVM/MA had no obvious histological changes in the main organs (Fig. 7, columns 1 and 2).In the OVA immunization group, mild inflammation can be found in the spleen, such as cord-like arranged lymphocyte infiltrates in the red pulp (arrow in Fig. 7C), but the structures of the splenic nodules and red pulp were still integrated. At the injection site, some lymphocytes exuded in the spatium of the muscle fibers and manifested a slight inflammation (arrow in Fig. 7G). In the liver section, the structures of the liver lobules, hepatic sinusoid, and bile canaliculi were still fairly integrated, but small amounts of lymphocyte infiltration can be seen near the central veins of the lobules (arrow in Fig. 7K).
However, for the p-OVA-immunized group, slight structural disorder can be observed in the splenic nodules of the white pulp of the spleen, accompanied with a little mucous exudation and a large amount of lymphocyte infiltration (arrow in Fig. 7D). Near the site of injection, a large number of inflammatory cells and phagocytes sprung up within the gaps of the muscle fiber, as well as the fiber spatium enlarging (arrow in Fig. 7H). At the same time, many inflammatory cells and macrophages were focally distributed around the central vein of the hepatic lobules (arrow in Fig. 7L), and without obvious hepatic or piecemeal necroses, degenerative and fibrotic changes can be found.
By comparison, in the sections of the kidney, heart, and lung of the mice immunized with PBS, PVM/MA, OVA, and p-OVA, no significant inflammatory hyperplasia and exudation were observed, and no histological difference can be found between these groups (Fig. 7M–X). These results suggest that p-OVA immunization can provide a much longer immune response than pure OVA in vivo, and the mild inflammatory responses of these organs are good evidence for the vaccine effects.
3.8 Complete blood count
To assess the impact of the adjuvant on the hematopoietic system, 6 weeks after vaccination with PBS, PVM/MA, OVA, and p-OVA, the following important parameters were tested for the whole blood samples: the number of white blood cells (WBCs), lymphocytes (LYMPHs), red blood cells (RBCs), and platelets (PLTs), and the amount of haemoglobin (HGB). It was found that all of the parameters in the p-OVA and OVA-vaccinated groups appeared to be normal compared with those in the PBS group, except for a slight increase in the number of WBCs (Fig. 8A) and LYMPHs (Fig. 8B) 6 weeks after vaccination. However, the differences between these groups and the PBS and PVM/MA groups were not statistically significant (p > 0.05). Since the immune response is mainly exerted by lymphocytes in vivo, it is assumed that the increase in the number of WBCs and LYMPHs is evidence of the activated immune response elicited by p-OVA and OVA in vivo.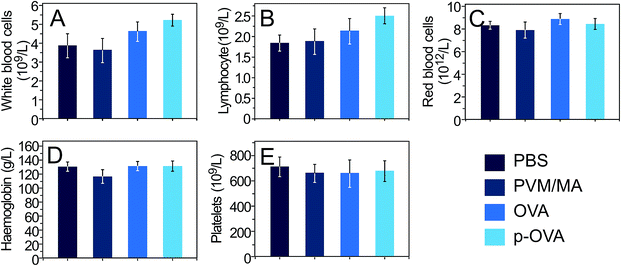 | ||
| Fig. 8 Complete blood cell count of mice 6 weeks after vaccination with PBS, PVM/MA, OVA, and p-OVA. (A) White blood cells, (B) lymphocytes, (C) red blood cells, (D) haemoglobin, and (E) platelets. | ||
4. Conclusions
In summary, we have developed PVM/MA-based nanoparticles doped with a model protein, OVA (p-OVA), as a new vaccine adjuvant to enhance the humoral and cellular immune response in vitro and in vivo. On one hand, the biodegradable p-OVA system could be utilized as an effective nanocarrier that provides both adequate initial antigen exposure and extremely sustained antigen release. On the other hand, the p-OVA delivery system could serve as an effective vaccine to induce the antigen-specific immune response, enhance T cell proliferation, and trigger strong cytokine-related mRNA expression, as well as mediate the CTL responses in immunized mice, showing a remarkably improved antigen-specific immune response compared to that with free OVA. Interestingly, we found that immunization with the pure PVM/MA nanoparticles could promote the expression of TNF-α-related mRNA in splenocytes, but the mechanism remains to be further studied. In conclusion, PVM/MA-based nanoparticles are attractive vehicles for antigen delivery and modulation of immune responses. These findings provide new insight for future vaccine and/or adjuvant design and may have significant implications for immunotherapy of cancer and autoimmune diseases.Conflicts of interest
The authors declare no competing financial interests.Acknowledgements
This work was supported by the funds of the National Natural Scientific Foundation of China (grant numbers 81771636 and 81701426), the Major Project of the Wenzhou Science & Technology Bureau (grant numbers ZS2017012 and Y20160069), Zhejiang Administration of Traditional Chinese Medicine (grant number 2017ZB067), and the Foundation of the Health & Family Planning Commission of Zhejiang Province (11-CX29).References
- S. Cobey, Ann. New York Acad. Sci., 2014, 1320, 1–15 CrossRef CAS PubMed.
- S. G. Reed, M. T. Orr and C. B. Fox, Nat. Med., 2013, 19, 1597–1608 CrossRef CAS PubMed.
- T. R. Ghimire, SpringerPlus, 2015, 4, 181 CrossRef PubMed.
- H. HogenEsch, Front. Immunol., 2012, 3, 406 Search PubMed.
- L. Tomljenovic and C. A. Shaw, Curr. Med. Chem., 2011, 18, 2630–2637 CrossRef CAS PubMed.
- Y. Cao, Y. Ma, M. Zhang, H. Wang, X. Tu, H. Shen, J. Dai, H. Guo and Z. Zhang, Adv. Funct. Mater., 2014, 24, 6963–6971 CrossRef CAS.
- C. Meng, X. Zhi, C. Li, C. Li, Z. Chen, X. Qiu, C. Ding, L. Ma, H. Lu, D. Chen, G. Liu and D. Cui, ACS Nano, 2016, 10, 2203–2213 CrossRef CAS PubMed.
- T. Akagi, M. Baba and M. Akashi, in Polymers in Nanomedicine, ed. S. Kunugi and T. Yamaoka, Springer Berlin Heidelberg, Berlin, Heidelberg, 2012, vol. 247, pp. 31–64 Search PubMed.
- C. Li, S. Liang, C. Zhang, Y. Liu, M. Yang, J. Zhang, X. Zhi, F. Pan and D. Cui, Biomaterials, 2015, 54, 177–187 CrossRef CAS PubMed.
- D. M. Smith, J. K. Simon and J. R. Baker Jr, Nat. Rev. Immunol., 2013, 13, 592–605 CrossRef CAS PubMed.
- P. Sahdev, L. J. Ochyl and J. J. Moon, Pharm. Res., 2014, 31, 2563–2582 CrossRef CAS PubMed.
- L. Liu, P. Ma, H. Wang, C. Zhang, H. Sun, C. Wang, C. Song, X. Leng, D. Kong and G. Ma, J. Controlled Release, 2016, 225, 230–239 CrossRef CAS PubMed.
- K. T. Mody, A. Popat, D. Mahony, A. S. Cavallaro, C. Yu and N. Mitter, Nanoscale, 2013, 5, 5167–5179 RSC.
- J. P. M. Almeida, E. R. Figueroa and R. A. Drezek, Nanomedicine, 2014, 10, 503–514 CrossRef CAS PubMed.
- A. Salvador, K. J. Sandgren, F. Liang, E. A. Thompson, R. A. Koup, J. L. Pedraz, R. M. Hernandez, K. Loré and M. Igartua, Int. J. Pharm., 2015, 496, 371–381 CrossRef CAS PubMed.
- R. A. Rosalia, L. J. Cruz, S. van Duikeren, A. T. Tromp, A. L. Silva, W. Jiskoot, T. de Gruijl, C. Löwik, J. Oostendorp, S. H. van der Burg and F. Ossendorp, Biomaterials, 2015, 40, 88–97 CrossRef CAS PubMed.
- T. Terukina, Y. Naito, T. Tagami, Y. Morikawa, Y. Henmi, W. Prananingrum, T. Ichikawa and T. Ozeki, J. Drug Delivery Sci. Technol., 2016, 33, 136–142 CrossRef CAS.
- M. Stanković, H. W. Frijlink and W. L. J. Hinrichs, Drug Discovery Today, 2015, 20, 812–823 CrossRef PubMed.
- V. Zabaleta, G. Ponchel, H. Salman, M. Agüeros, C. Vauthier and J. M. Irache, Eur. J. Pharm. Biopharm., 2012, 81, 514–523 CrossRef CAS PubMed.
- J. D. S. Rebouças, J. M. Irache, A. I. Camacho, I. Esparza, V. del Pozo, M. L. Sanz, M. Ferrer and C. Gamazo, Eur. J. Pharm. Biopharm., 2012, 82, 241–249 CrossRef PubMed.
- P. Arbós, M. A. Campanero, M. A. Arangoa, M. J. Renedo and J. M. Irache, J. Controlled Release, 2003, 89, 19–30 CrossRef.
- J. M. Llabot, H. Salman, G. Millotti, A. Bernkop-Schnürch, D. Allemandi and J. Manuel Irache, J. Microencapsulation, 2011, 28, 455–463 CrossRef CAS PubMed.
- A. I. Camacho, R. Da Costa Martins, I. Tamayo, J. de Souza, J. J. Lasarte, C. Mansilla, I. Esparza, J. M. Irache and C. Gamazo, Vaccine, 2011, 29, 7130–7135 CrossRef CAS PubMed.
- I. Tamayo, J. M. Irache, C. Mansilla, J. Ochoa-Repáraz, J. J. Lasarte and C. Gamazo, Clin. Vaccine Immunol., 2010, 17, 1356–1362 CrossRef CAS PubMed.
- P. Arbós, M. Wirth, M. A. Arangoa, F. Gabor and J. M. Irache, J. Controlled Release, 2002, 83, 321–330 CrossRef.
- X. Liu, L. Li, Y.-Q. Liu, X.-B. Shi, W.-J. Li, Y. Yang and L.-G. Mao, Biosens. Bioelectron., 2014, 59, 328–334 CrossRef CAS PubMed.
- M. J. Irache, M. Huici, M. Konecny, S. Espuelas, A. M. Campanero and P. Arbos, Molecules, 2005, 10, 126–145 CrossRef PubMed.
- K. Yoncheva, E. Lizarraga and J. M. Irache, Eur. J. Pharm. Sci., 2005, 24, 411–419 CrossRef CAS PubMed.
- D. Maity, M. Kanti Bain, B. Bhowmick, J. Sarkar, S. Saha, K. Acharya, M. Chakraborty and D. Chattopadhyay, J. Appl. Polym. Sci., 2011, 122, 2189–2196 CrossRef CAS.
- W. Feng, T. Zhao, Y. Zhou, F. Li, Y. Zou, S. Bai, W. Wang, L. Yang and X. Wu, Pharmacogn. Mag., 2013, 9, S32–S37 CrossRef PubMed.
- B. Luo, Q. L. Loh, M. T. Chong Wong, N. S. Tan and C. Choong, J. Mater. Chem. B, 2014, 2, 7795–7803 RSC.
- A. Rudra, K. Santra and B. Mukherjee, Trends Appl. Sci. Res., 2011, 6, 47–56 CrossRef CAS.
- E. Bramanti, F. Lenci and A. Sgarbossa, Eur. Biophys. J., 2010, 39, 1493–1501 CrossRef CAS PubMed.
- C. Duce, L. Ghezzi, M. Onor, I. Bonaduce, M. P. Colombini, M. R. Tine’ and E. Bramanti, Anal. Bioanal. Chem., 2012, 402, 2183–2193 CrossRef CAS PubMed.
- A. Ciabattini, E. Pettini and D. Medaglini, Front. Immunol., 2013, 4, 421 Search PubMed.
- S. Foster, C. L. Duvall, E. F. Crownover, A. S. Hoffman and P. S. Stayton, Bioconjugate Chem., 2010, 21, 2205–2212 CrossRef CAS PubMed.
- P. A. Blair, L. Y. Noreña, F. Flores-Borja, D. J. Rawlings, D. A. Isenberg, M. R. Ehrenstein and C. Mauri, Immunity, 2010, 32, 129–140 CrossRef CAS PubMed.
- A. O’Garra, P. S. Redford, F. W. McNab, C. I. Bloom, R. J. Wilkinson and M. P. R. Berry, Annu. Rev. Immunol., 2013, 31, 1545–3278 Search PubMed.
- W. P. Chong, N. van Panhuys, J. Chen, P. B. Silver, Y. Jittayasothorn, M. J. Mattapallil, R. N. Germain and R. R. Caspi, Int. J. Clin. Exp. Med., 2015, 212, 1739–1752 CAS.
- K. O. Dixon, J. O’Flynn, N. Klar-Mohamad, M. R. Daha and C. van Kooten, Eur. J. Immunol., 2017, 47, 470–480 CrossRef CAS PubMed.
- J. Harris, F. A. Sharp and E. C. Lavelle, Eur. J. Immunol., 2010, 40, 634–638 CrossRef CAS PubMed.
- B. Wonnenberg, C. Jungnickel, A. Honecker, L. Wolf, M. Voss, M. Bischoff, T. Tschernig, C. Herr, R. Bals and C. Beisswenger, Innate Immun., 2016, 22, 620–625 CrossRef CAS PubMed.
- A. Porcherie, F. B. Gilbert, P. Germon, P. Cunha, A. Trotereau, C. Rossignol, N. Winter, P. Berthon and P. Rainard, J. Immunol., 2016, 196, 803–812 CrossRef CAS PubMed.
- F. Balkwill, Cancer Metastasis Rev., 2006, 25, 409 CrossRef CAS PubMed.
- T. Bouwmeester, A. Bauch, H. Ruffner, P.-O. Angrand, G. Bergamini, K. Croughton, C. Cruciat, D. Eberhard, J. Gagneur, S. Ghidelli, C. Hopf, B. Huhse, R. Mangano, A.-M. Michon, M. Schirle, J. Schlegl, M. Schwab, M. A. Stein, A. Bauer, G. Casari, G. Drewes, A.-C. Gavin, D. B. Jackson, G. Joberty, G. Neubauer, J. Rick, B. Kuster and G. Superti-Furga, Nat. Cell Biol., 2004, 6, 97–105 CrossRef CAS PubMed.
- S. K. Mittal and P. A. Roche, Curr. Opin. Immunol., 2015, 34, 22–27 CrossRef CAS PubMed.
- C. A. Hunter and S. A. Jones, Nat. Immunol., 2015, 16, 448–457 CrossRef CAS PubMed.
- K. Taniguchi and M. Karin, Semin. Immunol., 2014, 26, 54–74 CrossRef CAS PubMed.
- T. Tanaka, M. Narazaki and T. Kishimoto, Cold Spring Harb Perspect. Med., 2014, 6, a016295 CrossRef PubMed.
Footnotes |
| † Electronic supplementary information (ESI) available. See DOI: 10.1039/c7ra11891k |
| ‡ These authors contributed equally to this work. |
| This journal is © The Royal Society of Chemistry 2017 |

