DOI:
10.1039/C7RA11849J
(Paper)
RSC Adv., 2017,
7, 56417-56425
Synergistic effect of rare earth metal Sm oxides and Co1−xS on sheet structure MoS2 for photocatalytic hydrogen evolution
Received
27th October 2017
, Accepted 7th December 2017
First published on 15th December 2017
Abstract
The novel composite Sm2O3@Co1−xS/MoS2 was synthesized by an efficient and easy operation solvothermal process. As a new photocatalyst, it has high photocatalytic activity. The hydrogen evolution amount of the Sm2O3@Co1−xS/MoS2 catalyst is as high as 448 μmol under visible light irradiation for 5 h, which is about 4 times higher than MoS2 and still exhibited high photocatalytic stability. The AQEs reached 32.1% at 475 nm. The synergistic effect of rare earth metal Sm oxides and Co1−xS over MoS2 sheet for photocatalytic activity and stability were analysed by SEM, TEM, XRD, XPS, UV-vis, and fluorescence spectra etc. The results showed that the deposited Sm2O3@Co1−xS are uniformly dispersed on the MoS2 sheet, the electron transfer and the charge separation were obviously improved with the aid of Sm2O3 and Co1−xS on the surface of MoS2. The BET results showed that Sm2O3@Co1−xS/MoS2 had a greater specific surface area and pore volume, which was beneficial to the adsorption of dye molecules and enhanced the photocatalytic activity. Therefore, rare earth metal Sm oxides might be a potential cocatalyst for the design of a new photocatalyst.
1. Introduction
With the development of human society, science, technology and humanities have made great progress, but the problems of resources and environment are also increasingly prominent. The current social and environmental situation is largely affected by the use of energy based on the use of hydrocarbons.1,2 Hydrogen (H2) is considered a clean fuel today, and is one of the strategic alternatives to fossil fuels in the future.3,4 Hydrogen can be produced in various ways,5 but it is important to find a cleaner route that generates hydrogen under mild conditions. One of the best choices for generating H2 is photocatalytic hydrolysis.6 However, the development of a new visible light response photocatalyst, with excellent charge separation ability and high stability to meet the needs of practical applications, remains a huge challenge.7–12
High-cost precious metals remain the most effective major catalyst today.13 Therefore, it is an urgent task to find the low-cost non-noble metal catalysts to promote photocatalytic hydrogen evolution. The transition metal (Ni, Co) as a photocatalyst has been found to effectively reduce the cost and increased the hydrogen evolution efficiency.14–17 As a catalyst for the hydrogen evolution from decomposition of water, CoB18 has higher photocatalytic activity, low cost and easy preparation, and becomes a suitable catalyst for hydrogen evolution. Co3O4, a p-type semiconductor, has been considered to be an ideal photocatalytic composite material with a band gap (1.2–2.1 eV).19,20 So far, many Co3O4-based photocatalyst such as Co3O4/CdS21,22 and Co3O4/TiO2(ref. 23 and 24) have been studied as an effective way to improve the photocatalytic activity. The hydrogen evolution rate of g-C3N4 loading with CoS increased obviously under visible light irradiation.25 According to the latest reports of Yang et al., amorphous CoS has been used as an efficient catalyst for electrochemical and photoelectrochemical hydrogen evolution.26 Therefore, Co can be regarded as a excellent cocatalyst for photocatalytic hydrogen production.
MoS2 is a photocatalyst with high chemical stability and low cost, which has been proved to be an efficient catalyst for reducing the recombination rate of light carriers and improving the photocatalytic activity of hydrogen evolution.27–29 MoS2 belongs to a quasi two-dimensional material, its atomic layer is sandwiched between two layers of sulfide atoms with covalent bonds.30 The weak van der Waals gap between these atomic layers is the main reason for the catalytic and optical properties of MoS2.31–34 The enhanced photocatalytic activity of nano sized MoS2 is due to its small direct band gap (1.7 eV), wide absorption range of 400–700 nm and sufficient BET specific surface area. MoS2 composites, such as MoS2/graphene,35 MoS2/CdS36 and MoS2/WS2,37 for different uses such as lithium ion batteries, evolution of H2 and photoelectric properties. With the assistance of Co, the molybdenum-based sulfides prepared by hydrothermal method exhibit high activity.38,39 Rare earth element metal Sm was also found to be an effective material for improving the photocatalytic hydrogen evolution. For example, Sm2MTaO7 (M = Y, In, Fe)40 and Sm-doped Bi2MoO6 (ref. 41) showing good catalytic activity.
In this work, the aim is to synthesis the Sm2O3@Co1−xS/MoS2 solid solution with high photocatalytic activity as well as a uniform size and shape by one-step hydrothermal coprecipitation. Under the 300 W xenon lamp, the hydrogen evolution amount of Sm2O3@Co1−xS/MoS2 photocatalyst in 10% TEOA solution was 448 μmol. The new non-noble metal photocatalyst Sm2O3@Co1−xS/MoS2 exhibited a better stability and efficiency for the H2 evolution reaction.
2. Experimental
2.1 Synthesis of the Sm2O3@Co1−xS/MoS2 nanomaterial
The Sm2O3@Co1−xS/MoS2 sample was prepared by a one-step hydrothermal method. Different solid solutions were obtained by changing the molar ratios of Sm to Co precursors and the molar amount of Mo. 0.1 mmol CTAB (hexadecyl trimethyl ammonium bromide) was dissolved completely in 100 mL of distilled water at 50 °C, and was cooled to room temperature. Then 1.5 mmol samarium trinitrate (Sm(NO3)3·6H2O), 8.5 mmol Cobalt nitrate (Co(NO3)3·6H2O), 6 mL ammonium hydroxide (NH3·H20) were added in that order into 30 mL CTAB solution prepared above with constant stirring, and then the mixtures were stirred for 30 min. On the other hand, 0.105 g ammonium molybdate tetrahydrate {(NH4)6Mo7O24·4H2O} and 25 mg thiourea (CN2H4S) were completely dissolved in 25 mL CTAB solution. Finally, mix the two solutions. After stirring for 8 h, the mixture was transferred into a 100 mL Teflon vessel, which was placed in a electric thermostatic drying oven and heated at 150 °C for 24 h. The formed turbid liquid was filtered and washed with ultrapure water and ethanol several times to remove CTAB and other ions, and then the product was dried at 80 °C for 12 h. By changing the molar ratio of Sm to Co precursor, Co1−xS/MoS2, Sm2O3/MoS2 samples and Sm2O3@Co1−xS/MoS2 with different Sm contents were prepared. By varying the amount of the Mo precursor, Sm2O3@Co1−xS sample and Sm2O3@Co1−xS/MoS2 with different Mo contents were prepared.
2.2 Characterization
The microstructure and morphology of the samples were characterized by using Scanning Electron Microscope (SEM) at an accelerating of 5.0 kV. The structure of the samples were characterized by conventional X-ray diffraction (XRD), Cu K radiation (operated at 40 kV and 40 mA). The X-ray photoelectron spectroscopy (XPS) of the sample was measured by the ultrahigh vacuum VG ESCALAB 250 electron spectrometer. UV-vis absorption spectra determination of a UV2800S UV-vis spectrophotometer (Shanghaihengping). Transmission Electron Microscope (TEM) and High Resolution Transmission Electron Microscope (HRTEM) were taken with JEOL JEM-2100 200 kV. The photoluminescence spectra (PL) of all samples were measured by a Horiba FluoroMax-4 fluorescence spectrophotometer (HORIBA scientific, France). The specific surface areas (BET) of all samples were determined by a Micromeritics ASAP 2020 nitrogen adsorption apparatus.
2.3 Photocatalytic reaction and the apparent quantum efficiency
The photocatalytic hydrogen experiment was carried out in a 250 mL photochemical reactor, equipped with a magnetic stirrer and cooling water circulation system, which was carried out in a black box. A 300 W Xe lamp (CEL-HXF300) with a cut-off filter (λ ≥ 420 nm) was used as a light source and the effective irradiation area was determined to be 50.24 cm−2. For conventional photocatalytic reactions, 20 mg Sm2O3@Co1−xS/MoS2 photocatalyst was dispersed in a 100 mL aqueous solution containing 10 mL TEOA of electronic sacrificial agent under ultrasonic treatment for 10 min. Then, the mixed solution would be added to the reactor. 50 mg EY was added to the reactor as sensitizer, which stirred for 30 minutes on a magnetic stirrer. After the reactor was closed, the reactor remains vacuum by using a vacuum pump for 30 min. The N2 into the reactor, and a needle into the reactor bottle for exchange the gas, keep for 30 minutes. Making sure the gas in the reactor contained only nitrogen. The reaction solutions were maintained at room temperature with cooling water, which in the reaction process of light irradiation. The amount of hydrogen produced during the reaction was determined by gas chromatography (SP-2100, 13X column, TCD, N2 carrier).
In the same photocatalytic reaction conditions with monochromatic radiation light passing through a band pass filter (420, 475, 500, 520 and 550 nm), the apparent quantum efficiency (AQE) was measured. The photon flux of the incident light determined on a Ray virtual radiation actinometer (ApogeeMQ-500, silicon ray detector, light spectrum, 389–692 nm, sensitivity, 0–4000 μmol m−2 s−1) was 152 μmol m−2 s−1. According to the ratio of the number of reacted electrons during hydrogen evolution to the number of incident photons, the AQE was calculated.
2.4 Photoelectrochemical measurements
The photoelectrochemical measurement was performed on an electrochemical analyzer (Chenhua CHI 660D) in a standard three-electrode cell. The working electrodes were prepared by physical deposition method. A certain amount of catalyst power was dispersed ultrasonically in the ethanol to form a slurry state. The catalyst with a certain volume of slurry was added to the surface of ITO conductive glass, and then 500 μL of EY aqueous solution (1.0 × 10⁻⁴ mol L−1) was added onto the above catalyst film electrode surface. After during at 60 °C for 8 h, the ITO working electrode with catalyst was prepared. Pt electrode was used as the counter electrode, and a saturated calomel electrode (SCE) as the reference electrode. The supporting electrolyte was Na2SO4 (0.1 mol L−1) aqueous solution. The immersion area of the working electrode in the electrolyte was about 0.95 cm2. A 300 W Xe lamp equipped with an optical cutoff filter of 420 nm was employed for the visible-light excitation.
3. Results and discussion
3.1 SEM analysis
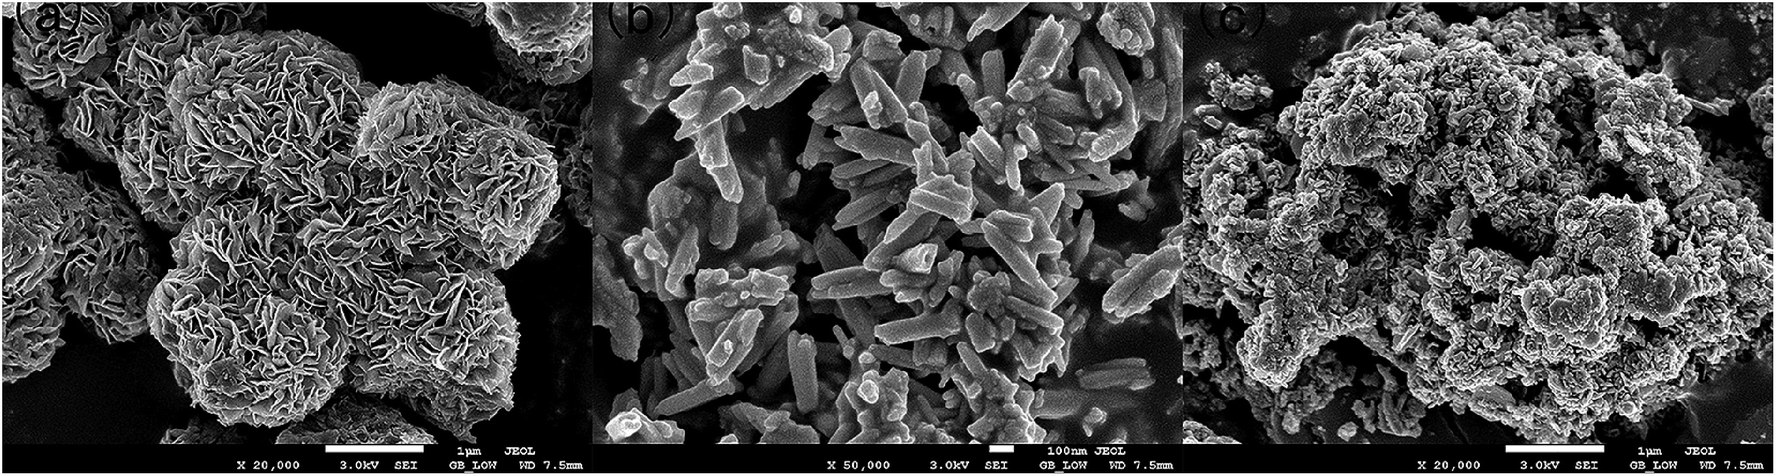
Using hydrothermal precipitation with ammonia water assistance, Sm2O3@Co1−xS solid solutions were prepared and used for the same hydrothermal syntheses of Sm2O3@Co1−xS/MoS2 photocatalyst. Samples were obtained with the starting reactant molar ratios of 1.5![[thin space (1/6-em)]](https://www.rsc.org/images/entities/char_2009.gif) :10 for Sm/(Sm + Co), 3:10 for Mo/(Sm + Co) were examined first. The morphologies of MoS2, Sm2O3@Co1−xS and Sm2O3@Co1−xS/MoS2 nanocomposites were examined by SEM. Fig. 1a shows the SEM of MoS2 prepared by the hydrothermal method, which can be seen that the MoS2 presents a sheet structure and aggregates together. Fig. 1b shows the SEM of Sm2O3@Co1−xS synthesized by hydrothermal method and the Sm2O3@Co1−xS presents a column structure with uniform shape and distribution. Fig. 1c shows the SEM of Sm2O3@Co1−xS/MoS2 composite, which can be seen that the columniform mixtures of Sm2O3@Co1−xS were successfully loaded on the sheet of MoS2. The above results showed that we successfully prepared MoS2 and Sm2O3@Co1−xS nano materials with regular shape and uniform distribution by hydrothermal method, and the Sm2O3@Co1−xS/MoS2 composite material was successfully synthesized on the basis of Sm2O3@Co1−xS and MoS2 nano materials.
:10 for Sm/(Sm + Co), 3:10 for Mo/(Sm + Co) were examined first. The morphologies of MoS2, Sm2O3@Co1−xS and Sm2O3@Co1−xS/MoS2 nanocomposites were examined by SEM. Fig. 1a shows the SEM of MoS2 prepared by the hydrothermal method, which can be seen that the MoS2 presents a sheet structure and aggregates together. Fig. 1b shows the SEM of Sm2O3@Co1−xS synthesized by hydrothermal method and the Sm2O3@Co1−xS presents a column structure with uniform shape and distribution. Fig. 1c shows the SEM of Sm2O3@Co1−xS/MoS2 composite, which can be seen that the columniform mixtures of Sm2O3@Co1−xS were successfully loaded on the sheet of MoS2. The above results showed that we successfully prepared MoS2 and Sm2O3@Co1−xS nano materials with regular shape and uniform distribution by hydrothermal method, and the Sm2O3@Co1−xS/MoS2 composite material was successfully synthesized on the basis of Sm2O3@Co1−xS and MoS2 nano materials.
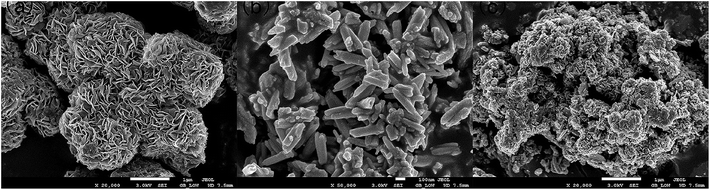 |
| | Fig. 1 SEM images of (a) MoS2, (b) Sm2O3@Co1−xS and (c) Sm2O3@Co1−xS/MoS2 composites. | |
3.2 TEM analysis
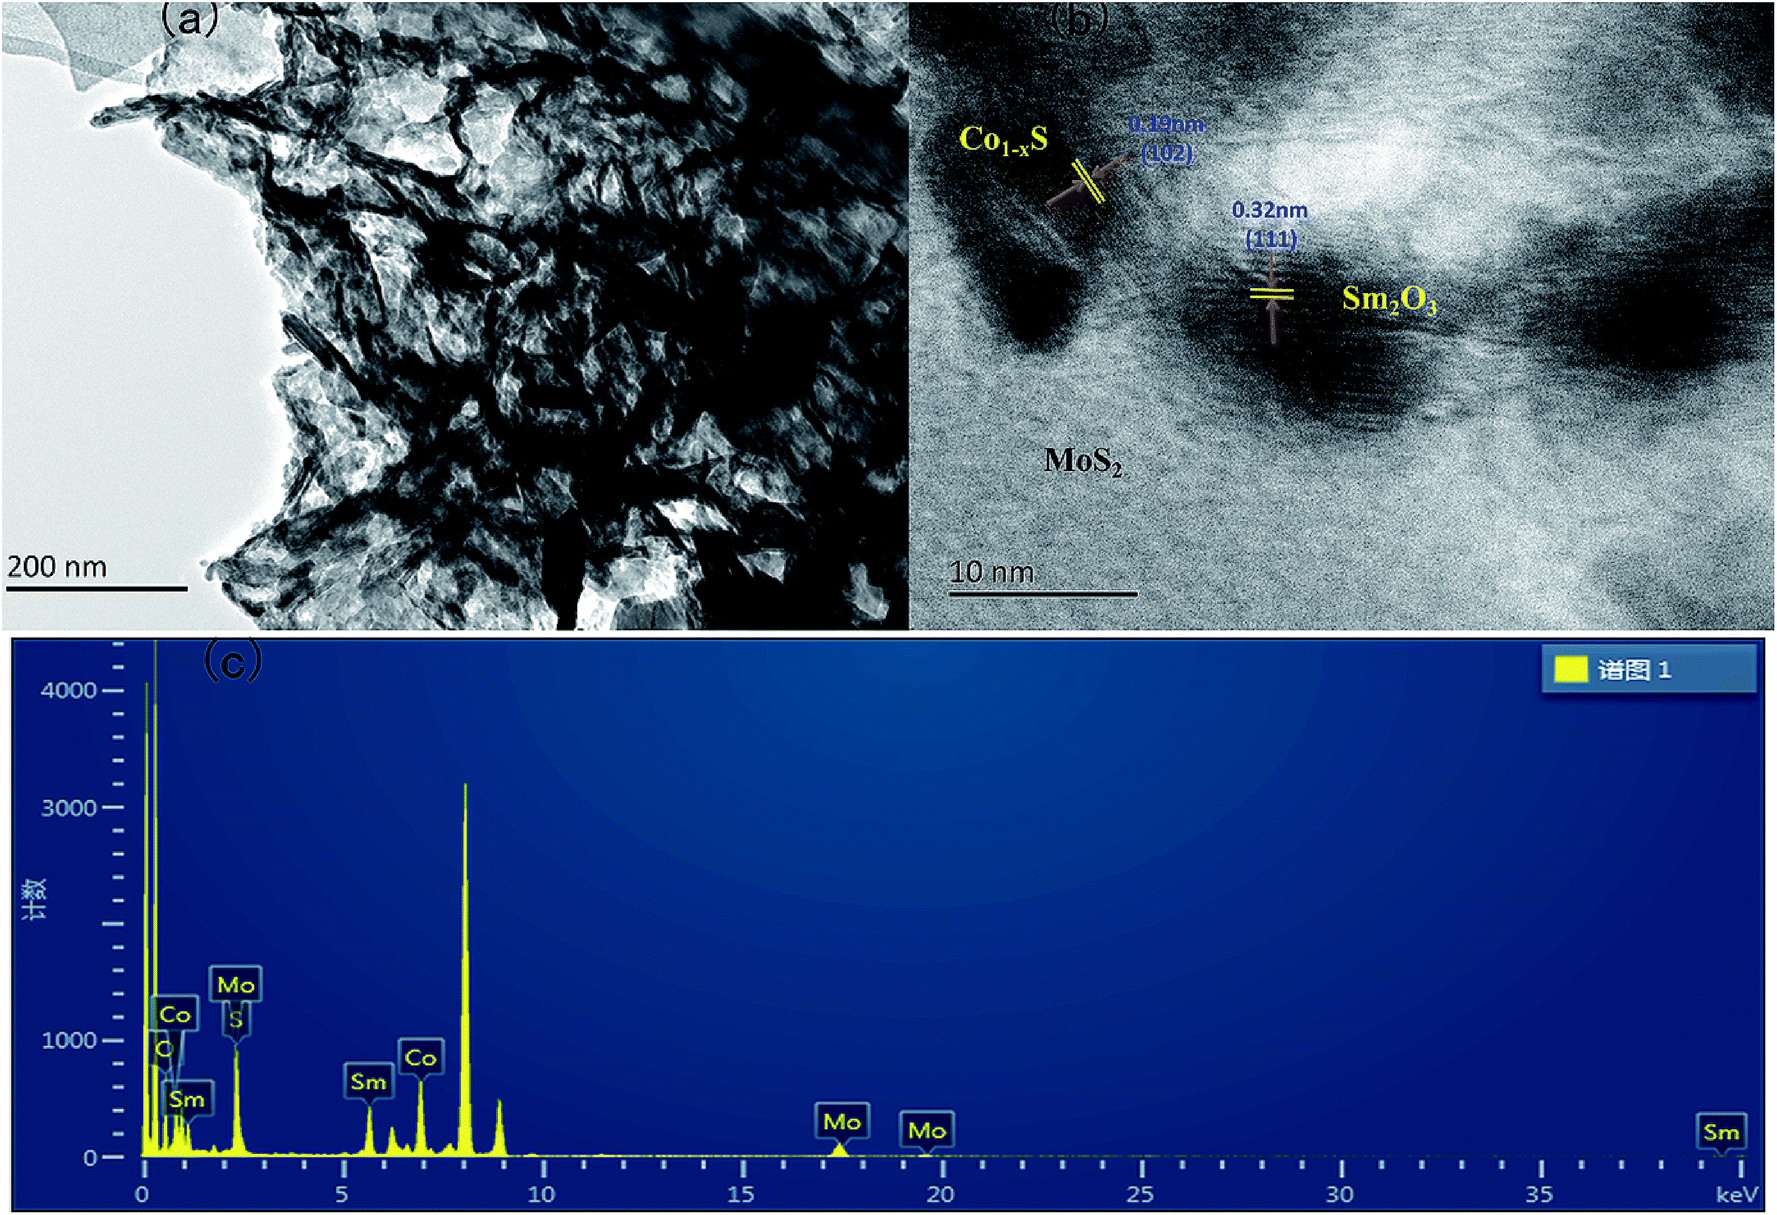
The TEM images of the Sm2O3@Co1−xS/MoS2 showed that a large amount of solid solutions on the surface of MoS2 sheet in Fig. 2a, which is agreement with the SEM analysis results of Fig. 1c. And Fig. 2b indicated the existence of Sm2O3, and the lattice striation of Sm2O3 can be observed clearly.
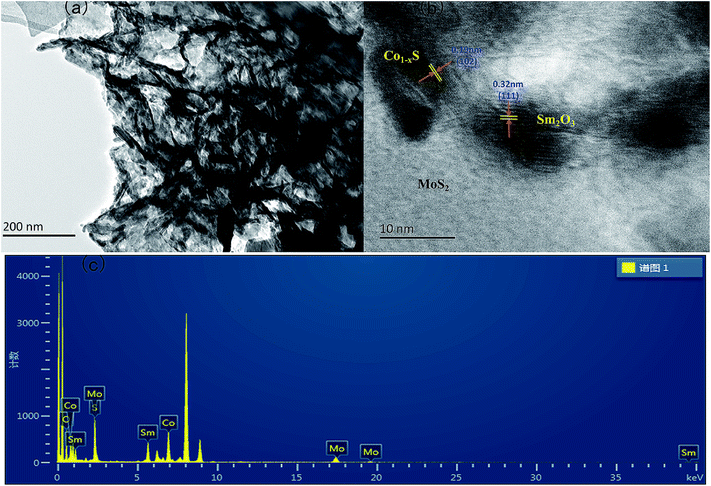 |
| | Fig. 2 (a) TEM images of Sm2O3@Co1−xS/MoS2 composites, (b) HRTEM images of Sm2O3@Co1−xS/MoS2 composites, (c) EDS spectrum of Sm2O3@Co1−xS/MoS2 in the Cu signals. | |
The spacing of the lattice is 0.32 nm, corresponding to the (002) plane of Sm2O3, which is consistent with the XRD results. In addition, we can observe that the existence of Co1−xS and the spacing of the lattice is 0.19 nm, corresponding to the (002) plane of Co1−xS. The EDS (Fig. 2c) results showed that the further confirm the existence of Sm, Co, Mo, S, O elements in Sm2O3@Co1−xS/MoS2 composite, which is consistent with the results of XPS analysis.
3.3 XRD analysis
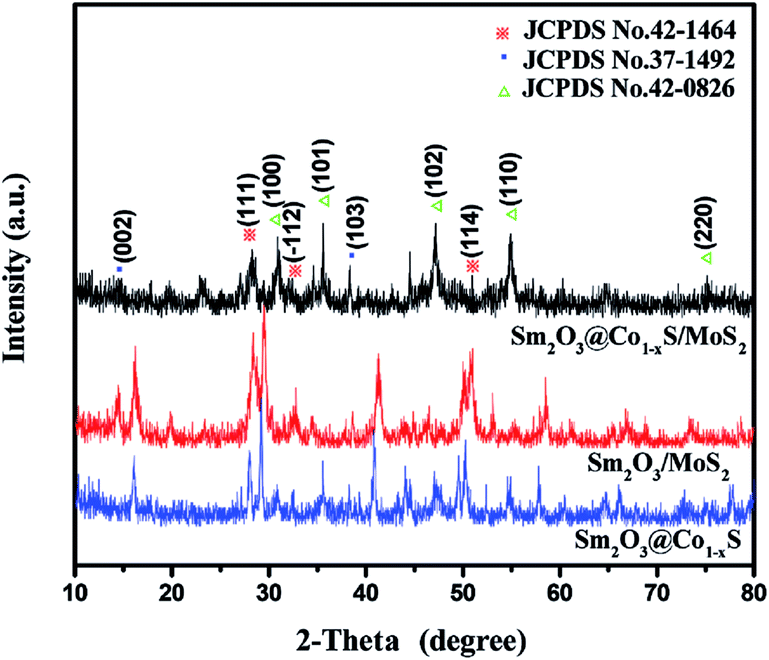
The XRD patterns (Fig. 3) of the Sm2O3/MoS2 was in good agreement with JCPDS file no. 42-1464, which indicating the existence Sm2O3. The Sm2O3 peaks located at 27.777°, 31.983° and 50.145° corresponded to (111), (112) and (114), respectively. There were many differences between the XRD patterns of Sm2O3/MoS2 and Sm2O3@Co1−xS/MoS2 nanoparticles. The XRD patterns of the Sm2O3@Co1−xS/MoS2 was in good agreement with JCPDS file no. 42–1462, indicating Co1−xS solid. For the Co1−xS, the peaks located at 30.516°, 35.178°, 46.762°, 54.266° and 74.402° corresponded to (100), (101), (102), (110) and (202). At the same times, there was no great difference between the XRD patterns of Sm2O3@Co1−xS and Sm2O3@Co1−xS/MoS2 particles. The former only showed the diffraction peaks of Sm2O3 and Co1−xS particles, with no MoS2 diffraction peak observed. For the Sm2O3@Co1−xS/MoS2 nanoparticles, it was of note that two peaks appear at 14.378° and 39.538°, corresponding to the diffraction of (002) and (103) plane (JCPDS card no. 37-1492 for MoS2). The above results indicated that nano materials prepared by the hydrothermal method were MoS2, Sm2O3@Co1−xS and Sm2O3@Co1−xS/MoS2, indeed.
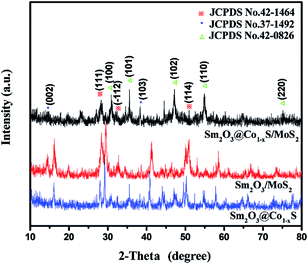 |
| | Fig. 3 The XRD patterns of Sm2O3@Co1−xS, Sm2O3/MoS2 and Sm2O3@Co1−xS/MoS2 nanoparticles. | |
3.4 XPS analysis
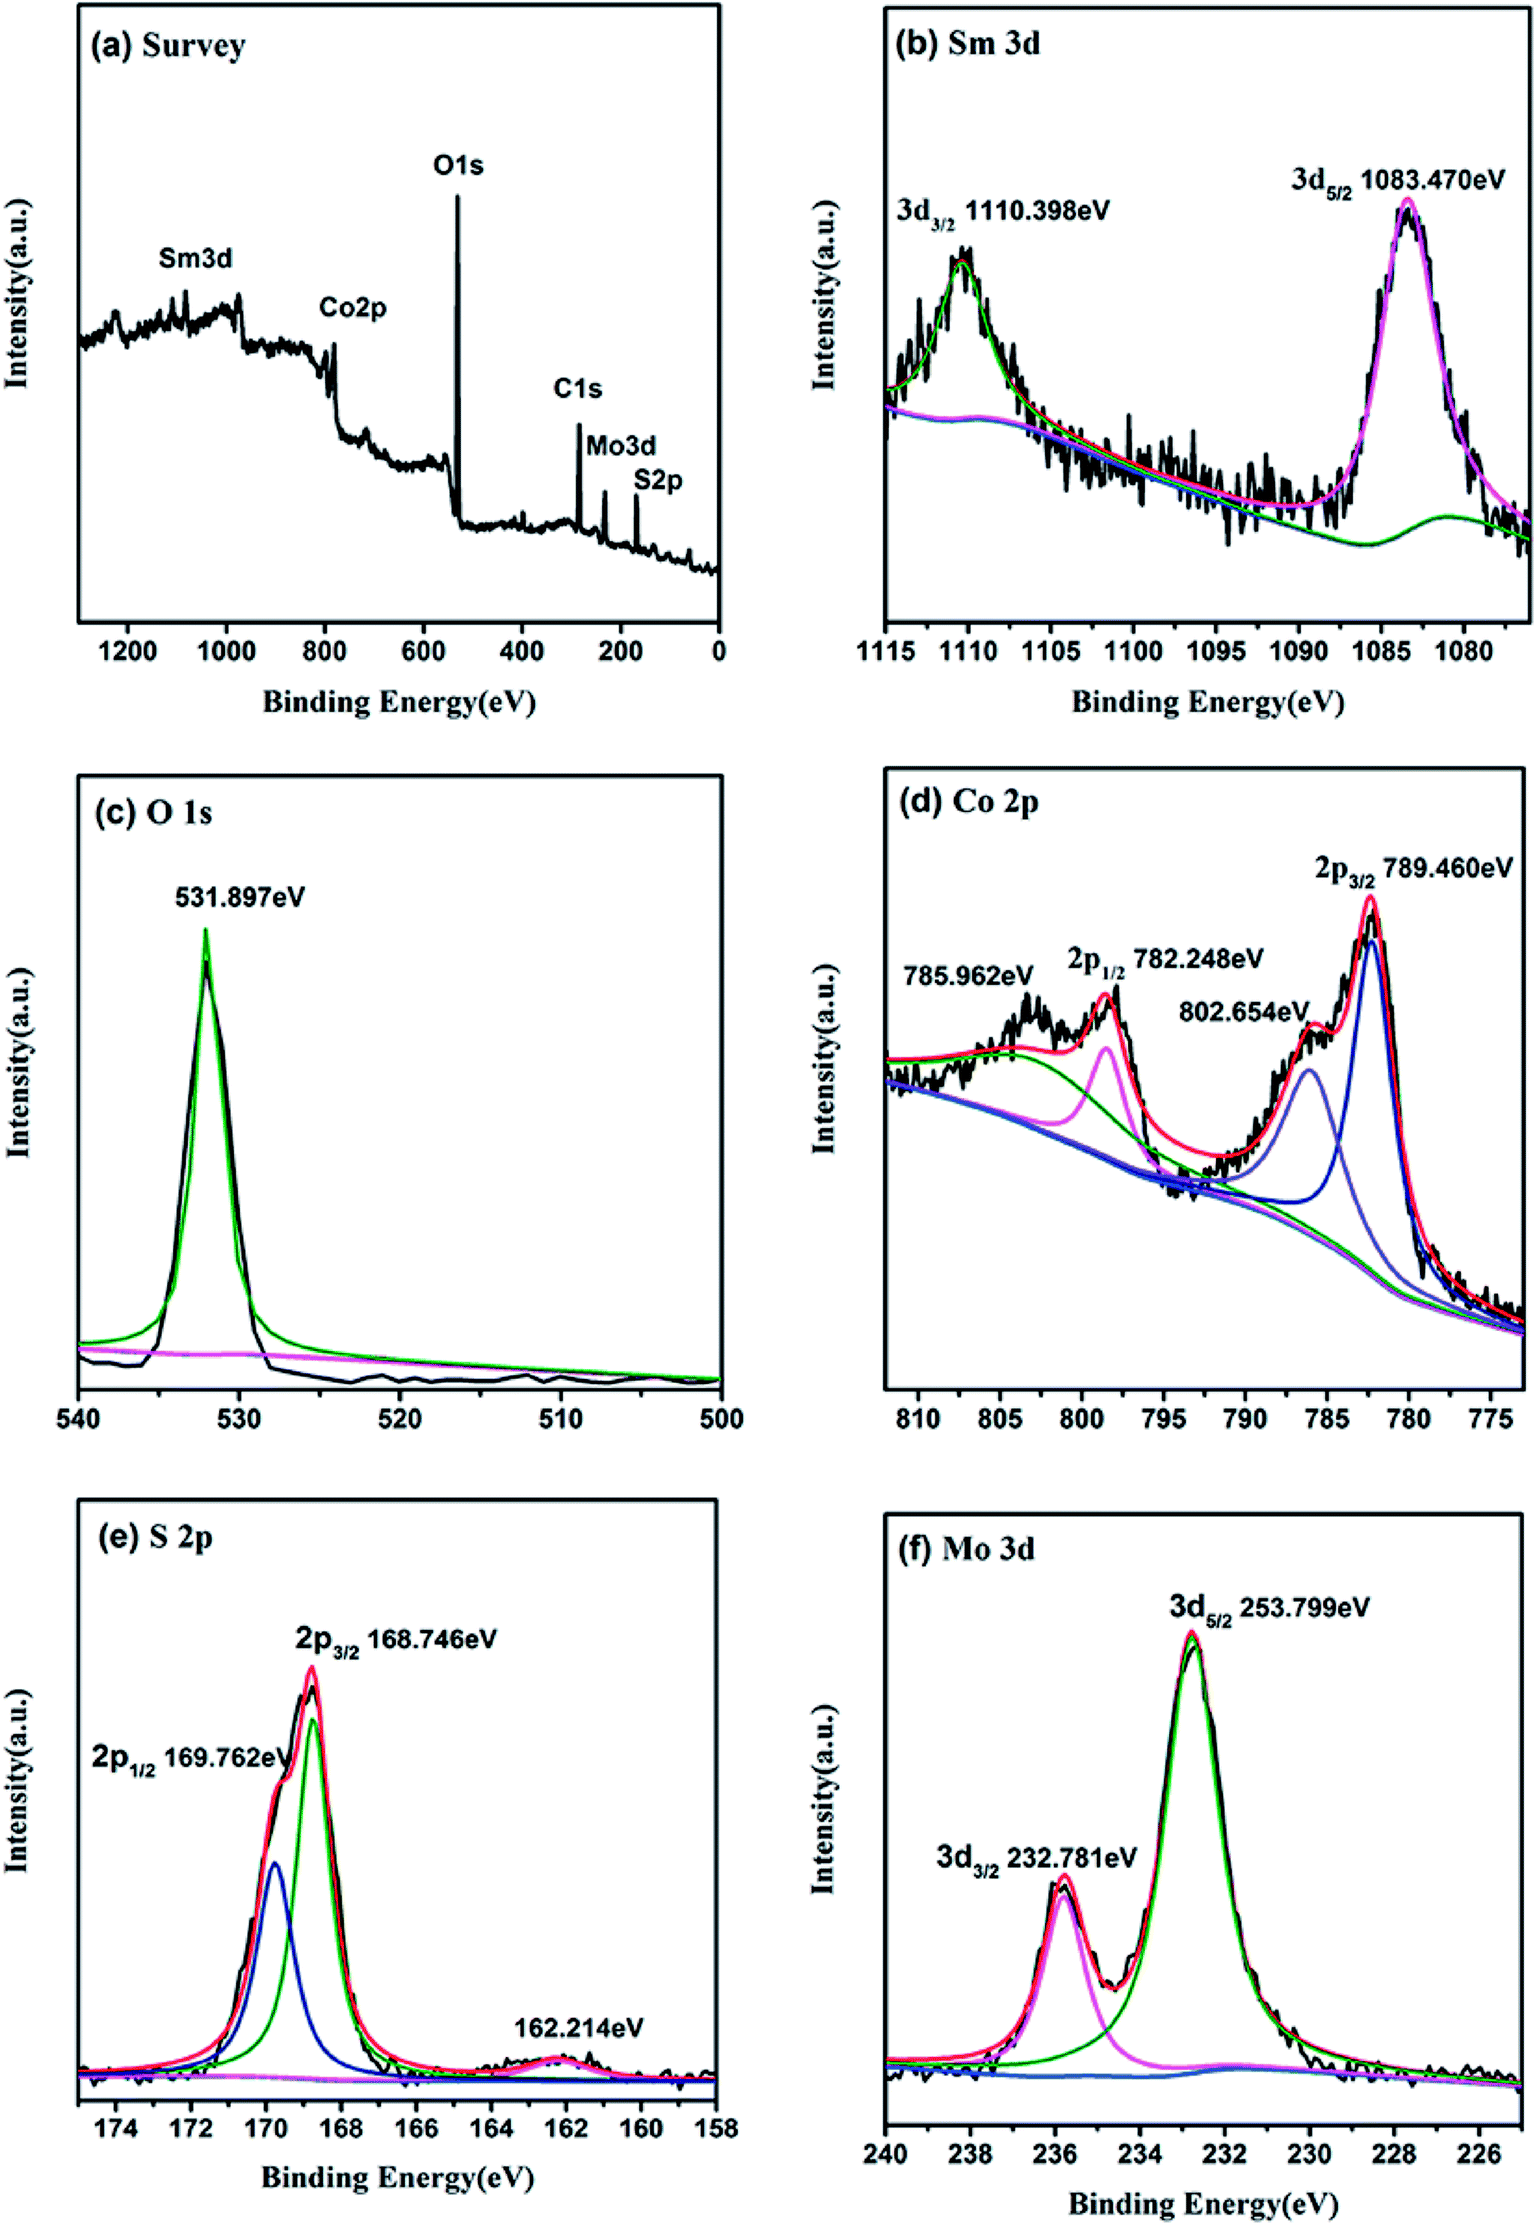
The chemical states of the sample nanomaterials can be characterized by the use of X-ray photoelectron spectroscopy (XPS). As presented in Fig. 4a, the XPS survey spectrum indicate that the catalyst mainly consist of Sm, O, Co, S, Mo and C elements, which in agreement with XRD results. In Fig. 4b, the BEs of Sm 3d5/2 and Sm 3d3/2 of Sm2O3@Co1−xS/MoS2 were found to be 1083.470 eV and 1110.398 eV, indicating that Sm were in the form of Sm3+ in Sm2O3. In Fig. 4c, one single peak at 531.897 eV was observed for O 1s XPS spectrum, which further proved the existence of Sm2O3. In Fig. 4d, the BEs of Co 2p3/2 and Co 2p1/2 were observed to be 789.460 eV and 782.248 eV, indicating that Co were in the form of Co2+and Co3+ in Co1−xS. In Fig. 4e, the BEs of S 2p3/2 and S 2p1/2 were found to be 168.746 eV and 169.762 eV, which can be seen existence in the Co1−xS. The Mo 3d spectrum in Fig. 4f shows the binding energy of Mo 3d5/2 and Mo 3d3/2 were observed to be 253.799 eV and 232.781 eV, indicating that Mo was in the form of Mo4+ in the MoS2. Both the resolution spectra of Mo 3d and S 2p ascertain the existence of MoS2 in the composite. The above results further indicated the existence of Sm2O3@Co1−xS/MoS2, which were consistent with the above XRD analysis results.
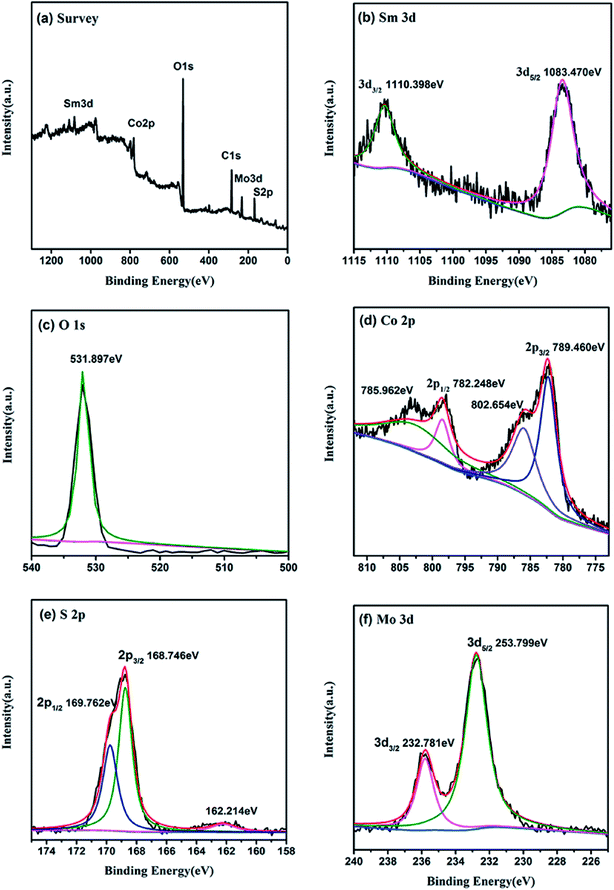 |
| | Fig. 4 XPS patterns of Sm2O3@Co1−xS/MoS2 sample. (a) Survey spectra, (b) O 1s, (c) Sm 3d, (d) Co 2p, (e) S 2p, (f) Mo 3d. | |
3.5 Photoluminescence (PL) analysis
To demonstrate the important role of Sm and Co in facilitating the transfer of electrons, the fluorescence spectra of different samples of MoS2, Sm2O3/MoS2, Co1−xS/MoS2, Sm2O3@Co1−xS and Sm2O3@Co1−xS/MoS2 were further performed. Fig. 5 shows that when EY solution (1 × 10⁻⁶ mol L−1) excitation wavelength is 480 nm, a typical wide emission peak appeared at 546 nm. After adding MoS2 to the EY solution, the fluorescence intensity decreased. When Sm2O3/MoS2 was added, the fluorescence intensity decreased obviously, because the formation of the heterostructure made the recombination of electron–hole pair suppressed, and the photoelectron can rapidly transfer. When Sm2O3@Co1−xS/MoS2 was added, the fluorescence intensity decreased sharply, which indicated that the charge recombination was inhibited and the electron migration efficiency was accelerated. In addition, the maximum emission wavelength of the MoS2 and Sm2O3/MoS2 sensitized by EY appeared to a blue shift and a red shift because of the formation of a via π–π stack interaction between Sm2O3, MoS2 and EY. The above results further indicated that Sm and Co can influence the adsorption of EY and the interaction between EY, Sm2O3@Co1−xS and MoS2, which may affect the electron transfer between EY, Sm2O3@Co1−xS and MoS2.
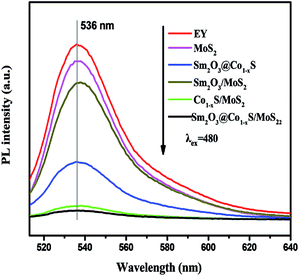 |
| | Fig. 5 Fluorescence spectra of the EY-sensitized MoS2, Co1−xS/MoS2, Sm2O3/MoS2, Sm2O3@Co1−xS and Sm2O3@Co1−xS/MoS2. | |
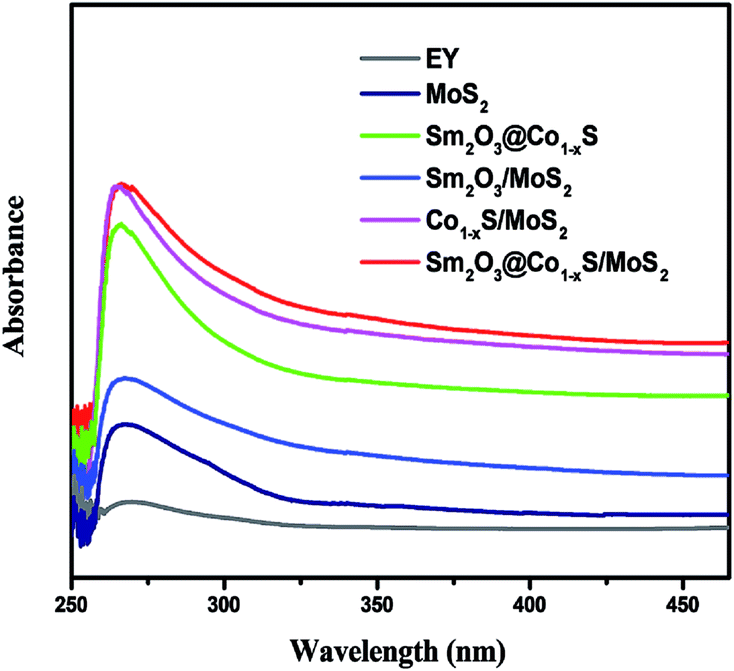
3.6 UV-vis diffuse reflectance spectra
The optical properties of all photocatalyst samples were detected using UV-vis absorption. All photocatalyst samples were absorbed from UV to visible light as expected, indicating its respective visible light response. Fig. 6 shows that the optical spectra absorption of all samples, in which can be seen that the optical absorption edge of the pure MoS2 sample was observed to be about 320 nm. At the same time, the optical absorption intensity of the sample Sm2O3/MoS2 enhanced compared with MoS2. Furthermore, the optical absorption range of the Sm2O3@Co1−xS/MoS2 composite was the widest compared with Sm2O3@Co1−xS, Sm2O3/MoS2 and Co1−xS/MoS2, which enhanced from 320 nm to 450 nm. After comprehensive analysis, we can see that when the addition of Sm and Co, the absorption range of photocatalyst became larger and spectral absorption peaks red shift, as well as the intensity increased, which showed that Sm and Co significantly improved the visible light response, thus improved the transfer efficiency of photoelectron the photocatalytic hydrogen evolution efficiency.
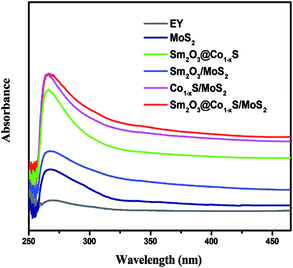 |
| | Fig. 6 UV-vis diffuse reflectance spectra of the MoS2, Co1−xS/MoS2, Sm2O3/MoS2, Sm2O3@Co1−xS and Sm2O3@Co1−xS/MoS2. | |
3.7 Effect of pH and the ratio of Sm and Mo on hydrogen evolution
It was well known that the pH of the catalytic system solution can significantly affect the photocatalytic activity of hydrogen evolution. Fig. 7a shows that the alkaline solution is conducive to the hydrogen evolution reaction of the Sm2O3@Co1−xS/MoS2 catalytic system. However, when the solution alkalinity is too strong, it is not conducive to H2 evolution. The TEOA solution showed high photocatalytic activity in a wide pH range from 8 to 12, and the highest activity of hydrogen evolution was found at pH 11. The increase of hydrogen evolution activity may be due to the state of TEOA which was influenced by pH solution. When the TEOA in the solution at pH 11 can completely restored EY, and EY can effectively adsorb on the surface of the Sm2O3@Co1−xS/MoS2 catalyst to participate in the catalytic reaction of hydrogen evolution.
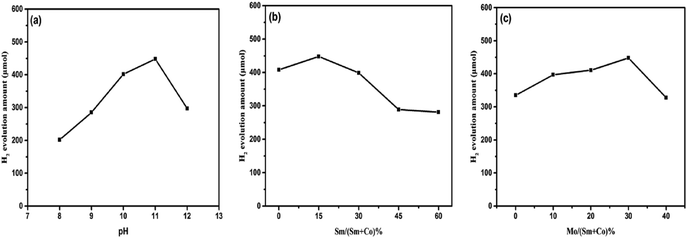 |
| | Fig. 7 Effect of the different factor on the Sm2O3@Co1−xS/MoS2 for H2 evolution, including the pH (a), Sm/(Sm + Co)% (b) and Mo/(Sm + Co)% (c). | |
In addition, the high pH from 11 to 12 can see that the hydrogen evolution amount dropped sharply, from 448 μmol to 297 μmol. Because the solution high pH leaded to low proton concentration in the solution, which was not conducive to the reduction of H+.
The different molar ratio of Sm to Co also affected the hydrogen evolution activity of the Sm2O3@Co1−xS/MoS2 catalyst. The hydrogen evolution of the corresponding Sm2O3@Co1−xS/MoS2 catalyst is shown in Fig. 7b. We can see that the addition of Sm improved the electron transfer efficiency of the catalyst, thus increasing the hydrogen evolution efficiency. However, when Sm added too much, the H2 evolution rate decreased. Because of excess Sm occupying the active site of Co, when the molar ratio of Sm and (Sm + Co) was 15%, the photocatalytic activity of the Sm2O3@Co1−xS/MoS2 catalyst was the best. In addition, the molar ratio of Mo precursor to (Sm + Co) also influenced the photocatalytic activity of the Sm2O3@Co1−xS/MoS2 catalyst. The hydrogen evolution corresponding to the Sm2O3@Co1−xS/MoS2 catalyst is shown in Fig. 7c. The molar amount of Mo precursor was varied from 0% to 40%. When the molar ratio of Mo to (Sm + Co) was 30%, the H2 evolution of the Sm2O3@Co1−xS/MoS2 catalyst was the best. When Mo was excessive, the role of cocatalyst Sm2O3@Co1−xS was reduced and the hydrogen evolution rate of the Sm2O3@Co1−xS/MoS2 catalyst was reduced. In conclusion, when the pH of TEOA was 11, and the molar ratio of Sm/(Sm + Co) and Mo/(Sm + Co) was 15% and 30% respectively, the hydrogen evolution efficiency of the Sm2O3@Co1−xS/MoS2 catalyst were as high as 448 μmol.
In order to prove that the photocatalytic activity of Sm2O3@Co1−xS/MoS2 catalyst, the MoS2, Sm2O3/MoS2, Sm2O3@Co1−xS and Co1−xS/MoS2 were prepared by the same hydrothermal method for comparison. The hydrogen evolution of different catalysts were carried out separately. Fig. 8a shows that the catalysts Sm2O3@Co1−xS exhibited superior photocatalytic activity for hydrogen evolution, and the hydrogen evolution reached 335 μmol respectively. However, the highest photocatalytic activity was Sm2O3@Co1−xS/MoS2 sample, and the hydrogen evolution amount reached 448 μmol. Because of the addition of MoS2, the adsorption of EY to Sm2O3@Co1−xS/MoS2 is increased, thus increasing the electron transfer rate and increasing hydrogen production. As shown in Fig. 8b, it can be seen that the highest AQEs is 32.1% at 475 nm, which indicates that the maximum absorption wavelength of EY–Sm2O3@Co1−xS/MoS2 is near 475 nm. The AQEs showed lower performance at 420 nm and 500 nm respectively. However, another high AQEs appears in 520 nm, which is related to the highest absorption wavelength of EY (518 nm).42 These results indicated that the H2 producing reaction of Sm2O3@Co1−xS/MoS2 photocatalyst was indeed driven with the absorbing EY. And then the hydrogen evolution of catalyst Sm2O3@Co1−xS/MoS2 in three cycle times (Fig. 8c) still had a high stability. As time goes on, photocatalytic hydrogen production began to decay slightly. The reason is that the stability of their sensitizer is poor, because the EY dye is easy to desorption and diffuse into the solution, which can be decomposed under the irradiation of light. These results show that the dye molecules can be well adsorbed on the photocatalyst Sm2O3@Co1−xS/MoS2, and the hydrogen production can be improved effectively.
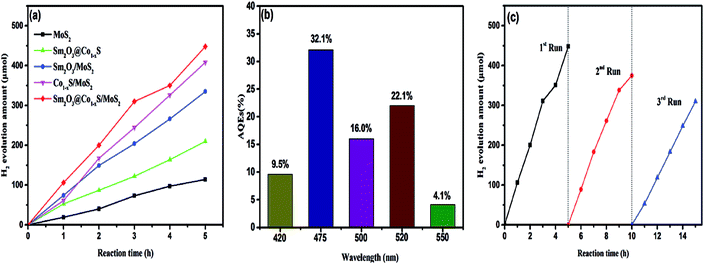 |
| | Fig. 8 Photocatalyst activities of different photocatalysts (a), the AQEs of H2 evolution under different wavelength irradiation for 60 min (b) and H2 evolution for different reclining times of photocatalysts (c). | |
3.8 BET analysis
Fig. 9a shows the nitrogen adsorption–desorption isotherms of the Sm2O3@Co1−xS solid and the Sm2O3@Co1−xS/MoS2 composite. Both Sm2O3@Co1−xS solid solution and the Sm2O3@Co1−xS/MoS2 composite were observed here to have type IV isotherms. The hysteresis loops of type H2 at relative pressure range of 0.9–1 and 0.8–1 for the Sm2O3@Co1−xS solid and the Sm2O3@Co1−xS/MoS2 composite, indicating that the form of mesopores of Sm2O3@Co1−xS and Sm2O3@Co1−xS/MoS2. At the same time, the pore size distributions curves in Fig. 9b shows that Sm2O3@Co1−xS solid solution and the Sm2O3@Co1−xS/MoS2 composite have similar curves, which mainly consist of large size pores. The specific surface areas of Sm2O3@Co1−xS solid solution and the Sm2O3@Co1−xS/MoS2 composite were determined to be 17.49 m2 g−1 and 23.79 m2 g−1, respectively. Meanwhile, compared to Sm2O3@Co1−xS (16.17 nm), the Sm2O3@Co1−xS/MoS2 has a bigger pore size (23.73 nm). When it was combined with MoS2, both the pore size and specific surface area of Sm2O3@Co1−xS were increased. As can be seen from Table 1, the specific surface area of Sm2O3@Co1−xS/MoS2 is the largest compared to MoS2, Sm2O3/MoS2 and Sm2O3@Co1−xS, which is good for EY adsorption, accelerate the electron transfer rate and improve the production of hydrogen.
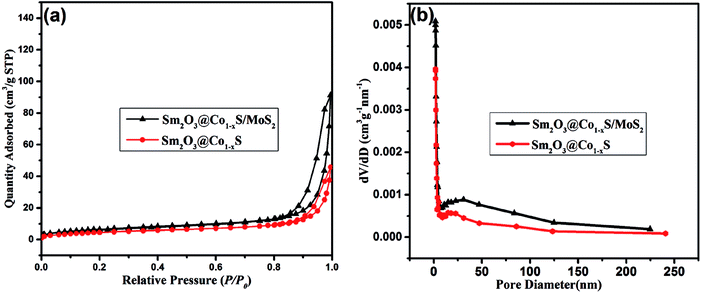 |
| | Fig. 9 (a) BET adsorption–desorption isotherms of catalysts and (b) the corresponding pore size distributions. | |
Table 1 Parameters of different samples obtained from the analysis of N2 adsorption isotherms
| Samples |
S
BET
a (m2 g−1) |
Pore volumeb (cm3 g−1) |
Average pore sizeb (nm) |
|
The date obtained from BET method.
The pore volume extracted from the N2 adsorption amount when the relative pressure (P/P0) of 0.3.
|
| MoS2 |
7.38 |
0.042 |
33.06 |
| Sm2O3/MoS2 |
13.19 |
0.048 |
13.86 |
| Sm2O3@Co1−xS |
17.49 |
0.070 |
16.17 |
| Sm2O3@Co1−xS/MoS2 |
23.79 |
0.141 |
23.73 |
3.9 Electrochemical analysis
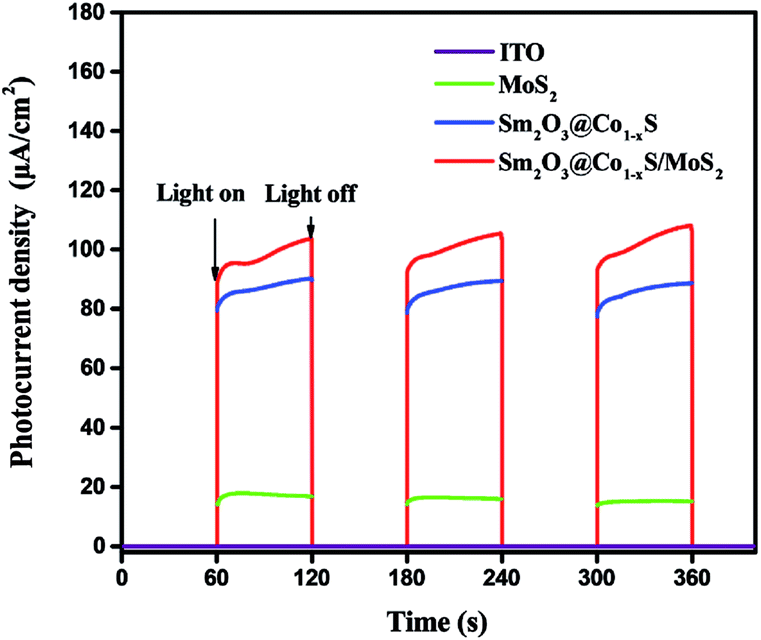
The photocurrent response experiment further demonstrated the electron transfer mechanism of the EY-sensitized Sm2O3@Co1−xS/MoS2 reaction process. In the photocurrent response experiment, MoS2, Sm2O3@Co1−xS and Sm2O3@Co1−xS/MoS2 catalysts were selected for testing. From Fig. 10 can be seen that the ability of photocurrent response of Sm2O3@Co1−xS/MoS2 electrode was significantly enhanced compared with Sm2O3@Co1−xS electrode and MoS2 electrode, and the MoS2 electrode only exhibited a weak photocurrent response. The above results further showed that the efficiency of electronic transfer from Sm2O3@Co1−xS/MoS2 interface was significantly better than that of Sm2O3@Co1−xS and MoS2. In other words, because of the excellent electronic reception and release ability of Sm and the synergy effect of Co. Sm2O3 and Co1−xS can effectively promote the electron transfer and charge separation efficiency in a catalyst reaction system, and reduced the recombination rate of light electron–hole. In conclusion, Sm2O3 and Co1−xS can accept electrons as an excellent electron acceptor, and Sm can induce electron rapid transfer and inhibit the recombination of electron–hole. Thus, the efficiency of photocatalytic decomposition of water for hydrogen evolution was significantly improved.
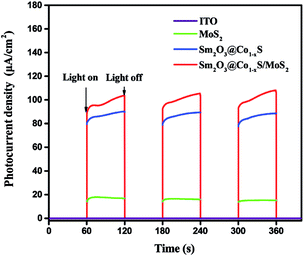 |
| | Fig. 10 The transient photocurrent response for the EY-sensitized MoS2, Sm2O3@Co1−xS and Sm2O3@Co1−xS/MoS2. | |
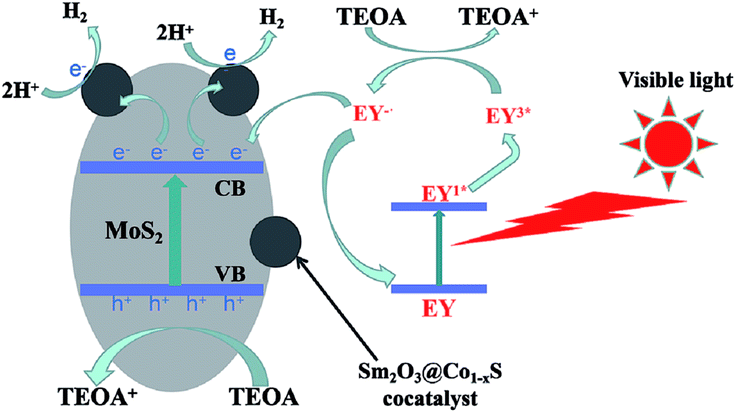
3.10 Mechanism of photocatalytic hydrogen evolution
Based on the above analysis, the photocatalytic H2 evolution mechanism of Sm2O3@Co1−xS/MoS2 as a catalyst in the EY-sensitized system can be seen from Fig. 11. Because of the synergistic effect of MoS2 and cocatalyst Sm2O3@Co1−xS, the photocatalytic activity of Sm2O3@Co1−xS/MoS2 was improved significantly, the separation efficiency and transfer efficiency of light charge were improved. Under visible light, EY adsorbed on the Sm2O3@Co1−xS/MoS2 surface became singlet excited state EY1* by absorbing the photon energy, which became stable triplet excited state EY3* by an efficient inter system crossing (ISC). Then TEOA solution could be regard as an electron donor, EY3* was reduced to EY−˙ and oxidative state TEOA+. The electron of the EY−˙ species were transmitted to cocatalyst Sm2O3@Co1−xS loaded on the MoS2 surface to reduce H+ to H2 and to reduce the dye molecules to the ground state as well. In addition, MoS2 can also reduce H+ to H2. Because the high specific surface area of MoS2 was not only good for dye adsorption, but also for EY− transferring electrons to cocatalyst Sm2O3@Co1−xS and participating in the reduction of H+. Which greatly inhibited the recombination of the light-generated charge and improve the transfer efficiency of the photocatalytic electrons. Thus, the efficiency of photocatalytic decomposition of water for hydrogen evolution was significantly improved. So the photocatalytic activity of Sm2O3@Co1−xS/MoS2 sensitized by EY was obviously better than that of MoS2 sensitized by EY.
 |
| | Fig. 11 Mechanism of photocatalytic hydrogen evolution by EY-sensitized Sm2O3@Co1−xS/MoS2. | |
4. Conclusions
In summary, the excellent composite Sm2O3@Co1−xS/MoS2via Sm2O3@Co1−xS and MoS2 was successfully prepared by using the hydrothermal method. The hydrogen evolution by the EY sensitized catalyst under visible light irradiation showed the photocatalytic activity and stability of Sm2O3@Co1−xS/MoS2. It was better than other composite catalysts, and all of them were prepared by the same one-step hydrothermal method. The results showed that the excellent electronic reception ability of Sm and the excellent electronic transmission performance of Co accelerated the migration rate of optical electrons, and inhibited the recombination of optical carriers. And the specific surface area was increased by the synthesis of new composite materials. In addition, the effect of pH of TEOA solution on hydrogen evolution from decomposition of water by catalyst was also very important. The hydrogen evolution of the Sm2O3@Co1−xS/MoS2 catalyst was as high as 448 μmol under visible light irradiation. Sm2O3@Co1−xS/MoS2 photocatalyst exhibited excellent photocatalytic activity and photochemical stability, and it can be used as an efficient photocatalyst in environmental purification and green energy application in the future.
Conflicts of interest
There are no conflicts to declare.
Acknowledgements
This work was supported by the Key Scientific Research Projects in 2017 at North Minzu University (2017KJ19).
References
- L. Carrete, K. A. Friedrich and U. Stimming, Chem.–Eur. J., 2001, 1, 5–39 Search PubMed.
- C. Hall, P. Tharakan, J. Hallock, C. Cleveland and M. Jefferson, Nature, 2003, 426, 318–322 CrossRef CAS PubMed.
- B. Mahmah, F. Harouadi, H. Benmoussa, S. Chader, M. Belhamel, A. M. Raoui, K. Abdeladim, A. N. Cherigui and C. Etievant, Int. J. Hydrogen Energy, 2009, 34, 4922–4933 CrossRef CAS.
- L. Schlapbach and A. Zuttel, Nature, 2001, 414, 353–358 CrossRef CAS PubMed.
- C. M. Kalamaras and A. M. Efstathiou, Conf. Pap. Energy, 2013, 9, 2333–9721 Search PubMed.
- E. Y. Marrero-Alfonso, A. M. Bearid, T. A. Davis and M. A. Matthews, Ind. Eng. Chem. Res., 2009, 48, 3703–3712 CrossRef CAS.
- K. Trzcinski, M. Szkoda, M. Szkoda, M. Sawczak and J. Karczewski, Appl. Surf. Sci., 2016, 385, 199–208 CrossRef CAS.
- F. Cheng, H. Yin and Q. Xiang, Appl. Surf. Sci., 2017, 391, 432–439 CrossRef CAS.
- X. Wang, T. Li, R. Yu and J. Yu, J. Mater. Chem. A, 2016, 4, 8682–8689 RSC.
- Q. Xiang, F. Cheng and D. Lang, ChemSusChem, 2016, 9, 996 CrossRef CAS PubMed.
- Q. Xiang, F. Cheng and D. Lang, Catal. Sci. Technol., 2016, 6, 6207–6216 RSC.
- Y. Xu, Y. Mo, J. Tian, P. Wang and H. Yu, Appl. Catal., B, 2016, 181, 810–817 CrossRef CAS.
- R. Ye, H. B. Fang and Y. Z. Zheng,
et al.
, ACS Appl. Mater. Interfaces, 2016, 8, 13879–13889 CrossRef CAS PubMed.
- R. Retnamma, A. Q. Novais and C. M. Rangel, Int. J. Hydrogen Energy, 2011, 36, 9772–9790 CrossRef CAS.
- N. Patel, R. Fernandes, S. Gupta, R. Edla and D. C. Kothari, Appl. Catal., B, 2013, 141, 125–132 CrossRef.
- N. Patel, R. Fernandes and A. Miotell, J. Power Sources, 2009, 188, 411–420 CrossRef CAS.
- R. Fernandes, N. Patel, A. Miotell and M. Filippi, J. Mol. Catal. A: Chem., 2009, 298, 1–6 CrossRef CAS.
- N. Patel and A. Miotello, Int. J. Hydrogen Energy, 2015, 40, 1429–1464 CrossRef CAS.
- Y. M. Dong, K. He, L. Yin and A. M. Zhang, Nanotechnology, 2007, 18, 435602 CrossRef.
- S. A. Makhlouf, Z. H. Bakr, K. I. Aly and M. S. Moustafa, Superlattices Microstruct., 2013, 64, 107–117 CrossRef CAS.
- L. J. Zhang, R. Zheng, S. Li, B. K. Liu and D. J. Wang, ACS Appl. Mater. Interfaces, 2014, 6, 13406–13412 CrossRef CAS PubMed.
- D. Lang, F. Y. Cheng and Q. J. Xiang, Catal. Sci. Technol., 2016, 6, 6207–6216 RSC.
- Y. F. Wang, M. C. Hsieh, J. F. Lee and C. M. Yang, Appl. Catal., B, 2013, 142–143, 626–632 CrossRef CAS.
- B. Sala, I. Mondal, A. Goswami, U. Pal and R. Mondal, J. Mater. Chem. A, 2015, 3, 20288–20296 RSC.
- J. Wen, J. Xie, X. Chen and X. Li, Appl. Surf. Sci., 2017, 391, 72–123 CrossRef CAS.
- Y. Sun, C. Liu, D. C. Grauer, J. Yano, J. R. Long, P. Yang and C. J. Chang, J. Am. Chem. Soc., 2013, 135, 17699–17702 CrossRef CAS PubMed.
- H. Yu, P. Xiao, P. Wang and J. G. Yu, Appl. Catal., B, 2016, 193, 217–225 CrossRef CAS.
- X. Zhu, P. Wang, Q. Zhang, Z. Wang and Y. Liu, RSC Adv., 2017, 7, 44626–44631 RSC.
- K. Chen, L. Ma, J. H. Wang, Z. Q. Chen and D. J. Yang, RSC Adv., 2017, 7, 26097–26103 RSC.
- X. Liu, L. Zhao, H. Lai, Y. Wei and G. Yang, RSC Adv., 2017, 7, 46738–46744 RSC.
- W. Zhang, X. Xiao, Y. Li, X. Zeng and L. Zheng, Appl. Surf. Sci., 2016, 389, 496–506 CrossRef CAS.
- Q. Xiang, J. Yu and M. Jaroniec, J. Am. Chem. Soc., 2012, 134, 6575–6578 CrossRef CAS PubMed.
- Y. Zhao, X. Zhang, C. Wang, Y. Zhao and H. Zhou, Appl. Surf. Sci., 2017, 412, 207–213 CrossRef CAS.
- L. Chen, F. He, N. Zhao and R. Guo, Appl. Surf. Sci., 2017, 420, 669–680 CrossRef CAS.
- R. Zhang, W. Wan, D. Li, F. Dong and Y. Zhou, Chin. J. Catal., 2016, 38, 313–320 CrossRef.
- S. Ma, J. Xie, J. Wen, K. He and X. Li, Appl. Surf. Sci., 2016, 391, 580–591 CrossRef.
- Y. Gong, J. Lin, X. Wang, G. Shi, S. Lei and Z. Lin,
et al.
, Nat. Mater., 2014, 13, 1135–1142 CrossRef CAS PubMed.
- W. Wang, L. Li, K. Wu, K. Zhang, J. Jie and Y. Yang, Appl. Catal., A, 2015, 495, 8–16 CrossRef CAS.
- W. Wang, K. Zhang, L. Li, K. Wu, P. Liu and Y. Yang, Ind. Eng. Chem. Res., 2014, 53, 19001–19009 CrossRef CAS.
- L. M. Torres-Martínez, M. Z. Figueroa-Torres and E. Moctezuma, Int. J. Photoenergy, 2017, 43, 3981–3992 Search PubMed.
- M. Wang, M. You, P. Guo, H. Tang, C. Lv, Y. Zhang, T. Zhu and J. Han, J. Alloys Compd., 2017, 0925–8388, 33104–33113 Search PubMed.
- W. Zhen, J. Ma and G. Lu, Appl. Catal., B, 2016, 190, 12–25 CrossRef CAS.
|
| This journal is © The Royal Society of Chemistry 2017 |
Click here to see how this site uses Cookies. View our privacy policy here. 
 Open Access Article
 This Open Access Article is licensed under a Creative Commons Attribution-Non Commercial 3.0 Unported Licence
 *,
Hao
Guo
,
Yanru
Li
,
Zeying
Liu
and
Zhiliang
Jin
*,
Hao
Guo
,
Yanru
Li
,
Zeying
Liu
and
Zhiliang
Jin