
 Open Access Article
 This Open Access Article is licensed under a
 Creative Commons Attribution 3.0 Unported Licence
Differential diagnosis of human lung tumors using surface desorption atmospheric pressure chemical ionization imaging mass spectrometry†
Yongzhong Ouyang *a,
Junwen Liub,
Baohua Niec,
Naiping Dongd,
Xin Chena,
Linfei Chenb and
YiPing Weie
*a,
Junwen Liub,
Baohua Niec,
Naiping Dongd,
Xin Chena,
Linfei Chenb and
YiPing Weie
aSchool of Environmental and Chemical Engineering, Foshan University, Foshan, Guangdong 528000, P. R. China. E-mail: ouyang7492@163.com; Fax: +86-757-83963780; Tel: +86-757-83963780
bSchool of Chemistry, Biological and Materials Sciences, East China University of Technology, Nanchang, Jiangxi 330006, P. R. China
cSchool of Materials Science and Energy Engineering, Foshan University, Foshan, Guangdong 528000, P. R. China
dDepartment of Applied Biology and Chemical Technology, The Hong Kong Polytechnic University, Hung Hom, Kowloon, Hong Kong
eDepartment of Cardiothoracic Surgery, Second Affiliated Hospital of Nanchang University, Nanchang, Jiangxi 330006, P. R. China
First published on 12th December 2017
Abstract
Distinguishing tumors from normal tissue is a key component in lung cancer-conserving surgery. In this study, accurate diagnosis of human squamous cell carcinoma lung cancer in untreated tissue sections is achieved by ambient mass spectrometry imaging using liquid-assisted surface desorption atmospheric pressure chemical ionization mass spectrometry (DAPCI-MS) combined with multivariate statistical analysis. DAPCI-MS imaging shows great promise as a molecular pathology technique that uses the phosphatidylcholine (PC) and sphingomyelin (SM) profiles of tissues to visualize and differentiate lung cancer from normal tissue, and the use of multivariate statistical analysis significantly increases the confidence of this diagnosis through data interpretation. Multivariate statistical analysis has played an important role in biomarker discovery and lung cancer diagnosis, highlighting the need for the use of multivariate statistical analyses to reduce the high-dimensional mass spectral data. Partial least-squares linear discriminate analysis (PLS-LDA) was successfully used for visualization and classification of 14 tissue pairs (28 tissue samples) using the full scan mass spectra data, only with a misclassification rate of 2.16% determined from the validation set. Multiple distinctive PC and SM species between the tumor and non-tumor samples derived from massive full scan mass spectral data using PLS-LDA were tentatively identified by individual ion images, compared with the pathological examination of the hematoxylin and eosin (H&E) stained tissue sections. A significant increase in multiple phosphatidylcholines (PCs) and a decrease in several specific sphingomyelins (SMs), particularly as well as increased levels of choline (C5H14NO+) were uncommonly observed in tumor regions with respect to adjacent noncancerous areas. These could be the signature compounds and have the largest possibility as potential biomarker compounds for identifying and differentiating tumor regions from adjacent normal tissue sections. Overall, the DAPCI-MSI combined with multivariate statistical analysis provides an effective tool for direct ambient analysis of such complex heterogeneous lung tissue samples, which has great potential in the application of intraoperative tumor assessment.
Introduction
Lung cancer is the leading cause of cancer-related death worldwide, accounting for an estimated 1.69 million deaths in 2015, whereas non-small cell lung cancer (NSCLC) was responsible for approximately 85% of all cases of all lung cancers in the United States.1 Cancer conservation surgery (BCS) remains a successful treatment option for most non-small cell lung cancer patients at an early stage at present.2,3 Incomplete resection of tumor and positive margins are usually associated with locoregional recurrence compared with negative margins, and are accompanied by a number of undesirable problems.4 Thus, in situ differentiation of tumor regions from adjacent normal areas is crucially important in surgical oncology to obtain confident curative resection and accurate prognosis, as well as to minimize losses to healthy tissues.Many intraoperative techniques have been increasingly applied to the detection and discrimination of human lung cancerous tissue by the surgeon to guide adequate resection. The role of CT screening5 and other techniques such as chest radiograph (CXR),6 positron emission tomography (PET) scanning,7,8 and Magnetic Resonance Imaging (MRI)9 could allow earlier diagnosis and more effective treatment of lung cancer. Recently, various types of molecular biomarkers have been explored for lung cancer screening and diagnosis. Genetic deletions in sputum10 and miRNAs expression signatures11–15 served as potential diagnostic markers for detection of early stage NSCLC. Despite numerous improvements in imaging and surgical techniques, the need for reexcision to achieve complete tumor resection in the United States significantly increased recently. The histopathological examination of frozen specimens for diagnosis or tumor margin delineation during surgery is of limited utility for guiding surgical resection as it depends on professional evaluation of the tissue resection from locations of interest, significantly delaying surgical intervention.16–18 Therefore, improvements in diagnostics and treatments are urgently needed.
Mass spectrometry imaging (MSI) has emerged as a powerful tool in the last decade owing to its unique ability to acquire molecularly specific images and provide label-free multiplexed spatial information, without the need for staining.19 Particularly, the newly developed ambient ionizations, irritated by desorption electrospray ionization (DESI),20 open an unprecedented way for MSI of complex biological tissue samples, since it has afford the ability to determine spatial distribution of numerous molecular classes simultaneously directly from complex sample surfaces within native environment without any special sample pretreatment.21–30 With the advantage of easy operation and in situ, DESI-MSI has great potential in the application of intraoperative tumor assessment, which allows direct analysis of biological tissues, including rat brain,21–24 human brain tumors,25 human astrocytoma,26 human liver adenocarcinoma tissue,27 and human breast cancer,28 under ambient conditions with minimal or no sample preparation. However, little work has been reported on human lung tissues analysis using MSI due to their weak ionization and desorption for such complicated heterogeneous tissue surfaces, a notable exception being the observation of distinctive lipid markers associated with tumor and non-tumor regions in human lung tissue samples by ambient mass spectrometry imaging using air flow-assisted desorption electrospray ionization (AFA-DESI).31
In our previous studies, desorption atmospheric pressure chemical ionization (DAPCI) mass spectrometry has been demonstrated with satisfactory sensitivity and high throughput for direct detection of complex living biological tissues such as natural products and animal tissues.32–36 The ambient corona ionization presented in this study is a modified desorption atmospheric pressure chemical ionization (DAPCI). As a variant of DESI technique, the electrospray emitter in the DESI source was replaced by a tapered tip stainless steel needle in the DAPCI source, and vapors of various solvents were mixed into the annular gas flow. A high voltage, with about 3–6 kV, was applied to the steel needle, and the gaseous solvent vapors were ionized in close proximity to the stainless steel tip by corona discharge ionization. The generated primary ions such as hydronium ions and radical water cations are then directed to impact the sample surface for desorption and ionization. Compared to DESI, DAPCI shows similar results to DESI in those cases where electron attachment or protonation/deprotonation is the main ionization mechanism. Apart form abundant hydronium ions (e.g. H3O+) produced in the primary ions, high content of abundant radical water cations (e.g. H2O˙+) has been generated from corona discharge needle with high voltage applied for the modified DAPCI presented in this study, which significantly improves the ionization efficiency and desorption ability of DAPCI-MS for complex surface analysis, but without loss of the surface desorption ability by using liquid-assistance DAPCI-MS has been successfully used for rapid imaging of melamine in egg samples, with a spatial resolution of 250 μm.37 The optimal spatial resolution of DAPCI-MSI was estimated to be 140 μm for molecular images of questionable documents in forensic applications.38 Under the optimized ion source parameters and experiment conditions, the spatial resolution of DAPCI could even be optimized to be (58 ± 7) μm for detection of rhodamine 6G using PH test strips as carrier, with a limit of detection of 0.01 ng cm−2.39 Considerable valuable information about multiple lipid species is expect to obtain for direct ambient analysis of complex lung tissue samples in the native environments by using liquid-assisted DACI ionization.
In this study, differential diagnosis of human squamous cell lung carcinoma in untreated tissue sections was carried out by ambient mass spectrometry imaging using liquid-assisted surface desorption atmospheric pressure chemical ionization (DAPCI)32,33 combined with multivariate statistical analysis. DAPCI-MS images showing the spatial distributions of particular phosphatidylcholine (PC) and sphingomyelin (SM) species in the positive mode were compared to serial tissue sections stained with hematoxylin and eosin (H&E). The methods of multivariate statistical analysis were applied to biomarker discovery and lung cancer discrimination by reducing the high-dimensional mass spectral data, and multiple distinctive lipid species derived from 14 research subjects samples by PLS-LDA were used to visually characterize and formally classify human lung cancerous and adjacent normal tissue samples. The purpose of study is to demonstrate the feasibility of using DAPCI-MSI combined with multivariate statistical analysis for direct ambient analysis of complex heterogeneous lung tissue.
Materials and methods
Tissue collection and handling
This study was approved by the Medical Ethnics Committee in the Hospital Institutional Review Board of the Second Affiliated Hospital to Nanchang University, Nanchang, P. R. China. Signed informed consent was obtained from all fourteen patients in this study. All clinical investigations were conducted according to the principles expressed in the Declaration of Helsinki. The criteria for patient enrollment in this study were the diagnosis of non-small cell lung cancer confirmed by pathology, absence of accompanying malignancies, absence of other lung diseases, and no history of pre-operative chemotherapy or radiotherapy. In total, 13 male and 1 female patients enrolled in this study, with a median age of 61.8 (Table S1†). There are 12 moderately–differentiated patients and 2 poorly-differentiated patients. Every patient sample included two matched pairs, namely, cancer tissue (cancer) and adjacent normal lung tissue (≥5 cm away from the tumor; normal). All samples was sliced into several 10 μm-thick sections for mass spectrometry analysis and 6 μm-thick sections for hematoxylin&eosin (H&E) staining using a Leica CM1950 cryostat (Germany Leica), and were then individually sliced and mounted by hand onto the glass slides. Tissue orientation varied slightly between slides, and therefore H&E-stained optical images were rotated to match approximately the orientation of the DAPCI-MS images. All frozen tissue sections mounted onto the glass slides were stored in the Ultra-low temperature freezer (finnigan, San Jose, CA) at −80 °C, which were thawed to 4 °C and then dried about 15 minutes in a vacuum desiccators (Jing Hong Experimental Equipment Co., Ltd. Shanghai) prior to mass spectrometry analysis. The optical tissue images were scanned using an automatic pathology slice scanning system Sairui PRICICE500 series (UNIC Science and Technology Co., Ltd. Beijing) at a magnification of 200×. The morphology of tissue sections was evaluated on UNIC Digit pathology consulting system and the professional pathologist.The methanol (HPLC grade) was purchased from Tedia Company, Inc (OH Fairfield, U.S.) and the deionized water used was prepared with Thermo Scientific Barnstead Nanopure (Marietta, Ohio, USA).
DAPCI-MS imaging
DAPCI-MS imaging analysis of the lung tissues was performed in the positive ion modes on a commercial LTQ linear ion trap mass spectrometer (Thermo Fisher, USA) coupled with a home-made liquid-assisted DAPCI ion source mounted on a 2D surface moving stage (Fig. 1). A more detailed description of the configuration of the DAPCI ion source was provided in previous references.32–36 A certain proportion of methanol/water mixture solution (55![[thin space (1/6-em)]](https://www.rsc.org/images/entities/char_2009.gif) :45, v/v), infused through a fused silicon capillary (i.d. = 0.25 mm, o.d. = 0.40 mm) at a rate of 10 μL min−1, was nebulized by using a sheath gas flow to generate fine droplets, which were then efficiently charged by the corona discharge with 4 kV voltage. The charged droplets impacted the sample surface, followed by ionization of the analyte molecule by charge transfer and extraction of analytes on the surface into mass spectrometer for analysis at ambient conditions. No further optimization of the LTQ instrument was performed, and other parameters used in the experiment were the default values recommended by manufactory of the LTQ linear ion trap mass spectrometer.
:45, v/v), infused through a fused silicon capillary (i.d. = 0.25 mm, o.d. = 0.40 mm) at a rate of 10 μL min−1, was nebulized by using a sheath gas flow to generate fine droplets, which were then efficiently charged by the corona discharge with 4 kV voltage. The charged droplets impacted the sample surface, followed by ionization of the analyte molecule by charge transfer and extraction of analytes on the surface into mass spectrometer for analysis at ambient conditions. No further optimization of the LTQ instrument was performed, and other parameters used in the experiment were the default values recommended by manufactory of the LTQ linear ion trap mass spectrometer.
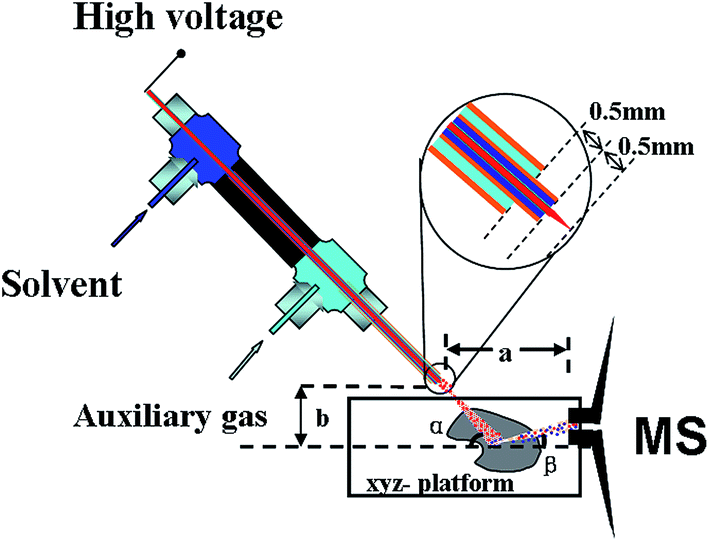 | ||
| Fig. 1 Schematic diagram of surface desorption atmospheric pressure chemical ionization imaging mass spectrometry (DAPCI-MSI). | ||
In the tissue DAPCI-MS imaging experiments, the tissue was scanned using a 2D moving stage in horizontal rows at a constant velocity of 74 μm s−1, separated by a 200 μm vertical step until the entire tissue sample had been assayed. The surface moving stage was controlled by stepper motor controller (SC series, Beijing Optical Century Instrument Co., Ltd). The spectra were acquired within the mass range m/z 50–1000 with Xcalibur 2.0 data processing system (finnigan, San Jose, A). The entire scanning size between the X-direction and Y-direction was 14 × 14 mm2. Three commercially available standard PCs ([PC (32:0) + Na]+) at m/z 756.5514, [PC(34:1) + K]+ at m/z 798.541, ([SM (16:0) + K]+) at m/z 741.5307, from (Sigma-Aldrich) with the DAPCI (home-made) were used for instrument calibration over the m/z range of 50–1000 in positive ion mode.
Data processing
All experiments were conducted using a LTQ linear ion trap mass spectrometer controlled by XCalibur 2.0 software (Thermo Fisher Scientific, San Jose, CA, USA). The Sufer® software (Golden Soft-ware, Inc. Colorado, USA) was applied to acquire DAPCI-MS images for displaying the spatial distribution of particular molecular species across the set of tissue samples. The same color scale was used within a set of ion images for a particular sample, and thus the 100% color shows the highest intensity for the most intense peak and other peaks are color scaled based on the relative intensity with respect to the most intense peak in the spectrum. Only ion species displaying an intensity of at least 5 times the blank value were taken into account, and data was collected with a resolving power of ∼200000 at m/z 798.5 and less than 1 ppm mass accuracy. Partial least-square linear discriminate analysis (PLS-LDA), developed in-house based on the Matlab (version 7.8.0, Mathworks, Inc., Natick, MA), was used for biomarker discovery by visualization and classification of 14 tissue pairs (28 tissue samples) using the full scan mass spectra data and Principal Component Analysis (PCA) was employed for comparison. Multiple distinctive lipid species between the tumor and non-tumor samples derived using PLS-LDA from massive mass spectral data were further confirmed by individual ion images, as compared to serial tissue sections stained with hematoxylin and eosin (H&E). The data were arranged using the m/z values as independent variables and using the relative abundance of the full-scan mass fingerprint as the dependent variables. All of the mass spectral data expressed in relative abundance were used for PLS-LDA analysis. Representative mass spectra were acquired for the training set from known tumor and adjacent normal regions each sample, excluding background regions of glass. These spectra were resample to unit resolution, background corrected and scaled to the median area under the curve prior to statistical analysis.
Results and discussion
Optimization of DAPCI conditions for lung tissue analysis
As demonstrated previously, the reason for successful application of DAPCI-MS to complex biological tissue analysis is mainly because of high density of the primary reagent ions generated by high voltage corona discharge in the DAPCI process, leading to high ionization sensitivity and enhanced desorption efficiency for trace detection of various molecules in complex matrices. To obtain better performance for such complicated heterogeneous human lung tissue, optimization of DAPCI conditions for soft lung tissue analysis were performed by optimizing the signal of the phosphatidylcholine [PC(34:1) + K]+(m/z 798.5) in the DAPCI-MS analysis experiment, which was one of the most intense and specific signals for the lung squamous-cell carcinoma samples under the positive ion mode. A piece of untreated lung tissue sections was mounted onto a clean and dry glass surface, which was then subjected to DAPCI-MS analysis without any pretreatment. As such, several parameters, which were directly associated with the performance of DAPCI-MS imaging, such as the pressure of the nebulising gas, solvent flow rate, the discharge needle voltage, source geometry, and capillary temperature, etc., were optimized for lung tissue detection.As shown in Fig. 2(a), the signal intensity of the peak at m/z 798.5 increases significantly along with the increase of proportion of methanol in solvent and a certain proportion of methanol and water mixture (55:45) was selected as the spray solvent. Fig. 2(b) shows the signal responses to the nitrogen gas pressure. Given the nebulizer gas pressure of 1.2 MPa, the flow rate of the spray solvent was optimized to be 3 μL min−1 (Fig. 2(c)) and the voltage of discharge needle loaded was selected as 4 kV (Fig. 2(d)), since a stable spray for highly ionizated efficiency was produced under these conditions. Fig. 3(a) displays the signal responses to the angles (α) formed between the discharge tip and the sample surface, and the maximal signal intensity was obtained at 50 °C. The discharge tip was positioned 1.2 mm and 5.5 mm from the lung tissue surface (Fig. 3(b)) and instrument inlet (Fig. 3(c)), respectively. The temperature of the heated capillary was optimized to be 270 °C, probably because this temperature kept much more radical cations products dissociation and thus improved the desolvation efficiency, as shown in Fig. 3(d). The default values for other working parameters of the LTQ-XL instrument were directly used as recommend by the manufacturer. The following measurements were carried out under the optimized conditions.
 | ||
| Fig. 2 Optimization of DAPCI source conditions for lung squamous cell carcinoma detection. (a) Effect of the proportion of methanol in solvent on the signal intensity of the peak at m/z 798.5; (b) effect of the pressure of nitrogen gas on the signal intensity of the peak at m/z 798.5; (c) effect of the flow rate extract solvent on the signal intensity of the peak at m/z 798.5; (d) effect of the discharge voltage on the signal intensity of the peak at m/z 798.5. | ||
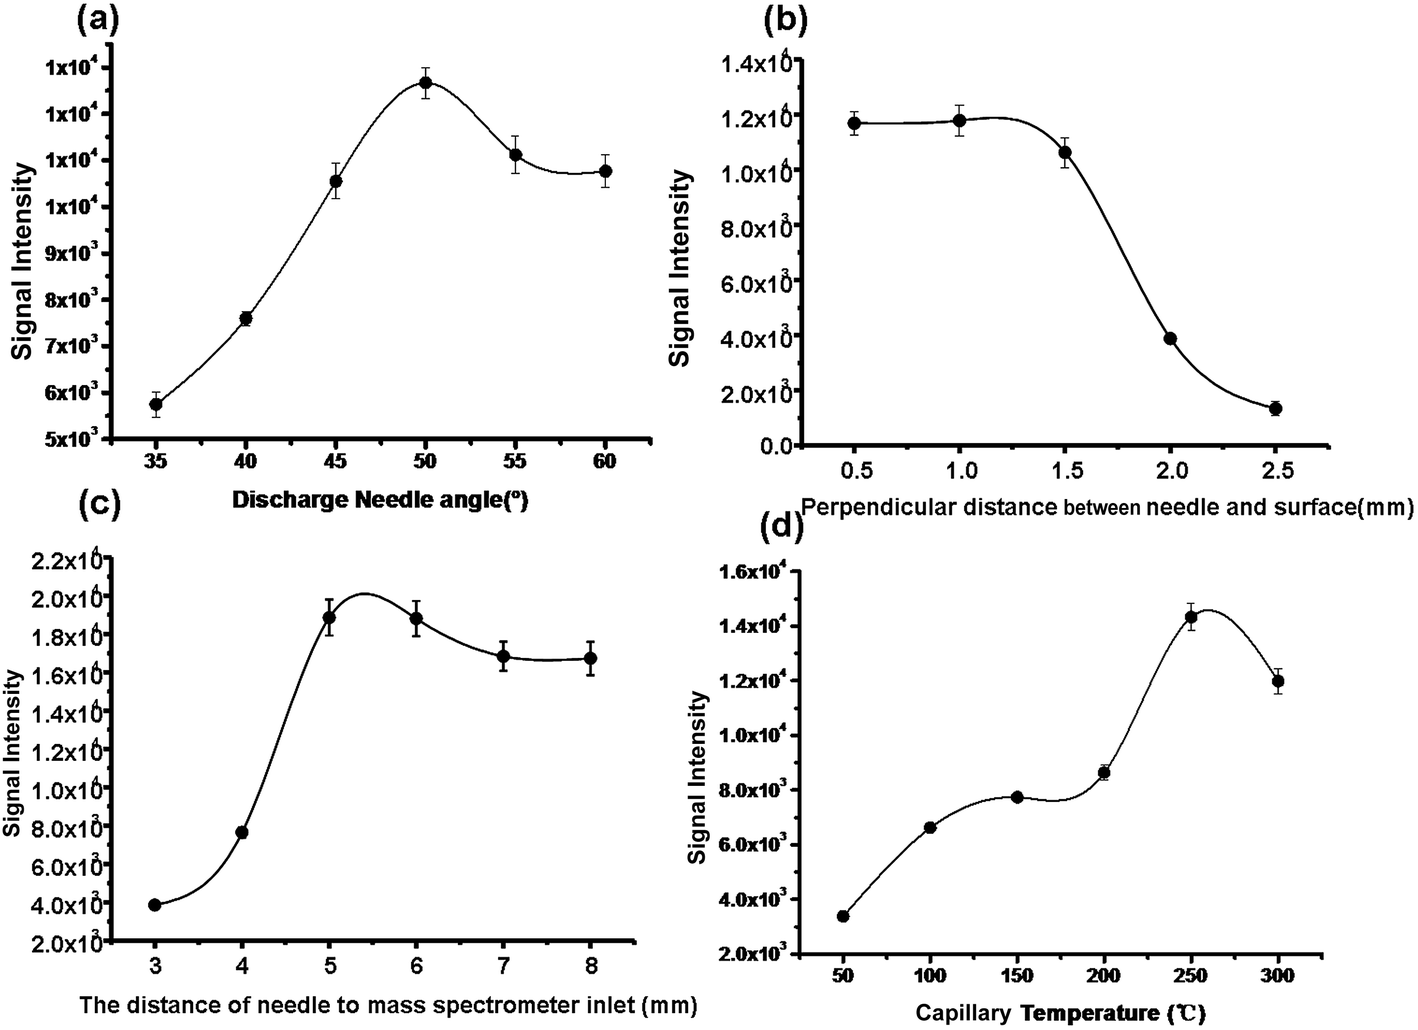 | ||
| Fig. 3 Optimization of DAPCI source geometry and capillary temperature for lung squamous cell carcinoma detection. (a) Effect of the angle between discharge needle and sample surface on the signal intensity of the peak at m/z 798.5; (b) effect of the perpendicular distance between the discharge needle and surface on the signal intensity of the peak at m/z 798.5; (c) effect of the discharge needle and mass spectrometer inlet on the signal intensity of the peak at m/z 798.5; (d) effect of the capillary temperature on the signal intensity of the peak at m/z 798.5. | ||
Lipids profiling in lung caner tissues using DAPCI-MSI
Lipids, particularly phospholipids (PLs), have played a critical role in cell functioning as the main building blocks of cellular membranes.40–44 Lipid distributions in cancerous tissues have demonstrated to vary in composition from adjacent normal tissue.40–43 Alterations in the phospholipids composition of tissues have been reported to a key signature for various certain cancer45,46 and Alzheimer's diseases.47 Determination of the spatial distribution of particular lipids in tissue sections has been demonstrated to be very important in tumor diagnosis and surgical resection.25,38 To investigate the effect of cancer-related lipids in tissue, DAPCI-MS imaging were performed for direct analysis of human lung tissues from fourteen different squamous cell lung carcinoma patients in the positive ion mode (Table S1†). As shown in Fig. 4(a) and (b), a representative full scan mass spectra of squamous cell carcinoma lung cancer and adjacent normal tissue from research subject A4 were recorded by DAPCI-MS, respectively, exhibiting clear differences within phosphatidylcholine (PC) and sphingomyelin (SM) profiles in terms of absolute abundances or relative intensities in the range of m/z 700 to m/z 1000. Similar trends were also observed in the remaining 13 tissue samples. Inset in the right above corresponds to the histological images of representative tissue regions with magnification 200×, respectively. Two representative mass spectra displayed here were the average mass spectrum recorded from tumor (Fig. 3(a)) and adjacent normal tissue regions for a tissue sample (Fig. 3(b)), respectively, which were both acquired after by subtraction of their background mass spectra, respectively. The lung tissue section used for DAPCI-MS imaging is the same as another used for standard histological examination, which was just one of two pieces of slices of the same tissue sample. | ||
| Fig. 4 Typical full scan positive ion mode mass spectra of human squamous cell carcinoma lung cancer tissue and adjacent normal tissue for A4 sample in the range of 50–1000 using DAPCI-MS. (a) Tumor tissue region (b) adjacent normal tissue area. The insets display the corresponding H&E-stained sections and the amplified figures (×200) showing different histopathological classes of lung tissues. The red box shown in H&E stained tissue sections corresponds to the area where the mass spectra were acquired from. | ||
Fig. 5(a)–(f) shows the representative ion images of DAPCI-MS for lung tissue sample of research subject A4 in the positive ion modes, with their individual corresponding H&E staining. A significantly improved spatial resolution of DAPCI-MS, 58 μm, can be acquired using the optimization experimental conditions.39 The optical image of an adjacent tissue section stained with H&E is presented along with the ion images. Pathological examination was performed on the H&E-stained section and morphological characteristics of the tissue sections were used for disease status diagnosis. As seen from Fig. 5, the spatial distribution of these distinctive lipid ions between the tumor and adjacent normal region has been clearly displayed and profiled across the whole lung tissue sample under ambient conditions. An increased absolution intensities of phosphatidylcholine (PC) species at m/z 798.5 ([PC (34:1) + K]+), m/z 782.6 ([PC (34:1) + Na]+), and sphingomyelin (SM) species at m/z 725.6 ([SM (16:0) + Na]+), m/z 741.6 ([SM (16:0) + K]+) were recorded in lung cancerous regions with respect to those in the adjacent normal areas, whereas a significantly decreased intensities of PC ions at m/z 756.6 ([PC (32:0) + Na]+), m/z 772.5 ([PC (32:0) + K]+) were observed in the cancerous area compared to those in the adjacent normal area. The phospholipids appear as potassium or sodium adducts form as a result of endogenous potassium or sodium in the tissue. All images are plotted with the same intensity scale. These images can be visually compared to the results of H&E-stained tissue sections. The presence of these signatures has been further confirmed by collision-induced dissociation (CID) tandem MS experiments (Fig. S1†), and the major loss from precursor ions in CID experiment correspond to the neutral fragments of N-(CH3)3 and C5H14O4P almost for all species in this study, which were in agreement with the previous observations.46
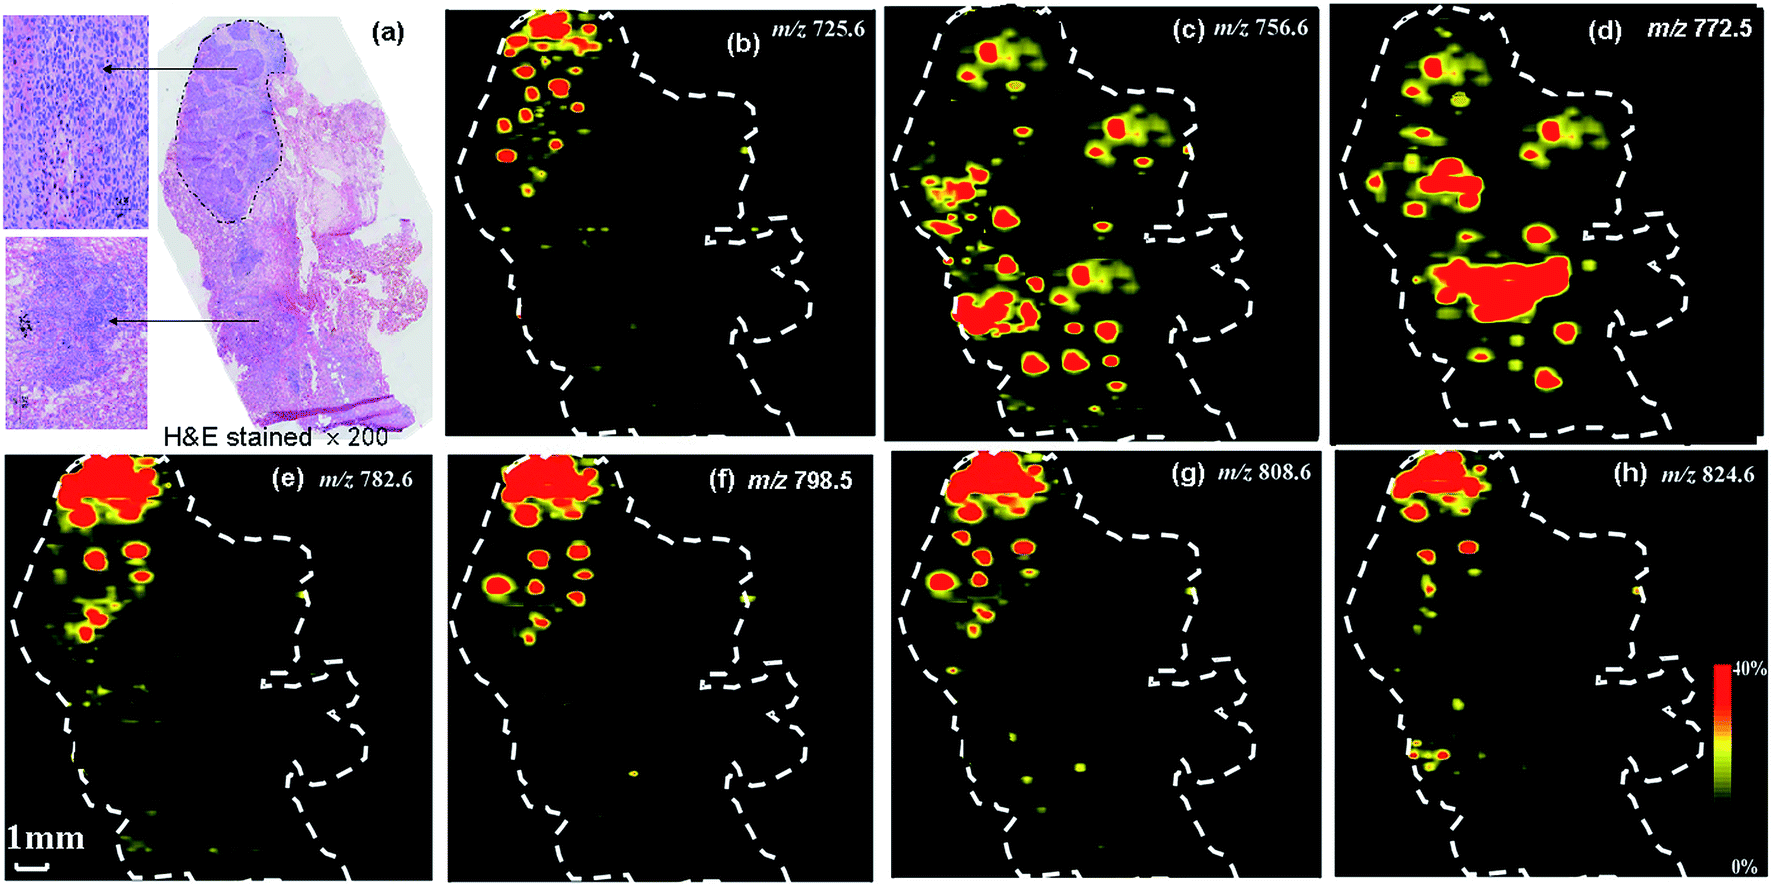 | ||
| Fig. 5 DAPCI-MS images of potential biomarkers using multivariate statistical analyses for the research subject A4 tissue section showing the spatial distributions of ions at (b) m/z 725.6 [SM(16:0) + Na]+, (c) m/z 756.6 [PC(32:0) + Na]+, (d) m/z 772.5 [PC(32:0) + K]+, (e) m/z 782.6 [PC(34:1) + Na]+ (f) m/z 798.5 [PC(34:1) + K]+, (g) m/z 808.6 [PC(36:2) + Na]+, and (h) m/z 824.6 [PC(36:2) + K]+ (a) light microscopy images of the H&E-stained sections are shown (scale bars). | ||
Therefore, cancerous and adjacent normal tissue could be unambiguously distinguished based on these individual DAPCI-MS ion images at molecular level. The high abundances of PC species observed in tumor from the DAPCI-MS images may probably be characteristic markers for differentiation of tumor from adjacent normal tissue, whereas the elevated levels of sphingomyelins (SMs) species for [SM (16:0) + Na]+ (m/z 725.6) and [SM (16:0) + K]+ (m/z 741.6) observed in the cancerous regions of tissue as comparison to adjacent normal section may probably be associated with malignant transformations in cancer cells.45–47 This has implications for the underlying biochemistry of sphingomyelin metabolism in adenocarcinomas. These distinctive lipid species profiled by DAPCI-MSI may be served as potential biomarkers or prognostic variables for human lung caner diagnosis and tumor margin identification, showing that DAPCI-MSI is an effective method for rapidly mapping lipid distributions on such complicated heterogeneous soft lung tissue surface and display excellent histological specificity and tissue classification.
Differentiation of tumor from adjacent normal tissue by multivariate statistical analysis
Although the tumor can be differentiated from adjacent normal tissue simply by visualizing these individual distinctive peaks mentioned above, multiple important variables in terms of disease-related information can not easily be obtained when the absolute or relative intensity differences of the ions between the tumor and normal tissue are not evident. Moreover, the use of multiple potential biomarkers for improving the strength of disease diagnosis highlights the need for multivariate statistical analysis. As such, multivariate statistical analysis was performed to increase the accuracy of the evaluation by reducing the high-dimensional data. Most lipid species were derived from massive mass spectral data of 14 research subjects by formal classification of cancerous and adjacent normal tissue samples using partial least-square linear discriminate analysis (PLS-LDA) and Principal Component Analysis (PCA) was used for comparison. A set of fourteen tissue samples was randomly divided two seven-sample-one a training set, used to develop the predictive models, the second a validation set, used to test the predictive accuracy of the methodology. The spectra of the training set were recorded from known tumor and adjacent normal regions of the tissue samples, as determined by pathological examination. Thus, 35 mass spectra in the cancerous area and the adjacent normal area at 35 different positions, respectively, were acquired for each tissue section, leading to a total of 245 representative individual spectra data from tumor and corresponding adjacent normal tissue positions, respectively, in the training set for multivariate statistical analysis, excluding the background regions of glass.Fig. 6(a)–(c) shows the score plots for the first three components for PLS-LDA of the training set. A good separation between tumor and adjacent normal tissues was observed in the first and second components, implying that the first two components carry sufficient disease-related information. A PLS-LDA model with five components achieves the best prediction performance (tenfold cross-validation R2 = 0.974), and produces a cross-validation error rate of 0.41% for classification of tumor from normal samples. This model was then applied to another seven tissue samples in the validation set and a misclassification error rate of 2.16% was obtained.
 | ||
| Fig. 6 PLS-LDA analysis of squamous cell lung carcinoma and adjacent normal tissues. (a–c) Score plots for the first three components for PLS-LDA of the training set. The axes PLS1, PLS2, and PLS3 correspond respectively to the scores of the first three components for each sample after applying PLS. (d–f) Loading plots for the first three components in PLS-LDA from the training set. The plots for the first three components in PLS-LDA from the training set. The plots illustrate the m/z values and their relative importance in the PLS-LDA analysis. | ||
The emergence of ambient mass spectrometry has extended the application of mass spectrometry to ordinary samples in the ambient environment, but meanwhile this enables the mass spectra much more difficult to interpretation, especially for the biological tissue sample analysis in this study. Thus, how to accurate and fast extract important chemical information from high-dimensional mass data is a key step for biomarker compounds search and following mass spectrometry imaging. Some phosphatidylcholine and sphingomylein species with very low abundances of molecular ions but carrying valuable information about tissue sample have been acquired by differentiation of lung cancer from normal tissue using multivariate statistical analysis. As shown in Fig. 6(d) and (e), besides these prominent peaks, some important variables with relative low intensity, such as m/z 808.6 ([PC (36:2) + Na]+), m/z 810.6 ([PC (36:1) + Na]+), m/z 824.6 ([PC(36:2) + K]+), m/z 834.6 ([PC(38:3) + Na]+), m/z 848.6 ([PC(38:4) + K]+), m/z 104.1 (C5H14NO+), m/z 175.2, and m/z 184.2, which also mainly contributes to the separation of cancerous and normal tissues even with small differences, can also be acquired from the loading plot of the first and second components. Particularly, the increased levels of choline (C5H14NO+) first observed in the cancerous tissue compared to adjacent normal region in this study provides a specific non-invasive biomarker of transformation, staging and response to therapy for lung cancer, which has demonstrated to be associated with oncogenesis and tumor progression.48–52 It can be seen from the observed characteristic fragments produced in CID experiments (Fig. S1(g) and (f)†), the lipid species at m/z 175.2 and m/z 184.2 may probably be assigned to protonated arginine (C6H15N4O2+)53 and phosphocholine molecule (C5H15NO4P+),54 repectively. These are identified by tandem mass spectrometry (Fig. S1†) and previous literature studies,46 which could be the signature compounds and has the largest possibility used as potential biomarker compounds for identifying and differentiating tumor regions from adjacent normal tissue sections.
To further test the ionization and desorption ability of DAPCI for heterogeneous tissue sample, the discrimination between cancerous area and adjacent normal regions for single tissue section was also successfully achieved using Principal Component Analysis (PCA). As shown in Fig. S2(a),† PCA showed a clear classification between tumor area and adjacent tissue region, which is consistent with optical images of histopathological staining, further demonstrating the high ionization efficiency and strong desorption ability of ambient corona discharge ionization for complex biological tissues analysis. The PCA loadings results for the PCs are also consistent with those obtained from PLS-LDA (Fig. 6(d) and (e)). All analyzed tissue samples in the present are from fourteen patients who have been diagnosed as squamous cell carcinoma lung cancer (Table S1†).
Determination of the distribution of marker molecules, such as phospholipids and sphingomyelins, has played a critical role in biological tissues analysis, because considerable valuable information on the disease status of a tissue.42–46,55,56 A significant increase in multiple phosphatidylcholines (PCs) and a decrease in several specific sphingomyelins (SMs) were observed from tumor to adjacent normal tissue particularly, enhanced levels of choline (C5H14NO+) first observed in the cancerous tissue with respect to noncancerous tissue further demonstrates the high detection efficiency of DAPCI-MS. Compared with the results from ESI,57 an significant increase in multiple phosphatidylcholines (PCs) with protonated ionization formation (e.g., [PC(34:1) + H]+ and [PC (36:2) + H]+) and phosphatidylinositols (PIs) were also observed, while an decrease in protonated sphingomyelins (SMs) (e.g., [SM(34:1) + H]+, [SM(42:2) + H]+) and phosphatidylserines (PSs) were detected in lung cancer tissues compared to normal tissues. On the contrast, an increased of PC classes such as m/z 782.6 ([PC (34:1) + Na]+) m/z 754.5 ([PC(32:1) + Na]+), and m/z 824.6 ([PC(36:2) + K]+), and m/z 725.5 SM([(34:1) + Na]+) were detected in the MALDI-Fourier transform ion cyclotron resonance mass spectrometry (MALDI-FTICR MS), the potassium or sodium adducts form mechanism of which is the same as the result of this study.46,58 Different formations of these ions produced are contributed to the different main ionization mechanisms of ESI and DAPCI, which are complementary for compounds identification and potential biomarkers discovery.
These acquired distinctive lipid species could probably be served as potential biomarker after further validated by individual DAPCI-MS ions images (Fig. S3†), as comparison with the optically scanned images of the H&E-stained sections analyzed by the pathologist. This demonstrates that multivariate statistical analysis played an important role in distinguishing lung cancer and adjacent normal tissue when the differences between the tissues were not evident from the comparable full scan mass spectral data, providing a much more effective tool for biomarker discovery and disease diagnosis from massive high-dimensional mass spectra data for ambient mass spectrometry analysis of complicated tissue samples.
Conclusions
This study demonstrates the feasibility of the application of DAPCI-MSI, combined with the methods of multivariate statistical analysis, for direct analysis of complex tissue lung samples under ambient conditions without any sample pretreatment. DAPCI-MS imaging shows great promise as a molecular pathology technique that uses the PC and SM profiles of tissues to visualize and differentiate cancerous from normal tissue, and the use of multivariate statistical analysis significantly increases the confidence of this diagnosis through data interpretation. Multivariate statistical analysis played an important role in biomarker discovery and differentiation of tumor from adjacent normal tissue when the differences of ion intensity between the tissues were not evident, highlighting the need for the use of multivariate statistical analyses for biomarker discovery and following MS imaging by reducing the high-dimensional mass spectral data. The capability of DAPCI-MSI in providing much valuable spatial information about specific molecules on the tissue surface further demonstrates the enhanced ionization efficiency of liquid-assisted DAPCI technique due to high density of the primary reagent ions generated through the high voltage corona discharge, without loss of the ability of surface desorption. The DAPCI-MSI developed here offers great improvements in complex biological tissue analysis that can lead to a better understanding of biological systems and diseases diagnosis, due to high density of the primary reagent ions generated through the high voltage corona discharge. The most prominent changes of multiple PC and SM species as well as the choline (C5H14NO+) composition from lung tumor to normal tissue were found to the key signatures for chemical characterization of squamous cell carcinoma lung cancer, probably served as prognostic variables in lung cancerous and non-cancerous tissues.Conflicts of interest
There are no conflicts to declare.Acknowledgements
This work was supported by grants from the National Natural Science Foundation of China (No. 21405013).References
- B. A. Chan and B. G. M. Hughes, Transl. Lung Cancer Res., 2015, 4, 36–54 CAS.
- Ö. Birima, A. P. Kappeteina, R. J. van Klaveren and A. J. J. C. Bogers, Eur. J. Surg. Oncol., 2006, 32, 12–23 CrossRef PubMed.
- J. R. Molina, P. Yang, S. D. Cassivi, S. E. Schild and A. A. Adjei, Mayo Clin. Proc., 2008, 83, 584–594 CrossRef PubMed.
- M. Reck, D. F. Heigener, T. Mok, J. C. Soria and K. F. Rabe, Lancet, 2013, 382, 709–719 CrossRef CAS.
- J. K. Field, D. M. Hansell, S. W. Duffy and D. R. Baldwin, Lancet, 2013, 14, e591–e600 CrossRef PubMed.
- E. J. R. van Beek, S. Mirsadraee and J. T. Murchison, World J. Radiol., 2015, 7, 189–193 CrossRef PubMed.
- E. M. Toloza, L. Harpole and D. C. McCrory, Chest, 2003, 1, 137S–146S CrossRef.
- M. A. Farrell, H. P. McAdams, J. E. Herndon and E. F. Patz Jr, Radiology, 2000, 215, 886–890 CrossRef CAS PubMed.
- R. R. Edelman, H. Hatabu, E. Tadamura, W. Li and P. V. Prasad, Nat. Med., 1996, 2, 1236–1239 CrossRef CAS PubMed.
- R. Yi, N. W. Todd, Q. Qiu, T. Fan, R. Y. Zhao, W. H. Rodgers, H. B. Fang, R. L. Katz, S. A. Stass and F. Jiang, Clin. Cancer Res., 2007, 13, 482–487 CrossRef PubMed.
- J. Lu, G. Getz, E. A. Miska, E. Alvarez-Saavedra, J. Lamb, D. Peck, A. Sweet-Cordero, B. L. Ebert, R. H. Mak, A. A. Ferrando, J. R. Downing, T. Jacks, H. R. Horvitz and T. R. Golub, Nature, 2005, 435, 834–838 CrossRef CAS PubMed.
- M. Raponi, L. Dossey, T. Jatkoe, X. Wu, G. Chen, H. Fan and D. G. Beer, Cancer Res., 2009, 69, 5776–5783 CrossRef CAS PubMed.
- Y. Xie, N. W. Todd, Z. Liu, H. B. Fang, M. Alattar, J. Deepak, S. A. Stass and F. Jiang, Lung Cancer, 2010, 67, 170–176 CrossRef PubMed.
- C. Wang, M. Ding, M. Xia, S. Chen, A. Van Le, R. Soto-Gil, Y. Shen, N. Wang, J. Wang, X. Wang, Y. Zhang, K. Zen, X. Chen, C. Zhang and C. Y. Zhang, EBioMedicine, 2015, 2, 1377–1385 CrossRef PubMed.
- N. Yanaihara, N. Caplen, E. Bowman, M. Seike, K. Kumamoto, M. Li, R. M. Stephens, A. Okamoto, J. Yokota, T. Tanaka, G. Calin, C. G. Liu, C. M. Croce and C. C. Harris, Cancer Cell, 2006, 9, 189–198 CrossRef CAS PubMed.
- R. E. Nakhleh, Arch. Pathol. Lab. Med., 2011, 135, 1394–1397 CrossRef PubMed.
- X. Xu, J. H. Chung, S. Jheon, S. W. Sung, C. T. Lee, J. H. Lee and G. Choe, J. Thorac. Oncol., 2010, 5, 39–44 CrossRef PubMed.
- Y. Wei, L. Chen, W. Zhou, K. Chingin, Y. Ouyang, T. Zhu, H. Wen, J. Ding, J. J. Xu and H. Chen, Sci. Rep., 2015, 5, 1–7 Search PubMed.
- K. Chughtai and R. M. A. Heeren, Chem. Rev., 2010, 110, 3237–3277 CrossRef CAS PubMed.
- R. G. Cooks, Z. Ouyang, Z. Takats and J. M. Wiseman, Science, 2006, 311, 1566–1570 CrossRef CAS PubMed.
- J. M. Wiseman, D. R. Ifa, Q. Song and R. G. Cooks, Angew. Chem., Int. Ed., 2006, 45, 7188–7192 CrossRef CAS PubMed.
- L. S. Eberlin, D. R. Ifa, C. Wu and R. G. Cooks, Angew. Chem., Int. Ed., 2010, 49, 873–876 CrossRef CAS PubMed.
- J. Laskin, B. S. Heath, P. J. Roach, L. Cazares and O. J. Semmes, Anal. Chem., 2012, 84, 141–148 CrossRef CAS PubMed.
- I. Lanekoff, M. Thomas, J. P. Carson, J. N. Smith, C. Timchalk and J. Laskin, Anal. Chem., 2013, 85, 882–889 CrossRef CAS PubMed.
- L. S. Eberlin, I. Norton, D. Orringer, I. F. Dunn, X. Liu, J. L. Ide, A. K. Jarmusch, K. L. Ligon, F. A. Jolesz, A. J. Golby, S. Santagata, N. Y. R. Agar and R. G. Cooks, Proc. Natl. Acad. Sci. U. S. A., 2013, 110, 1611–1616 CrossRef PubMed.
- L. S. Eberlin, A. L. Dill, A. J. Golby, K. L. Ligon, J. M. Wiseman, R. G. Cooks and N. Y. R. Agae, Angew. Chem., Int. Ed., 2010, 49, 5953–5956 CrossRef CAS PubMed.
- J. M. Wiseman, S. M. Puolitaival, Z. Takats, R. G. Cooks and R. M. Caprioli, Angew. Chem., Int. Ed., 2005, 117, 7256–7259 CrossRef.
- D. Calligaris, D. Caragacianu, X. Liu, I. Norton, C. J. Thompson, A. L. Richardson, M. Golshanc, M. L. Easterlingd, S. Santagata, D. A. Dillone, F. A. Joleszb and N. Y. R. Agar, Proc. Natl. Acad. Sci. U. S. A., 2014, 111, 15184–15189 CrossRef CAS PubMed.
- E. H. Seeley and R. M. Caprioli, Proc. Natl. Acad. Sci. U. S. A., 2008, 105, 18126–18131 CrossRef CAS PubMed.
- B. Feng, J. Zhang, C. Chang, P. Li, X. Xiong, C. Guo, F. Tang, Y. Bai and H. Liu, Anal. Chem., 2014, 86, 4164–4169 CrossRef CAS PubMed.
- T. Li, J. He, X. Mao, Y. Bi, Z. Luo, C. Guo, F. Tang, X. Xu, X. Wang, M. Wang, J. Chen and Z. Abliz, Sci. Rep., 2015, 5, 14089 CrossRef CAS PubMed.
- Z. Takáts, I. Cotte-Rodriguez, N. Talaty, H. W. Chen and R. G. Cooks, Chem. Commun., 2005, 1950–1952 RSC.
- Z. C. Wu, H. W. Chen, W. L. Wang, B. Jia, T. L. Yang, Z. F. Zhao, J. H. Ding and X. X. Xiao, J. Agric. Food Chem., 2009, 57, 9356–9364 CrossRef CAS PubMed.
- S. P. Yang, J. H. Ding, J. Zheng, B. Hu, J. Q. Li, H. W. Chen, Z. Q. Zhou and X. L. Qiao, Anal. Chem., 2009, 81, 2426–2436 CrossRef CAS PubMed.
- K. Chingin, J. Liang, Y. Liu, L. Chen, X. Wu, L. Hu and Y. Z. Ouyang, RSC Adv., 2016, 6, 59749–59752 RSC.
- D. Huang, L. Luo, C. Jiang, J. Han, J. Wang, T. Zhang, J. Jiang, Z. Zhou and H. W. Chen, J. Agric. Food Chem., 2011, 59, 2148–2156 CrossRef CAS PubMed.
- S. P. Yang, H. W. Chen, Y. L. Yang, B. Hu, X. Zhang, Y. F. Zhou, L. L. Zhang and H. W. Gu, Chin. J. Anal. Chem., 2009, 37, 315–318 CAS.
- M. Li, B. Jia, L. Ding, F. Hong, Y. Ouyang, R. Chen, S. Zhou, H. W. Chen and X. Fang, J. Mass Spectrom., 2013, 48, 1042–1049 CrossRef CAS PubMed.
- X. X. Li, L. F. Chen, Y. Z. Ouyang, F. Fang and H. W. Chen, Chin. J. Anal. Chem., 2016, 44, 25–31 CAS.
- E. Marien, M. Meister, T. Muley, S. Fieuws, S. Bordel, R. Derua, J. Spraggins, R. V. Plas, J. Dehairs, J. Wouters, M. Bagadi, H. Dienemann, M. Thomas, P. A. Schnabel, R. M. Caprioli, E. Waelkens and J. V. Swinnen, Int. J. Cancer, 2015, 137, 1539–1548 CrossRef CAS PubMed.
- E. Marien, M. Meister, T. Muley, T. G. Pulgar, R. Derua, J. M. Spraggins, R. V. Plas, F. Vanderhoydonc, J. Machiels, M. M. Binda, J. Dehairs, J. Willette-Brown, Y. Hu, H. Dienemann, M. Thomas, P. A. Schnabel, R. M. Caprioli, J. C. Lacal, E. Waelkens and J. V. Swinnen, Oncotarget, 2016, 7, 12582–12597 Search PubMed.
- F. Perrotti, C. Rosa, I. Cicalini, P. Sacchetta, P. D. Boccio, D. Genovesi and D. Pieragostino, Int. J. Mol. Sci., 2016, 17, 1992 CrossRef PubMed.
- R. Bandu, H. J. Mok and K. P. Kim, Mass Spectrom. Rev., 2016 DOI:10.1002/mas.21510.
- P. T. Ivanova, B. A. Cerda, D. M. Horn, J. S. Cohen, F. W. McLafferty and H. A. Brown, Proc. Natl. Acad. Sci. U. S. A., 2001, 98, 7152–7157 CrossRef CAS PubMed.
- K. Glunde, C. Jie and Z. M. Bhujwalla, Cancer Res., 2004, 64, 4270–4275 CrossRef CAS PubMed.
- S. Guo, Y. Wang, D. Zhou and Z. Li, Sci. Rep., 2014, 4, 5959 CrossRef CAS PubMed.
- T. J. Montine, M. D. Neely, J. F. Quinn, M. F. Beal, W. R. Markesbery, L. J. Roberts and J. D. Morrow, Free Radical Biol. Med., 2002, 33, 620–626 CrossRef CAS PubMed.
- K. Glunde, Z. M. Bhujwalla and S. M. Ronen, Nat. Rev. Cancer, 2011, 11, 835–848 CAS.
- Q. Zeng, H. Liu, K. Zhang, C. Li and G. Zhou, Magn. Reson. Imaging, 2011, 29, 25–31 CrossRef PubMed.
- T. R. McKnight, K. R. Lamborn, T. D. Love, M. S. Berger, S. Chang, W. P. Dillon, A. Bollen and S. J. Nelson, J. Neurosurg., 2007, 106, 660–666 CrossRef CAS PubMed.
- C. F. Chuang, A. A. Chan, D. Larson, L. J. Verhey, M. McDermott, S. J. Nelson and A. Pirzkall, Technol. Cancer Res. Treat., 2007, 6, 375–382 CrossRef PubMed.
- J. H. Chen, R. S. Mehta, H. M. Baek, K. Nie, H. Liu, M. Q. Lin, H. J. Yu, O. Nalcioglu and M. Y. Su, NMR Biomed., 2011, 24, 316–324 CrossRef CAS PubMed.
- N. Xu, Z. Q. Zhu, S. P. Yang, J. Wang, H. W. Gu, Z. Zhou and H. W. Chen, Chin. J. Anal. Chem., 2013, 41, 523–528 CrossRef CAS.
- J. M. McMahon, R. T. Short, C. A. McCandlish, J. T. Brenna and P. J. Todd, Rapid Commun. Mass Spectrom., 1996, 10, 335–340 CrossRef CAS PubMed.
- L. D. Bergelson and L. I. Barsukov, Science, 1977, 197, 224–230 CAS.
- Y. Zhang, P. Liu, Y. Li and A. H. Zhang, RSC Adv., 2017, 7, 6780–6787 RSC.
- E. Marien, M. Meister, T. Muley, S. Fieuws, S. Bordel, R. Derua, J. Spraggins, R. V. D. Plas, J. Dehairs, J. Wouters, M. Bagadi, H. Dienemann, M. Thomas, P. A. Schnabel, R. M. Caprioli, E. Waelkens and J. V. Swinnen, Int. J. Cancer, 2015, 137, 1539–1548 CrossRef CAS PubMed.
- M. He, S. Guo, J. Ren and Z. Li, J. Cancer, 2016, 7, 810–816 CrossRef PubMed.
Footnote |
| † Electronic supplementary information (ESI) available. See DOI: 10.1039/c7ra11839b |
| This journal is © The Royal Society of Chemistry 2017 |