
 Open Access Article
 This Open Access Article is licensed under a Creative Commons Attribution-Non Commercial 3.0 Unported Licence
Hydrothermal synthesis of Ba3Sc2F12:Yb3+, Ln3+ (Ln = Er, Ho, Tm) crystals and their up conversion white light emission†
Wei Wang a,
Yunxi Lia,
Shanshan Hu*a,
Xuemei Zhanga,
Jianfeng Tangb and
Jun Yang*a
a,
Yunxi Lia,
Shanshan Hu*a,
Xuemei Zhanga,
Jianfeng Tangb and
Jun Yang*a
aSchool of Chemistry and Chemical Engineering, Southwest University, Chongqing, 400715, China. E-mail: jyang@swu.edu.cn; hushan3@swu.edu.cn
bFaculty of Materials and Energy, Southwest University, Chongqing, 400715, China
First published on 12th December 2017
Abstract
Ba3Sc2F12:Yb3+, Ln3+ (Ln = Er, Ho, Tm) crystals with various morphologies have been synthesized via a one step hydrothermal route. X-ray diffraction (XRD), scanning electron microscopy (SEM), and up conversion photoluminescence (UCPL) spectra were used to characterize the samples. The influences of surfactants, pH values, and molar ratio of F−/Sc3+ on the crystal phase, size and shape of final products have been studied in detail. The aspect ratio of products increased gradually with the increase of F−/Sc3+ molar ratio. Additionally, the luminescence properties of Ba3Sc2F12:Yb3+, Ln3+ (Ln = Er, Ho, Tm) crystals were systematically studied. The blue emission is attributed to the 1G4 → 3H6 transition of Tm3+; the green emission can be obtained due to the 2H11/2/4S3/2 → 4I15/2 transitions of Er3+ and the 5S2/5F4 → 5I8 transition of Ho3+; the red emission comes from the 4F9/2 → 4I15/2 transition of Er3+ and the 1G4 → 3F4 transition of Tm3+. Based on the generation of red, green, and blue emissions in the different Ln ion-doped Ba3Sc2F12, the white light emission can be obtained by appropriately doping Yb3+, Er3+, and Tm3+ in the present Ba3Sc2F12 crystals due to the color superposition principle. Here, the sample Ba3Sc1.5856F12:0.4Yb3+, 0.01Er3+, 0.0044Tm3+ crystals showed suitable intensity ratio of blue, green and red (RGB) emissions resulting in bright white light with CIE-x = 0.274 and CIE-y = 0.287, which was illustrated by a photograph under excitation of 980 nm. The prepared Ba3Sc2F12:Ln3+ phosphor has potential applications in the fields of three dimensional displays, back lighting and white light sources.
1. Introduction
Luminescent functional materials have been developed for use in the fields of up-conversion luminescence bioimaging,1 photodynamic therapy2 and sensing device for antioxidants,3 such as organic dyes,4 metal complexes,5–9 metal nanoparticles,10 semiconductors11 and lanthanide-doped inorganic phosphors.12,13 Most of these ordinary compounds display luminescent emission with a Stokes shift which generates low-energy photons under excitation of high-energy photons; but few processes observe the opposite rule to produce up conversion (UC) photoluminescence with an anti-Stokes shift. The general principle of up the conversion luminescence process can be described as the ground state of the luminescent center absorbing a low-energy photon or being excited to the excited state by a corresponding energy transfer (ET) process, then another low-energy photon is absorbed or an ET process promotes electrons to reach a higher excited state, finally the electrons return to the ground state with emission of high-energy photons. As far as we know, the up conversion luminescence process of lanthanide ions should rely on their rich 4f-electron configuration with abundant energy levels. Lanthanide-doped materials show excellent up conversion luminescence properties including large anti-Stokes shift, long up conversion luminescence lifetime (∼ms), sharp lines of emission, low excitation energy (980 nm) and great photostability.14 In order to minimize the nonradiative loss and maximize the emitted radiation, the desirable host lattice materials should have low phonon energy. This is because the high phonon energy in the host lattice will promote nonradiative energy loss. Oxide exhibits high chemical stability, but their phonon energies are relatively high (>500 cm−1). In contrast, fluoride generally exhibits high chemical stability and low phonon energy (∼500 cm−1). Therefore, the fluoride is often used as host material for up conversion process.15To date, various UC matrix materials have been investigated, such as lanthanide oxides,16,17 fluorides,18–21 molybdates22 and vanadates.23 In recent years, many efforts have been made to synthesize Y/Ln (Ln = La, Ce, Pr, Nd, Sm, Eu, Gd, Tb, Dy, Ho, Er, Tm, Yb and Lu)-based fluorides with controllable crystal phase, shape and size. Nevertheless, Sc-based fluorides hosts have been neglected.24–28 As we all know, the up conversion luminescence depends on the distance between the doped rare earth ions in host lattice. Compared to Y/Ln-based fluorides, Sc-based fluoride is particular because of its atomic electron configuration and smaller ion radius. Thus, the Er3+–Yb3+ cation pair is closer in the Sc-based fluoride, which is more effective for energy transfer from Yb3+ to Er3+ ion.29 The BaLnF (Ln = Y, La, Ce, Pr, Nd, Sm, Eu, Gd, Tb, Dy, Ho, Er, Tm, Yb and Lu) family has been greatly enriched in recent years.30–37 Moreover, Lin's group reported that the three-doped BaYF5:Yb, Er, Tm nanoparticles with tunable color upconversion luminescence including the white light;30 Anthony K. Cheetham and co-operator reported that efficient white light emission by doping Yb3+, Er3+ and Tm3+ ions in Y2BaZnO5 host;38 our group also reported that the Sr2ScF7:Yb3+, Er3+, Tm3+ nanoparticles were successfully prepared to obtain white light emission.39 On the other hand, Fedorov's group reported that the Ba3Sc2F12 was synthesized using coprecipitation from aqueous solutions;40 Qnacton's group reported that the Ba3Sc2F12 was obtained by solid-state method and its structure and unit cell parameters were studied.41 A method to prepare single phase Ba3Sc2F12 powders was proposed in these two reports, but there was no discussion about the luminescent properties of Ba3Sc2F12, especially no UC white light emission.
High temperature solid state method, thermal decomposition, and hydro(solvo)-thermal synthesis are nowadays the three most common routes to prepare RE-based fluorides. The high temperature solid state method is favorable for synthesis of RE-based fluorides compared with the thermal decomposition that requires very toxic fluorinated and oxy-fluorinated carbon species. Although high-quality of RE-based fluorides can be realized in the high temperature solid state method, but it also has some disadvantages including complicated experimental condition, tedious procedure and high reaction temperature. Additionally, the hydro(solvo)-thermal method is more suitable to prepare highly crystalline fluorides nanomaterials under relatively mild condition.28,42–44
Compared with the traditional high temperature solid state reaction route, the hydrothermal synthesis of UC fluorides has the advantage of controlled morphology and size, but it loses the high emission efficiency due to the high concentration defects and OH−. In the past decade, many approaches have been reported to increase the UC emission efficiency of lanthanide-doped nanoparticles, for example, using noble metal nanocrystal plasma,45 photonic crystal effect,46 surface coating through core–shell structure47 and ion-exchange modified hydrothermal method.48–50
The Yb3+ ions have a larger near infrared (NIR) absorption cross section, which act as an excellent sensitizer codoped with Er3+ or Ho3+ or Tm3+ ions and result in strong red or green or blue UC emissions. Richards' group report near-infrared-to-visible La2O3:Yb3+, Er3+ (LYE) UC materials with a high internal quantum yield (UCQY) of 3.8%, external UCQY (brightness) of 1.6% and tunable emission color.51 B. S. Richards52 and partners respectively discuss the optical property of Yb3+/Er3+, Yb3+/Tm3+ and Yb3+/Ho3+. As we all know, UC white light in displays, back lighting and general lighting alternatives have a wide range of applications because it is compact, cheap and power-rich. In order to achieve a combination of RGB emissions in a single inorganic phosphor, it is possible to incorporate Er3+, Tm3+, Ho3+ and Yb3+ ions into the host material, which is one of the most effective methods to obtaining UC white light.53–55
In our report, we prepared Ba3Sc2F12 crystal by hydrothermal method under mild condition, and researched the effects of surfactants and pH value on the phase and morphology. Furthermore, the molar ratio of F−/Sc3+ has a large effect on the size and aspect ratio of the crystal. We doped Yb3+, Er3+, Tm3+ and Ho3+ ions in Ba3Sc2F12 host to achieve tunable multicolor up conversion luminescence from RGB to white light emission.
2. Experimental
2.1 Chemicals and materials
RE2O3 (RE = Sc, Ho, Er, Tm, Yb) (99.99%) were purchased from Chuandong Chemical Reagents Company (China), barium chloride dihydrate (BaCl2·2H2O), sodium tetrafluoroborate (NaBF4), trisodium citrate dihydrate (Cit3−), ethylenediamine (EDA), L-glycine (L-Gly), ethylenediaminetetraacetic acid disodium salt (EDTA-2NA), sodium hydroxide (NaOH) and nitric acid (HNO3) were analytical grade reagents from Aladdin Industrial Corporation (China), and all above materials were used without further purification.2.2 Preparation
First, the rare earth oxides were dissolved in HNO3 aqueous solution and removed the excess HNO3 by evaporation to form RE(NO3)3 solution for further use. In a typical process for the Ba3Sc1.59F12:0.4Yb3+, 0.01Er3+ nanocrystals: 2 mmol trisodium citrate dihydrate (Cit3−) was dissolved in 30 ml deionized water to form a clarified solution under sustaining magnetic stirring at room temperature. Subsequently, 2 mmol RE(NO3)3 (RE = Sc, Yb and Er) solution was dropwise added into the aforementioned solution. Then, 3 mmol BaCl2·2H2O and 4 mmol NaBF4 were added into the antecedent solution respectively. And then, the pH of the mixture solution was adjusted to 11 by adding NaOH solution. Finally, the white precipitate was formed under magnetic stirring for 30 min at room temperature and then transferred into a 50 ml polytetrafluoroethylene autoclave, sealed and maintained at 220 °C for 24 h. As the autoclave cooled to room temperature naturally, the white sediment was separated by centrifugation. It was wished several times with deionized water and ethanol, and dried in air at 80 °C for 12 h to obtain final sample. Meantime, the other Ba3Sc2F12:Ln3+ samples were synthesized via similar process.2.3 Characterization
The crystal structure and phase were analyzed by powder X-ray diffraction (XRD) measured on a Purkinje General Instrument MSALXD3 using Cu Kα radiation (λ = 0.15406 nm) at a scanning rate of 4° min−1 in the 2θ range from 10° to 60°, 20 mA, 36 kV. The morphology of samples was inspected by a field emission scanning electron microscope (FE-SEM, XL30, Philips) operated at an accelerating voltage of 10 kV. The up conversion (UC) emission spectra were obtained using a 980 nm laser from MDL-N-980-8W as the excitation source and detected by a LS 55 (PerkinElmer) from 300 to 800 nm. All the measurements were performed at room temperature.3. Results and discussion
3.1 Phase and structure
The pure phase of Ba3Sc2F12 has been obtained by one step hydrothermal method with trisodium citrate dihydrate (Cit3−). Fig. 1 shows the XRD patterns of Ba3Sc2(0.995−x)F12:2xYb3+, 0.01Er3+ crystals (x = 0, 0.05, 0.1, 0.2, 0.3 and 0.4). All diffraction peaks are in good agreement with the standard card of Ba3Sc2F12 (JCPDS 49-1506) while x = 0–0.3, but superfluous diffraction peak exists at 2θ = 30.417° when x = 0.4 (seeing the black spot symbol in Fig. 1), which belongs to (214) crystal plane of the Ba4Yb3F17 phase (JCPDS 44-0956). With the increase of Yb3+ concentration from 0 to 0.3, the diffraction intensity of (111) lattice face gradually diminishes until it disappears; and the intensity ratio of (201)/(211) is gradually reduced, which is the same as the case of (212)/(410) but opposite to the situation of (331)/(312). To sum up, Yb3+ and Er3+ ions were successfully doped into the Ba3Sc2F12 host lattice without changing the crystal structure of Ba3Sc2F12 when Yb3+ = 0–0.3; but excess phase of Ba4Yb3F17 existed when Yb3+ = 0.4. It is worth noting that the XRD peak shift moved toward low 2θ direction with the increase of Yb3+ concentration because of lattice expansion,39,56,57 but it stopped and moved to higher 2θ direction when x = 0.4 due to the emergence of new phase (Fig. S1, ESI†). Table S1 (ESI†) provides direct evidence of lattice expansion that the lattice volume of Ba3Sc2(0.995−x)F12:2xYb3+, 0.01Er3+ increases from 499.89 Å3 to 507.1 Å3 with Yb3+ concentration at x = 0–0.3. But the lattice volume reduces while x = 0.4 due to the emergence of new phase (Ba4Yb3F17).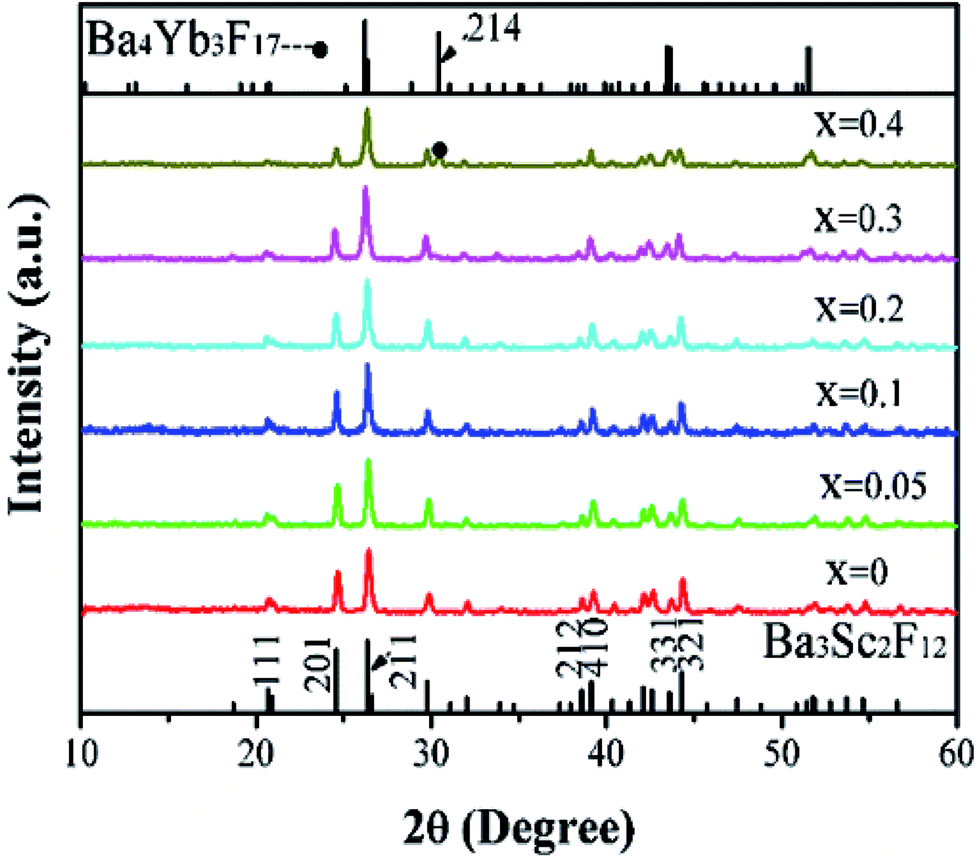 | ||
| Fig. 1 XRD patterns of Ba3Sc2(0.995−x)F12:2xYb3+, 0.01Er3+ crystals (x = 0, 0.05, 0.1, 0.2, 0.3 and 0.4). The standard data of Ba3Sc2F12 (JCPDS 49-1506) and Ba4Yb3F17 (JCPDS 44-0956), respectively. | ||
3.2 Morphology
 | ||
| Fig. 2 XRD patterns of the Ba3Sc2F12 crystals with different surfactants (a) and the corresponding SEM images ((b) NO; (c) Cit3−; (d) EDA; (e) EDTA-2NA; (f) L-Gly). | ||
The morphology of crystal is influenced by internal crystallographic structure and external growth environment. Once the crystalline structure is determined, the characteristic unit cell of the seed dramatically influence the further crystal growth.60,61 The Ba3Sc2F12 belongs to tetragonal in syngony, and its seed has an anisotropic unit structure which can induce anisotropic growth along the crystal reaction direction to form cube. The Cit3− could attach to the characteristic crystal faces and slow down the nucleation, so that the Ba3Sc2F12 crystal grew into a rectangular cuboid. The interaction force between different surfactants and individual crystal plane is much different, which will change the relative growth rate of crystal plane and then transform the size and shape of the final crystal.
 | ||
| Fig. 3 SEM images of Ba3Sc2F12 crystals prepared at different pH values. | ||
For the formation of the Ba3Sc2F12 crystal, the possible process can be proposed as follows:
| Sc3+ + Cit3− → Sc3+ − Cit3− (complex) | (1) |
| NaBF4 + 4OH− → Na+ + 4F− + B(OH)4− | (2) |
| 3Ba2+ + 12F− + 2Sc3+ − Cit3− → Ba3Sc2F12 + 2Cit3− | (3) |
As shown in Scheme 1, the Sc3+–Cit3− complex was obtained when a certain amount of Na3Cit was added into the initial solution. Under high temperature and high pressure, BF4− and Sc3+–Cit3− complex gradually released F− and Sc3+ ions, respectively. Subsequently, they combined with Ba2+ in solution to form Ba3Sc2F12 seed. It has been confirmed that NaBF4 in acidic solution is slowly hydrolyzed to produce B(OH)4− and F− anions in previous reports.62,63 The slow nucleation rate in solution caused large size of the final product because of the low content of F− and Sc3+ ions under faintly acid condition (pH = 5). The Cit3− selective absorb onto the {001} plane which has lower surface energy than the {101} plane, consequently prevent the enlargement in the {001} plane direction and accelerate the growth along the {101} crystal plane. So it is shown in Scheme 1 that the {001} crystal face is much larger than {101} plane. The pH value can directly affect the bonding strength of Sc3+–Cit3− complex and also affect the surface energy of crystal facets.64 The concentration of Sc3+ and F− ions increases because the bonding force of Sc3+–Cit3− complex is weakened and the hydrolysis of BF4− ion is enhanced with the increase of the pH value from 5 to 11, which will accelerate the nucleation process and be conducive to the production of small size product. When pH = 7, two new crystal faces {010} and {100} began to appear and the {101} crystal faces began to decrease. Finally, the {101} crystal planes disappeared to form a cuboid crystal when pH = 11. It illustrates that the {101} plane has larger surface energy to caused faster relative growth rate until disappearing (Scheme 1).
 | ||
| Scheme 1 Schematic illustration for the effect of pH values on morphology of the Ba3Sc2F12 crystal. | ||
Based on the above analysis, it is obvious that the pH value can change the bonding strength of Sc3+–Cit3− compound and the content of F− ions, and thus affect the size of the crystal. Furthermore, the pH value can affect the crystal surface energy, and thus affect the relative growth rate of crystal planes, which is related to the shape of crystal. It is obvious that pH value plays an important role on size and shape of the final crystal.
![[thin space (1/6-em)]](https://www.rsc.org/images/entities/char_2009.gif) :1, the resulting Ba3Sc2F12 sample is cube with length of 200 nm and aspect ratio of 1 (length/diameter, L/D) (Fig. 4a). It is clearly observed that these cubes are made up of many smaller cubes and the surface looks rough. The rough surface disappears and becomes smooth (Fig. 4b), and also the aspect ratio (L/D) increases because the length increases and width decreases with the increase of the molar ratio of F−/Sc3+. When F−/Sc3+ = 16:1, the length increases to 400 nm and the width decreases to 100 nm. That is to say the aspect ratio increases from 1 to 4 (Fig. 4a and d). Based on the above results, it is reasonable to believe that the molar ratio of F−/Sc3+ has a great effect on both shape and size of the final products. At the early stage, the Cit3− anions were introduced into the reaction system and combined with Sc3+ ions to form Sc3+–Cit3− compound through strong coordination interaction.65 Then under the hydrothermal conditions of high temperature and pressure, the chelating power of the Sc3+–Cit3− compound would be weakened, and slowly released Sc3+ ions. Additionally, F− and Ba2+ in the solution react with Sc3+ to produce Ba3Sc2F12 nuclei. The pure crystal of Ba3Sc2F12 was obtained in the low molar ratio of F−/Sc3+ = 6:1, while the size and shape of Ba3Sc2F12 vary along with the increase of molar ratio of F−/Sc3+ from 6:1 to 16:1.
:1, the resulting Ba3Sc2F12 sample is cube with length of 200 nm and aspect ratio of 1 (length/diameter, L/D) (Fig. 4a). It is clearly observed that these cubes are made up of many smaller cubes and the surface looks rough. The rough surface disappears and becomes smooth (Fig. 4b), and also the aspect ratio (L/D) increases because the length increases and width decreases with the increase of the molar ratio of F−/Sc3+. When F−/Sc3+ = 16:1, the length increases to 400 nm and the width decreases to 100 nm. That is to say the aspect ratio increases from 1 to 4 (Fig. 4a and d). Based on the above results, it is reasonable to believe that the molar ratio of F−/Sc3+ has a great effect on both shape and size of the final products. At the early stage, the Cit3− anions were introduced into the reaction system and combined with Sc3+ ions to form Sc3+–Cit3− compound through strong coordination interaction.65 Then under the hydrothermal conditions of high temperature and pressure, the chelating power of the Sc3+–Cit3− compound would be weakened, and slowly released Sc3+ ions. Additionally, F− and Ba2+ in the solution react with Sc3+ to produce Ba3Sc2F12 nuclei. The pure crystal of Ba3Sc2F12 was obtained in the low molar ratio of F−/Sc3+ = 6:1, while the size and shape of Ba3Sc2F12 vary along with the increase of molar ratio of F−/Sc3+ from 6:1 to 16:1.
 | ||
| Fig. 4 SEM images of Ba3Sc2F12 crystals obtained at different molar ratios of F−/Sc3+: (a) 6:1; (b) 8:1; (c) 12:1; (d) 16:1. | ||
This can be explained by different capping effect of F− ions on different crystal faces, which is similar to the example of the morphology control forβ-NaYF4 in the previous literature.66 In Gibbs–Thompson theory, the relative chemical potential of the crystal is proportional to its surface atomic ratio, which is determined by the average number of hits per atom on the entire crystal.67 The cupping effect of F− ions will decrease the average number of dangling bonds, and further reduce the chemical potential of the crystal plane. The density of Sc3+ on different crystal face is diverse. The density of Sc3+ on the crystal plane in width direction is greater than that in length direction, which results in the selective absorption capacity of F− ions on the plane in width direction is greater than that in length direction. So the surface energy of the crystal plane in width direction decreases apace while that of the crystal plane in length direction increases accordingly along with the increase of molar ratio of F−/Sc3+ from 6:1 to 16:1. As a result, the relative growth rate along the plane in length direction is faster than that in width direction. So, the rod-shaped samples with longer length (400 nm) and higher aspect ratio (L/D = 4:1) are formed. The stepped rough surface of cube (Fig. 4a) is formed because the Cit3− slows down the nucleation process and low concentration of F− ions (F−/Sc3+ = 6:1) makes the crystallization incomplete.39,52,68,69
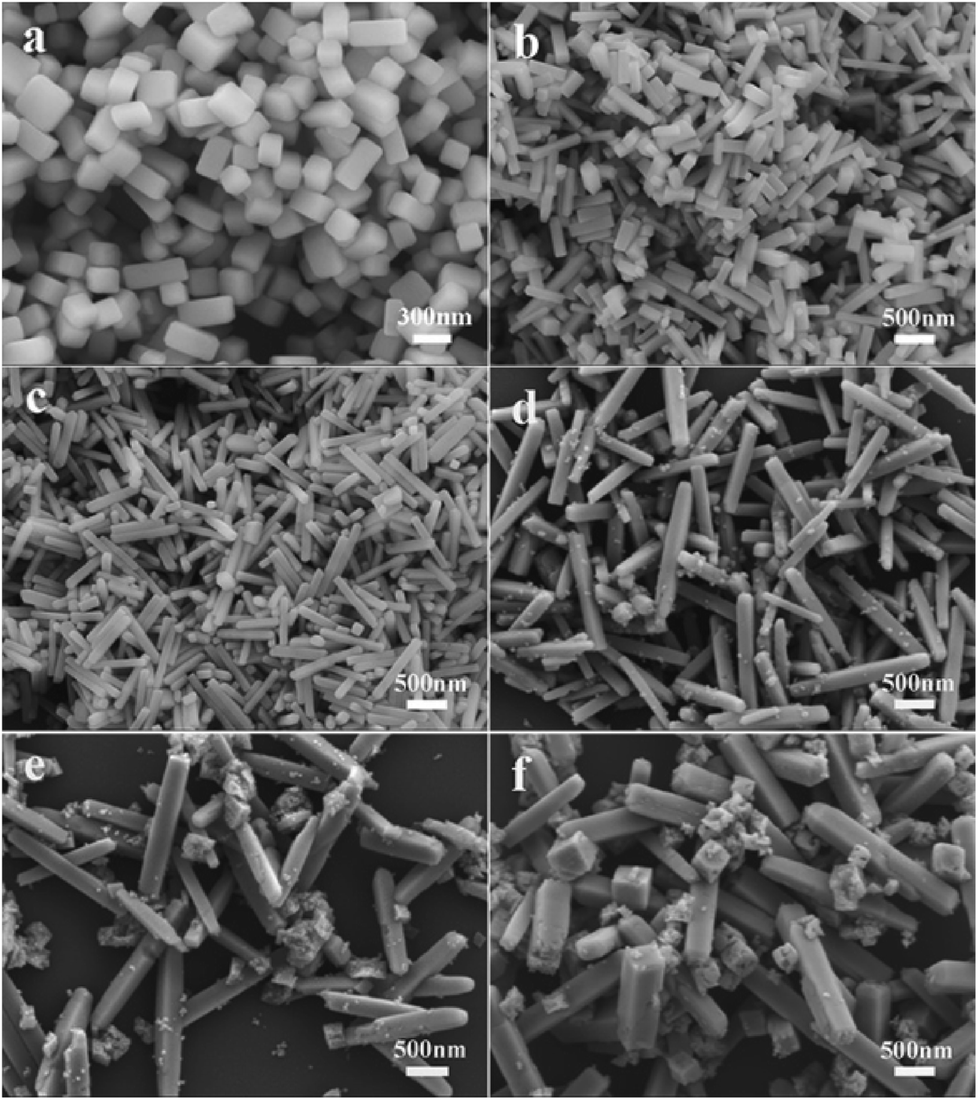 | ||
| Fig. 5 SEM images of Ba3Sc2(1−x)F12:2xYb3+, 0.01Er3+ crystals ((a) x = 0; (b) x = 0.05; (c) x = 0.1; (d) x = 0.2; (e) x = 0.3; (f) x = 0.4). | ||
It means that higher doping concentration of Yb3+ ions (x < 0.3) is favorable for the anisotropic growth. The reason for that should be related to the different growth rates of the crystals along the {100} direction versus {001} direction. The greater the concentration (x < 0.3), the faster the growth tendency along the {100} orientation; but the further increasing concentration (x = 0.3 and 0.4) will inhibit further growth in {100} direction, which is similar to the other case of doping larger-radius lanthanides.70–72 The lanthanide ions can be doped into the Ba3Sc2F12 crystal because of the similar radius between Sc3+ and other doped ions, as well as the similar Pauling's electronegativity of rare earth ions. The RE3+ ions with larger radius replace the Sc3+ ions, which would bring a monotonous lattice expansion, and then increase the nucleation energy and restrain heterogeneous nucleation.56,73 The trisodium citrate dihydrate (Cit3−) is an efficient chelating reagent to selectively adsorb on the {001} crystal planes, and the aggregation of larger-radius RE3+ ions on this crystal planes will reduce the concentration of F− ions, which will result in inhibiting the crystal growth in the {001} direction and faster growth rate in the {100} direction than that in {001} direction. But higher doping concentration (x = 0.3 and 0.4) restrains the growth in length direction and promotes the growth in width direction relatively, because the increasing concentration of RE3+ with larger radius in {100} direction inhabits the crystal growth in this orientation.70
3.3 Up conversion luminescence property
 | ||
| Fig. 6 UC emission spectra of Ba3Sc2(0.995−x)F12:2xYb3+, 0.01Er3+ crystals under 980 nm excitation with power density of 3 W cm−2. | ||
It is clearly observed that the intensity of green emission reduced but the intensity of red emission enhanced with the increase of the Yb3+ ions. A similar result was also observed from some other Yb3+/Er3+-codoped fluorides.30,39,74–76 The interatomic distance of Yb3+–Er3+ in the Ba3Sc2F12 host lattice would decrease with the increase of Yb3+ ions, which would produce two energy-back-transfer processes from Er3+ to Yb3+ (Fig. 7). The energy-back-transfer of 4S3/2 (Er3+) + 2F7/2 (Yb3+) → 4I13/2 (Er3+) + 2F5/2 (Yb3+) (BET1 in Fig. 7) should depopulate the excited levels 4S3/2 and 2H11/2. So, the green emission (2H11/2/4S3/2 → 4I15/2) decreased.
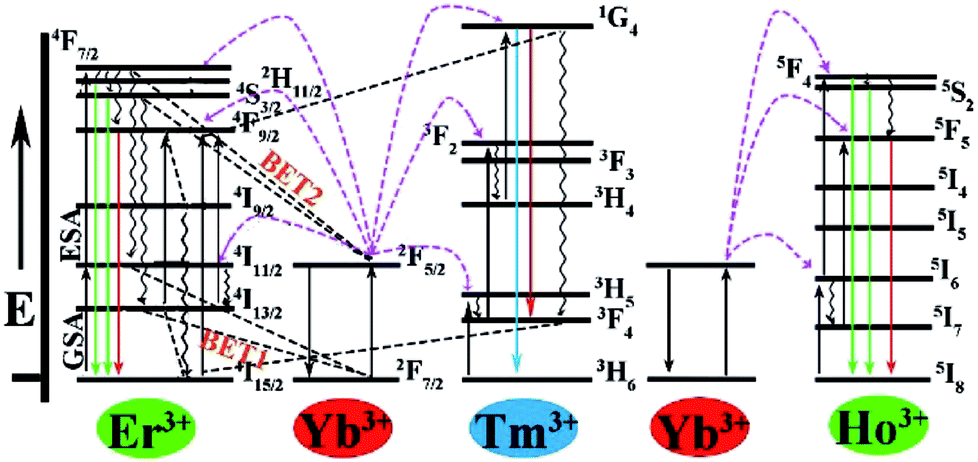 | ||
| Fig. 7 Energy level diagrams of the Yb3+, Er3+, Tm3+ and Ho3+ ions and the proposed UC emission mechanism. | ||
For the red emission, the mechanism of up conversion emission is predominantly attributed to a two-photons process from the excited Yb3+ to Er3+ because of larger absorption cross section of Yb3+ ions than that of Er3+ ions. At first, the ground state 2F7/2 of Yb3+ absorbed a photon to 2F5/2 and then transferred its energy to Er3+ (4I11/2). During the lifetime of 4I11/2 (Er3+), a second Yb3+ (2F5/2) ion transferred its energy again, resulting in the population of the 4F7/2 state of Er3+, and then nonradiative relaxation populated the 4F9/2 levels, so that the red emission of 4F9/2 → 4I15/2 was produced (Fig. 7). At the same time, relaxation from 4I11/2 (Er3+) would produce the 4I13/2 (Er3+), and then the excited state 2F5/2 of Yb3+ transfered its energy to Er3+ through the energy transfer process 2F5/2 (Yb3+) + 4I13/2 (Er3+) → 2F7/2 (Yb3+) + 4F9/2 (Er3+), which can directly populate the 4F9/2 red-emitting level (Fig. 7) and increase the red emission at 648 nm with the increase of Yb3+ ions.77 In addition, the energy-back-transfer process of 4F7/2 (Er3+) + 2F7/2 (Yb3+) → 4I11/2 (Er3+) + 2F5/2(Yb3+) (BET2 in Fig. 7) should restrain the number of electrons on the excited 4F7/2 (Er3+) level at higher concentration of Yb3+ ions. This would further reduce the population on the green-emitting levels 2H11/2 and 4S3/2, and then the green emission decreased.78
Analyzing the UC emission spectra of Ba3Sc2(0.995−x)F12:2xYb3+, 0.01Er3+ crystals in Fig. 6 and the XRD patterns in Fig. 1, the doping concentration of Yb3+ is selected to be 0.2 in Ba3Sc2(0.995−x)F12:2xYb3+, Ln3+ (Ln = Er, Ho, Tm) crystals for controlling the doping concentration of the total RE3+ in proper range (<0.4) to produce the pure phrase of Ba3Sc2F12. Fig. 8 shows the UC luminescence spectra of Ln3+-doped Ba3Sc2F12 crystals under 980 nm laser excitation. The Ba3Sc1.99F12:0.01Er3+, Ba3Sc1.59F12:0.4Yb3+, 0.01Er3+, Ba3Sc1.59F12:0.4Yb3+, 0.01Tm3+ and Ba3Sc1.59F12:0.4Yb3+, 0.01Ho3+ samples exhibited green, yellow, blue and green emissions, respectively. These color emissions can be confirmed by the corresponding luminescent photographs under 980 nm laser excitation (inset in Fig. 8). The UC emission spectrum of the Ba3Sc1.99F12:0.01Er3+ sample excited at 980 nm is shown in Fig. 8a. The green emission is ascribed to 2H11/2, 4S3/2 → 4I15/2 transitions of Er3+; but the red emission region (4F9/2 → 4I15/2 of Er3+) was obtained in Ba3Sc1.59F12:0.4Yb3+, 0.01Er3+ sample (Fig. 8b), which was mixed with green emission region to show yellow emission. This can be confirmed by the luminescent photograph in Fig. 8b. Fig. 8c indicates that strong blue emission at 482 nm (1G4 → 3H6 of Tm3+) and weak red emission at 650 nm (1G4 → 3F4 of Tm3+) respectively, and the Ba3Sc1.59F12:0.4Yb3+, 0.01Tm3+ product exhibited blue emission from luminescent photograph under 980 nm laser excitation (inset in Fig. 8c).
 | ||
| Fig. 8 Up conversion emission spectra and the corresponding luminescent photographs of Ba3Sc2F12:Ln3+ crystals under 980 nm excitation with power density of 3 W cm−2 in dark room. | ||
Fig. 8d shows the up conversion luminescence spectra of Ba3Sc1.59F12:0.4Yb3+, 0.01Ho3+ crystal. The band in the green emission region at 545 nm is attributed to the 5S2, 5F4 → 5I8 transition of Ho3+ and the weak red region emission at 663 nm is ascribed to the 5F5 → 5I8 transition of Ho3+. The green emission can be confirmed by the corresponding luminescent photographs under 980 nm laser excitation (inset in Fig. 8d). We can't observe green emission in single Ho3+-doped Ba3Sc2F12 crystals under 980 nm laser excitation because the ground state absorption (GSA) can't occur, but Yb3+ could act as the excellent sensitizer to produce energy transfer process from Yb3+ to Ho3+ in Ba3Sc1.59F12:0.4Yb3+, 0.01Ho3+ crystal, which leads to green emission. As for the red light emission at 663 nm, there are two possible energy ways for the population of the 5F5 red emitting level (Fig. 7): (1) 2F5/2 (Yb3+) + 5I7 (Ho3+) → 2F7/2 (Yb3+) + 5F5 (Ho3+), in which the 5I7 level is obtained through the nonradiative relaxation from the 5I6 level; (2) nonradiative phonon-assisted relaxation from the 5F4 and 5S2 states to the 5F5 state.79
The UC emission property of Yb3+/Er3+ and Yb3+/Tm3+ will yield the excitation power density because excitation density not only is directly related to the initial population of the excited state in a UC system, but also modifies the multi-phonon non-radiation relaxation probability. To further investigate the emission behavior of Yb3+/Er3+ and Yb3+/Tm3+ pairs, and the logarithmic relationship of UC emission intensities to power density of Ba2Sc2F12:0.4Yb3+/0.01Ln3+ (Ln = Er, Tm) is shown in Fig. 9. The UC emission intensity increased with power obeying a rule of I ∝ Pn for both the green and blue emissions, where I is the emission intensity, P is the excitation laser power density, and n is the number of photons.80 The n values are obtained to be 1.92 and 3.02 for green and blue emissions, respectively. For the green emission of Yb3+/Er3+, the value of n is close to 2 which indicates that the green emission in Ba2Sc2F12 matrix is involved in two-photon process; for the blue emission of Yb3+/Tm3+ pairs, the n value is close to 3 which indicates that the blue emission in Ba2Sc2F12 matrix is involved in three-photon process.
 | ||
| Fig. 9 Double logarithmic relationship of green and blue luminescence intensities versus power density of Ba2Sc2F12:0.4Yb3+/0.01Ln3+ (Ln = Er, Tm). | ||
Compared with the traditional high temperature solid state reaction route, the hydrothermal synthesis of UC fluorides has the advantage of controlled morphology and size, but it lose the high emission efficiency due to the high concentration defects. We can find that the UC emission intensities of Ba2Sc2F12:0.4Yb3+/0.01Ln3+ (Ln = Er, Tm and Ho) crystals prepared by solid state route are stronger than that prepared by hydrothermal method (see Fig. S2†).
 | ||
| Fig. 10 Up conversion luminescence spectra of Ba3Sc2F12:Ln3+ crystals under 980 nm excitation with power density of 3 W cm−2. | ||
Here, the Ba3Sc1.58F12:0.4Yb3+, 0.01Er3+, 0.01Tm3+ products show blue, green and red emissions, so that white light emission could be produced on the basis of the color superposition principle. The tunable colors were obtained through adjusting the ratio of Yb3+/Er3+/Tm3+ in Ba3Sc2F12 host crystal. We have synthesized a series of Ba3Sc2(0.795−x)F12:0.4Yb3+, 0.01Er3+, 2xTm3+ crystals doped with different Tm3+ concentrations (x = 0.0014–0.0030). The up conversion photoluminescence emission spectra of Ba3Sc2(0.795−x)F12:0.4Yb3+, 0.01Er3+, 2xTm3+ are displayed in Fig. 11a.
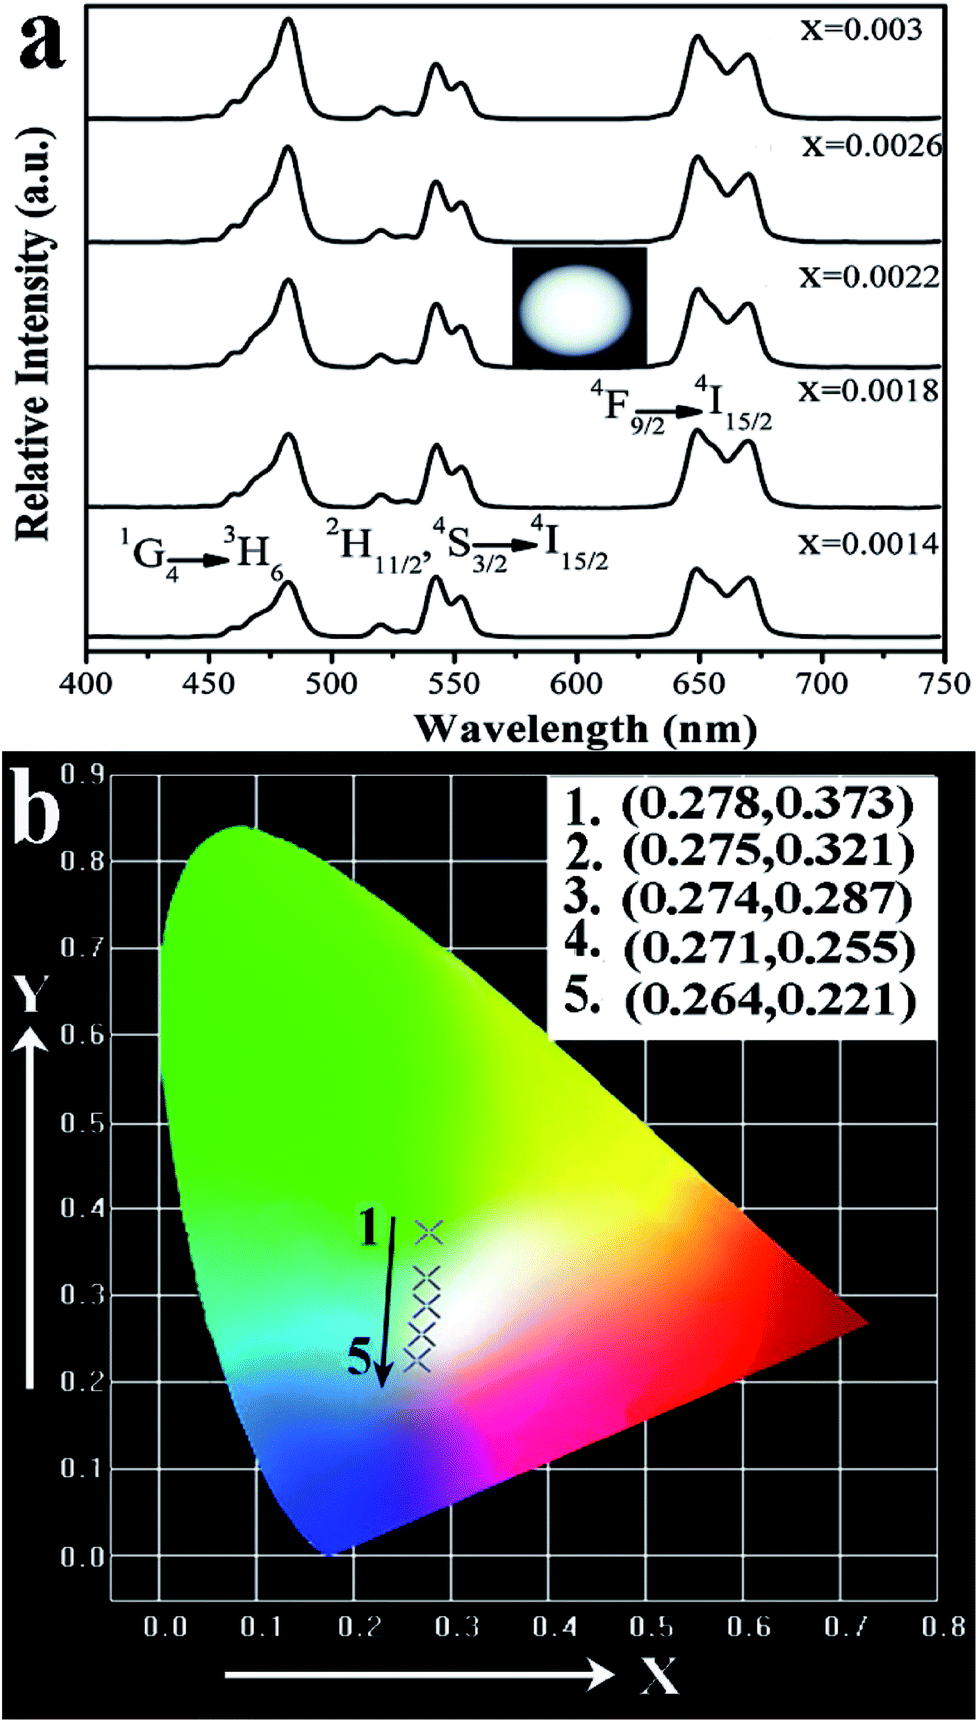 | ||
| Fig. 11 (a) UC photoluminescence emission spectra of the Ba3Sc2(0.795−x)F12:0.4Yb3+, 0.01Er3+, 2xTm3+ crystals under 980 nm excitation with power density of 3 W cm−2, (b) the corresponding CIE chromaticity coordinates. | ||
It is observed that the UC emission spectra of Ba3Sc2(0.795−x)F12:0.4Yb3+, 0.01Er3+, 2xTm3+ crystal consists of blue emission at 482 nm (1G4 → 3H6 of Tm3+), green emission at 520/542 nm (2H11/2/4S3/2 → 4I15/2 of Er3+) and red emission at 648 nm (4F9/2 → 4I15/2 of Er3+). As the concentration of Tm3+ increases from 0.0014 to 0.0030, the red emission increases compared to the green emission, which indicates that there is an interaction between Tm3+ and Er3+. The resonant cross-relaxation process of 1G4 (Tm3+) + 4I15/2 (Er3+) → 3F4 (Tm3+) + 4F9/2 (Er3+) possibly achieved (Fig. 7) because the energy of the 1G4 → 3F4 emission matches the excitation of 4I15/2 → 4F9/2 exactly.77,81,82 This would result in greater population of the red emitting level 4F9/2 (Er3+) and enhance the red emission intensity (Fig. 11a). Additionally, the corresponding CIE chromaticity coordinates of Ba3Sc2(0.795−x)F12:0.4Yb3+, 0.01Er3+, 2xTm3+ crystals vary from green light region (0.278, 0.373) to blue white light (0.264, 0.221) by changing the Tm3+ ions concentration (Fig. 11b). Furthermore, when x = 0.0022, the white light UC photoluminescence in Ba3Sc1.5856F12:0.4Yb3+, 0.01Er3+, 0.0044Tm3+ crystal with CIE-x = 0.274 and CIE-y = 0.287 is obtained and the corresponding luminescent photograph also is shown in Fig. 10a for direct observing, which suggests potential applications in display technology and white light sources such as white LEDs.
4. Conclusions
In conclusion, we synthesized Ba3Sc2F12:Yb3+, Ln3+ (Ln = Er, Ho, Tm) crystals through mild hydrothermal route and studied the UC emission properties under 980 nm laser excitation. Ba3Sc2F12:Yb3+, Ln3+ crystals with various shapes and sizes were obtained by selecting different surfactants and controlling pH values. The aspect ratio of the Ba3Sc2(0.995−x)F12:2xYb3+, 0.01Er3+ crystal increased with the increase of the concentration of the doped Yb3+ ions (x < 0.3). The blue, green and red up conversion luminescence of the Ba3Sc2F12:Ln3+ system can be attributed to Er3+, Tm3+ and Ho3+ ions both excited by means of Er3+ ground/excited-state absorption and energy transfers from Yb3+ ions. Because the back-energy-transfer between Yb3+–Er3+ ions could weaken the green emission and increase the population of the red emission 4F9/2 level, the enhancement of red emission was obtained with the increase of Yb3+ ions. Based on the principle of color superposition, we achieved the white light UC emission with CIE-x = 0.274 and CIE-y = 0.287 in Ba3Sc1.5856F12:0.4Yb3+, 0.01Er3+, 0.0044Tm3+ system by controlling the species and concentration of dopants. In view of multicolor UC emission of the Ba3Sc2F12:Yb3+, Ln3+ (Ln = Er, Ho, Tm) systems under 980 nm LD excitation, they may have potential applications in the fields of three dimensional displays, back lighting and white light sources.Conflicts of interest
There are no conflicts to declare.Acknowledgements
This project is financially supported by the Fundamental Research Funds for the Central Universities (XDJK2016C147 and XDJK2015B019), the National Natural Science Foundation of China (51302229 and 51302228) and the Scientific Research Foundation for Returned Scholars, Ministry of Education of China (46th).Notes and references
- L. Q. Xiong, Z. G. Chen, Q. W. Tian, T. Y. Cao, C. J. Xu and F. Y. Li, Anal. Chem., 2009, 81, 8687–8694 CrossRef CAS PubMed.
- C. Wang, L. Cheng and Z. Liu, Theranostics, 2013, 3, 317–330 CrossRef PubMed.
- Y. Zhai, C. Zhu, J. Ren, E. Wang and S. Dong, Chem. Commun., 2013, 49, 2400–2402 RSC.
- H. Kobayashi, M. Ogawa, R. Alford, P. L. Choyke and Y. Urano, Chem. Rev., 2010, 110, 2620–2640 CrossRef CAS PubMed.
- C. P. Montgomery, B. S. Murray, E. J. New, R. Pal and D. Parker, Acc. Chem. Res., 2009, 42, 925–937 CrossRef CAS PubMed.
- V. Fernandez-Moreira, F. L. Thorp-Greenwood and M. P. Coogan, Chem. Commun., 2010, 46, 186–202 RSC.
- J. C. G. Bunzli, Chem. Rev., 2010, 110, 2729–2755 CrossRef PubMed.
- Q. Zhao, F. Y. Li and C. Huang, Chem. Soc. Rev., 2010, 39, 3007–3030 RSC.
- Q. Zhao, C. Huang and F. Y. Li, Chem. Soc. Rev., 2011, 40, 2508–2524 RSC.
- A. Llevot and D. Astruc, Chem. Soc. Rev., 2012, 41, 242–275 RSC.
- X. Michalet, F. F. Pinaud, L. A. Bentolila, J. M. Tsay, S. Doose, J. J. Li, G. Sundaresan, A. M. Wu, S. S. Gambhir and S. Weiss, Science, 2005, 307, 538–544 CrossRef CAS PubMed.
- J. C. G. Bunzli and C. Piguet, Chem. Soc. Rev., 2005, 34, 1048–1077 RSC.
- Y. S. Liu, D. T. Tu, H. M. Zhu and X. Y. Chen, Chem. Soc. Rev., 2013, 42, 6924–6958 RSC.
- J. Zhou, Q. Liu, W. Feng, Y. Sun and F. Y. Li, Chem. Rev., 2015, 115, 395–465 CrossRef CAS PubMed.
- H. Suzuki, Y. Nishida and S. Hoshino, Mol. Cryst. Liq. Cryst., 2003, 406, 221–231 CAS.
- Y. P. Li, J. H. Zhang, Y. S. Luo, X. Zhang, Z. D. Hao and X. J. Wang, J. Mater. Chem., 2011, 21, 2895–2900 RSC.
- K. Z. Zheng, D. S. Zhang, D. Zhao, N. Liu, F. Shi and W. P. Qin, Phys. Chem. Chem. Phys., 2010, 12, 7620–7625 RSC.
- S. J. Zeng, M.-K. Tsang, C.-F. Chan, K.-L. Wong, B. Fei and J. H. Hao, Nanoscale, 2012, 4, 5118–5124 RSC.
- X. S. Zhai, Y. Wang, X. J. Liu, S. H. Liu, P. P. Lei, S. Yao, S. Y. Song, L. Zhou, J. Feng and H. J. Zhang, ChemPhotoChem, 2017, 1, 369–375 CrossRef CAS.
- H. L. Li, G. X. Liu, J. X. Wang, X. T. Dong and W. S. Yu, New J. Chem., 2017, 41, 1609–1617 RSC.
- Z. C. Li, D. C. Zhou, Y. Yang, Y. Gao, P. Ren and J. B. Qiu, Opt. Mater., 2016, 60, 277–282 CrossRef CAS.
- B. Zhao, L. Yuan, S. S. Hu, X. M. Zhang, X. J. Zhou, J. F. Tang and J. Yang, CrystEngComm, 2016, 18, 8044–8058 RSC.
- W. Y. Yin, L. J. Zhou, Z. J. Gu, G. Tian, S. Jin, L. Yan, X. X. Liu, G. M. Xing, W. L. Ren, F. Liu, Z. W. Pan and Y. L. Zhao, J. Mater. Chem., 2012, 22, 6974–6981 RSC.
- Y. S. Liu, D. T. Tu, H. M. Zhu and X. Y. Chen, Chem. Soc. Rev., 2013, 42, 6924–6958 RSC.
- F. Wang, Y. Han, C. S. Lim, Y. Lu, J. Wang, J. Xu, H. Chen, C. Zhang, M. Hong and X. Liu, Nature, 2010, 463, 1061–1065 CrossRef CAS PubMed.
- B. T. Chen, B. Dong, J. Wang, S. Zhang, L. Xu, W. Yu and H. W. Song, Nanoscale, 2013, 5, 8541–8549 RSC.
- Y. J. Ding, X. Teng, H. Zhu, L. L. Wang, W. B. Pei, J. J. Zhu, L. Huang and W. Huang, Nanoscale, 2013, 5, 11928–11932 RSC.
- W. B. Pei, B. Chen, L. L. Wang, J. S. Wu, X. Teng, R. Lau, L. Huang and W. Huang, Nanoscale, 2015, 7, 4048–4054 RSC.
- Q. M. Huang, J. C. Yu, E. Ma and K. M. Lin, J. Phys. Chem. C, 2010, 114, 4719–4724 CAS.
- C. M. Zhang, P. Ma, C. X. Li, G. G. Li, S. S. Huang, D. M. Yang, M. M. Shang, X. J. Kang and J. Lin, J. Mater. Chem., 2011, 21, 717–723 RSC.
- L. Rao, W. Lu, T. M. Zeng, Z. G. Yi, H. B. Wang, H. R. Liu and S. J. Zeng, J. Mater. Chem. B, 2014, 2, 6527–6533 RSC.
- T. Q. Sheng, Z. L. Fu, X. J. Wang, S. H. Zhou, S. Y. Zhang and Z. W. Dai, J. Phys. Chem. C, 2012, 116, 19597–19603 CAS.
- L. P. Jia, Q. Zhang and B. Yan, Mater. Res. Bull., 2014, 55, 53–60 CrossRef CAS.
- L. Lei, D. Q. Chen, F. Huang, Y. L. Yu and Y. S. Wang, J. Alloys Compd., 2012, 540, 27–31 CrossRef CAS.
- H. X. Guan, Y. Sheng, Y. H. Song, K. Y. Zheng, C. Y. Xu, X. M. Xie, Y. Z. Dai and H. F. Zou, RSC Adv., 2016, 6, 73160–73169 RSC.
- P. Zhang, Y. Y. He, J. H. Liu, J. Feng, Z. Q. Sun, P. P. Lei, Q. H. Yuan and H. J. Zhang, RSC Adv., 2016, 6, 14283–14289 RSC.
- S. Sarkar, B. Meesaragandla, C. Hazra and V. Mahalingam, Adv. Mater., 2013, 25, 856–860 CrossRef CAS PubMed.
- I. Etchart, M. Bérard, M. Laroche, A. Huignard, I. Hernández, W. P. Gillin, R. J. Curryd and A. K. Cheetham, Chem. Commun., 2011, 47, 6263–6265 RSC.
- B. Zhao, D. Y. Shen, J. Yang, S. S. Hu, X. J. Zhou and J. F. Tang, J. Mater. Chem. C, 2017, 5, 3264–3275 RSC.
- M. N. Mayakovaa, S. V. Kuznetsova, V. V. Voronova, A. E. Baranchikovb, V. K. Ivanovb and P. P. Fedorov, Russ. J. Inorg. Chem., 2014, 59, 773–777 CrossRef.
- P. Gredin, A. D. Kozitk and M. Qnacton, Z. Anorg. Allg. Chem., 1993, 619, 1088–1094 CrossRef CAS.
- Y. Fei, S. L. Zhao, X. Sun, L. H. Huang, D. G. Deng and S. Q. Xu, J. Non-Cryst. Solids, 2015, 428, 20–25 CrossRef CAS.
- X. Teng, Y. H. Zhu, W. Wei, S. C. Wang, J. F. Huang, R. Naccache, W. B. Hu, A. L. Y. Tok, Y. Han, Q. C. Zhang, Q. Y. Fan, W. Huang, J. A. J. Capobianco and L. Huang, J. Am. Chem. Soc., 2012, 134, 8340–8343 CrossRef CAS PubMed.
- H. X. Mai, Y. W. Zhang, R. Si, Z. G. Yan, L. D. Sun, L. P. You and C. H. Yan, J. Am. Chem. Soc., 2006, 128, 6426–6436 CrossRef CAS PubMed.
- B. Shao, Z. Yang, Y. Wang, J. Li, J. Yang, J. Qiu and Z. Song, ACS Appl. Mater. Interfaces, 2015, 7, 25211–25218 CAS.
- J. Liao, Z. Yang, H. Wu, D. Yan, J. Qiu, Z. Song, Y. Yang, D. Zhou and Z. Yin, J. Mater. Chem. C, 2013, 1, 6541–6546 RSC.
- F. Wang, R. Deng, J. Wang, Q. Wang, Y. Han, H. Zhu, X. Chen and X. Liu, Nat. Mater., 2011, 10, 968–973 CrossRef CAS PubMed.
- S. H. Fan, S. K. Wang, H. T. Sun, S. Y. Sun, G. J. Gao and L. L. Hu, J. Am. Ceram. Soc., 2017, 100, 3061–3069 CrossRef CAS.
- S. H. Fan, S. K. Wang, H. T. Sun, S. Y. Sun, G. J. Gao and L. L. Hu, Opt. Express, 2017, 25, 180–190 CrossRef PubMed.
- S. H. Hua, G. J. Gao, D. Busko, Z. Q. Lin, S. K. Wang, X. Wang, S. Y. Sun, A. Turshatov, B. S. Richards, H. T. Sun and L. L. Hu, J. Mater. Chem. C, 2017, 5, 9770–9777 RSC.
- G. J. Gao, D. Busko, S. Kauffmann-Weiss, A. Turshatov, L. A. Howard and B. S. Richards, J. Mater. Chem. C, 2017, 5, 11010–11017 RSC.
- G. J. Gao, A. Turshatov, L. A. Howard, D. Busko, R. Joseph, D. Hudry and B. S. Richards, Advanced Sustainable Systems, 2017, 1, 1600033 CrossRef.
- G. G. Li, M. M. Shang, D. L. Geng, D. M. Yang, C. Peng, Z. Y. Cheng and J. Lin, CrystEngComm, 2012, 14, 2100–2111 RSC.
- D. Q. Chen, Y. S. Wang, Y. L. Yu, P. Huang and F. Y. Weng, J. Solid State Chem., 2008, 181, 2763–2767 CrossRef CAS.
- A. Kumari and V. K. Rai, Mater. Res. Bull., 2015, 72, 168–175 CrossRef CAS.
- Y. J. Ding, X. X. Zhang, H. Zhu and J. J. Zhu, J. Mater. Chem. C, 2014, 2, 946–952 RSC.
- D. Q. Chen, Y. L. Yu, F. Huang, A. P. Yang and Y. S. Wang, J. Mater. Chem., 2011, 21, 6186–6192 RSC.
- Z. H. Xu, X. J. Kang, C. X. Li, Z. Y. Hou, C. M. Zhang, D. M. Yang, G. G. Li and J. Lin, Inorg. Chem., 2010, 49, 6706–6715 CrossRef CAS PubMed.
- B. Zhao, L. Yuan, S. S. Hu, X. M. Zhang, X. J. Zhou, J. F. Tang and J. Yang, New J. Chem., 2016, 40, 9211–9222 RSC.
- J. Prywer, Prog. Cryst. Growth Charact. Mater., 2005, 50, 1–38 CrossRef CAS.
- Y.-W. Jun, J.-H. Lee, J.-S. Choi and J. Cheon, J. Phys. Chem. B, 2005, 109, 14795–14806 CrossRef CAS PubMed.
- L. Zhu, L. Qin, X. D. Liu, J. Y. Li, Y. F. Zhang, J. Meng and X. Q. Cao, J. Phys. Chem. C, 2007, 111, 5898–5903 CAS.
- Z. J. Miao, Z. M. Liu, K. L. Ding, B. X. Han, S. D. Miao and G. M. An, Nanotechnology, 2007, 18, 125605 CrossRef.
- C. X. Li, J. Yang, Z. W. Quan, P. P. Yang, D. Y. Kong and J. Lin, Chem. Mater., 2007, 19, 4933–4942 CrossRef CAS.
- A. Huignard, V. Buissette, G. Laurent, T. Gacoin and J. P. Boilot, Chem. Mater., 2002, 14, 2264–2269 CrossRef CAS.
- C. X. Li, C. M. Zhang, Z. Y. Hou, L. L. Wang, Z. W. Quan, H. Z. Lian and J. Lin, J. Phys. Chem. C, 2009, 113, 2332–2339 CAS.
- S. H. Yu, B. Liu, M. S. Mo, J. H. Huang, X. M. Liu and Y. T. Qian, Adv. Funct. Mater., 2003, 13, 639–647 CrossRef CAS.
- Y. Gao, Q. Zhao, Z. H. Xu and Y. G. Sun, New J. Chem., 2014, 38, 2629–2638 RSC.
- C. F. Liu, C. K. Zhang, H. Q. Song, C. P. Zhang, Y. G. Liu, X. H. Nan and G. Z. Cao, Nano Energy, 2016, 22, 290–300 CrossRef CAS.
- X. F. Wu, W. Wang, N. N. Song, X. J. Yang, S. Khaimanov and N. Tsidaeva, Chem. Eng. J., 2016, 306, 328–392 Search PubMed.
- R. Swaminathan, M. A. Willard and M. E. McHenry, Acta Mater., 2006, 54, 807–816 CrossRef CAS.
- L. B. Tahar, L. S. Smiri, M. Artus, A.-L. Joudrier, F. Herbst, M. J. Vaulay, S. Ammar and F. Fiévet, Mater. Res. Bull., 2007, 42, 1888–1896 CrossRef.
- P. Shikha, T. S. Kang and B. S. Randhawa, J. Alloys Compd., 2015, 625, 336–345 CrossRef CAS.
- N. Niu, P. P. Yang, Y. C. Liu, C. X. Li, D. Wang, S. L. Gai and F. He, J. Colloid Interface Sci., 2011, 362, 389–396 CrossRef CAS PubMed.
- H. B. Wang, W. Lu, T. M. Zeng, Z. G. Yi, L. Rao, H. R. Liu and S. J. Zeng, Nanoscale, 2014, 6, 2855–2860 RSC.
- D. L. Gao, X. Y. Zhang, H. R. Zheng and E. J. He, J. Alloys Compd., 2013, 554, 395–399 CrossRef CAS.
- J. Yang, C. M. Zhang, C. Peng, C. X. Li, L. L. Wang, R. T. Chai and J. Lin, Chem.–Eur. J., 2009, 15, 4649–4655 CrossRef CAS PubMed.
- G. Glaspell, J. Anderson, J. R. Wilkins and M. S. Ei-Shall, J. Phys. Chem. C, 2008, 112, 11527–11531 CAS.
- Z. F. Shan, D. Q. Chen, Y. L. Yu, P. Huang, F. Y. Weng, H. Lin and Y. S. Wang, Mater. Res. Bull., 2010, 45, 1017–1020 CrossRef CAS.
- L. P. Tu, X. M. Liu, F. Wu and H. Zhang, Chem. Soc. Rev., 2015, 44, 1331–1345 RSC.
- D. Q. Chen, Y. S. Wang, K. L. Zheng, T. L. Guo, Y. L. Yu and P. Huang, Appl. Phys. Lett., 2007, 91, 251903 CrossRef.
- B. Dong, H. W. Song, H. Q. Yu, H. Zhang, R. F. Qin, X. Bai, G. H. Pan, S. Z. Lu, F. Wang, L. B. Fan and Q. L. Dai, J. Phys. Chem. C, 2008, 112, 1435–1440 CAS.
Footnote |
| † Electronic supplementary information (ESI) available. See DOI: 10.1039/c7ra11680b |
| This journal is © The Royal Society of Chemistry 2017 |