
 Open Access Article
 This Open Access Article is licensed under a
 Creative Commons Attribution 3.0 Unported Licence
Comparison between mandibular and femur derived bone marrow stromal cells: osteogenic and angiogenic potentials in vitro and bone repairing ability in vivo†
Wenhui Zhoua,
Jinkai Zhanga,
Kaili Lin *b and
Fengshan Chen*a
*b and
Fengshan Chen*a
aDepartment of Orthodontics, School & Hospital of Stomatology, Tongji University, Shanghai Engineering Research Center of Tooth Restoration and Regeneration, Shanghai 200072, China. E-mail: 13681746901@126.com
bSchool & Hospital of Stomatology, Tongji University, Shanghai Engineering Research Center of Tooth Restoration and Regeneration, Shanghai 200072, China. E-mail: linkaili@tongji.edu.cn; lklecnu@aliyun.com; Fax: +86-21-66524025; Tel: +86-21-56722215
First published on 13th December 2017
Abstract
As seed cells for bone tissue engineering, bone marrow stromal cells (BMSCs) have multiple differentiation potential. Prior studies have demonstrated that jaw bone has distinct osteogenic characteristics and different bone repairing capability from limb bone. In order to compare the promotion of bone regeneration as seed cells between maxillofacial derived BMSCs (M-BMSCs) and femur derived BMSCs (F-BMSCs) of SD rats, their proliferation and potential multipotent differentiation abilities, osteogenic differentiation and angiogenic factor secretion were investigated and compared. Moreover, the M-BMSCs and F-BMSCs were seeded on β-tricalcium phosphate bioceramic microspheres, and implanted into alveolar bone crest. The bone regeneration ability induced by the M-BMSCs and F-BMSCs was examined. The results showed that M-BMSCs had better osteogenic capability and angiogenic tendency than those of F-BMSCs both in vitro and in vivo. M-BMSCs might be the ideal stem seed cell sources for bone regeneration and bone tissue engineering applications.
1 Introduction
Jaw defects are a common clinical manifestation originating from various diseases that will result in facial asymmetry, dysmasesia, and asophia, etc. Bone insufficiency is one of the main factors, compromising the prognosis of dental implant surgery, orthodontic and orthognathic treatment. Although human jaw has great potential in regeneration, it is unpractical to expect that a large bone defect can be completely restored spontaneously. Bone tissue engineering, with many advantages in bone repairing over autograft and allograft, is widely used to repair large bone defects and to establish normal functions.1–3 The goal of bone tissue engineering is to supply sufficient skeletal dimension through the basis of seed cells, biomaterials and growth factors. As one of the three basic elements of tissue engineering, biomaterials have been extensively investigated for decades;4,5 while seed cells, another basic element, serve as the core of tissue engineering and need more attention from researchers.6,7Among all the seed cells used in clinical application, bone marrow stromal cells (BMSCs) are the ideal seed cells used in bone tissue engineering.8–12 They can be easily harvested from the donor bone marrow and have good abilities to form bone tissues in vivo. It has been reported that BMSCs isolated from different origins have site-specific cell phenotypic, and contain different functions in vitro, especially in maxillofacial. BMSCs from maxillofacial (M-BMSCs) and femur (F-BMSCs) are two important seed cells, which are closely connected and widely used in the clinics as well as the scientific researches. For a long time, although femur flap have been used for inadequate alveolar bone in the palate cleft surgery,13,14 the embryological origins between craniofacial and the trunk limb bones are different. Jaw, as the craniofacial bone, arises from neural crest cells of the neuroectoderm germ layer, and undergoes endochondral ossification.15 While the femur bone, as the axial and appendicular skeleton, arises from the mesoderm, and is formed primarily by intramembranous ossification. The developmental difference contributes to site-specific characteristics and distinct regulation mechanisms between the two cells. During the osteoblastic differentiation and bone formation, these two sources of BMSCs express distinct growth factors, receptors, and signaling pathways.16
Previous studies have proved that human M-BMSCs isolated from mandibular possess stronger proliferation and osteogenic potential than those of F-BMSCs isolated from long-bone in vitro.17,18 It might indicate that BMSCs from mandible have unique characteristics and osteogenic capability.19 During skeletal development and bone reparation process, the angiogenic capability is pivotal, as the vasculature provides needed nutritive for osteoblast cells and regulates bone remodeling. Moreover, before any blood vessels are detected, the angiogenic factor of VEGF is expressed and this expression has close connection to the early osteogenic process.20 Studies also suggested that human umbilical vein endothelial cells (HUVECs) were allowed to form more sprouting angiogenesis in the co-culture system with craniofacial BMSCs instead of iliac crest BMSCs.21 It reveals that M-BMSCs might contain greater angiogenic potency than that of F-BMSCs.
Although the site-specific differences, such as origin, proliferation, and osteogenesis of the two cells have been indicated through different ways, few studies have systematically compared the osteogenic and angiogenic capability between M-BMSCs and F-BMSCs in vitro and in vivo. Considering that vascularization and bone formation are synchronized sequences through bone defect repairing, we hypothesize that the M-BMSCs possess better abilities for bone formation, which might be due to their better osteogenic and angiogenic capacities. To confirm this, we investigated the differences of osteogenic and angiogenic potential between M-BMSCs and F-BMSCs in the same osteoinductive culture media in vitro in the present study. Furthermore, we took β-tricalcium phosphate (β-Ca3(PO4)2, β-TCP) microspheres as biomaterials to load BMSCs, and compared their bone regeneration abilities as the seed cells in vivo.
2 Materials and methods
2.1 Isolation and culture in vitro
The two week old Sprague-Dawley (SD) rats were purchased from the SLAC Laboratory Animal Co. Ltd (Shanghai, China). All the animal experiments were performed in accordance with the guidelines and regulations for the care and use of laboratory animals of the National Institutes of Health. All procedures were approved by the Institutional Animal Care and Use Committee of Tongji University (Shanghai, China). Rats were sacrificed by cervical dislocation. To collect the M-BMSCs, we removed the soft tissue and periosteum from maxilla, and extracted the third molar. Then we flushed the bone marrow from the superior alveolar ridge, and collected it in the 6 cm cell culture dish with a complete α-MEM (Hyclone, USA) culture medium containing 1% penicillin/streptomycin (Hyclone, USA) and 10% (v/v) fetal bovine serum (FBS, Hyclone, Australia). The F-BMSCs were collected from the same animals.18,22 Cells were maintained at 37 °C in a humidified atmosphere of 5% CO2. Then they were allowed to plate for 3 days. After adherent cells reaching to 80–90% confluency, cells were trypsinised by 0.05% Trypsin-EDTA (1X) (Invitrogen, USA), counted and plated at 3 × 10⁵ cells per cm2. The culture medium was replaced every 48 h. The morphological characteristics of BMSCs were observed under inverted microscope for three generations.![[thin space (1/6-em)]](https://www.rsc.org/images/entities/char_2009.gif) 2/(logNt − logN0) (N: cell number, T: incubation time 0–t, t: time t, and 0: initial time).25 All experiments were performed in triplicate.
2/(logNt − logN0) (N: cell number, T: incubation time 0–t, t: time t, and 0: initial time).25 All experiments were performed in triplicate.2.2 Osteoblast differentiation assays
The 3rd generation of isolated BMSCs from maxillofacial and femur bones were counted and plated at 3 × 10⁴ cells per cm2 in 6-well plates, then cultured in complete osteogenic differentiation medium (Cyagen Biosciences, China) for 14 days. The culture was replaced every three days. All experiments below were performed in triplicate.| Gene | GenBank accession number | Primer sequence (5–3) |
|---|---|---|
| ALP | NM_013059.1 | 5-ACAATGAGATGCGCCCAGAG-3 |
| 5-CATGTACTTCCGGCCACCAC-3 | ||
| Runx2 | NM_053470.2 | 5-TTCGTCAGCGTCCTATCAGTTC-3 |
| 5-CTTCCATCAGCGTCAACACC-3 | ||
| FGF2 | NM_019305.2 | 5-GGCTCTACTGCAAGAACGGC-3 |
| 5-TAGTTTGACGTGTGGGTCGC-3 | ||
| TGFβ1 | NM_021578.2 | 5-CAGAACCCCCATTGCTGTCC-3 |
| 5-AAGACAGCCACTCAGGCGTA-3 | ||
| IGF2 | NM_001190162.1 | 5-AGTTTGTCTGTTCGGACCGC-3 |
| 5-GGAAGTACGGCCTGAGAGGT-3 | ||
| OCN | NM_013414.1 | 5-AACAATGGACTTGGAGCCCC-3 |
| 5-GAAGCCAATGTGGTCCGCTA-3 | ||
| VEGF | NM_031836.3 | 5-ACGAAAGCGCAAGAAATCCC-3 |
| 5-CGCGAGTCTGTGTTTTTGCA-3 | ||
| KDR | NM_013062.1 | 5-GCCAGCTCAGGTTTTGTGGA-3 |
| 5-CATGCCCTTAGCCACTTGGA-3 | ||
| HIF | NM_024359.1 | 5-GCAATTCTCCAAGCCCTCCG-3 |
| 5-ATCAGTGGTGGCAGTTGCG-3 |
2.3 Tube formation assay
In order to compare the angiogenic potential between the two kinds of BMSCs, Rat Brain Microvascular Endothelial Cells lines (BMECs) were cultured in the conditioned media from M-BMSCs and F-BMSCs for 3 days. Geltrex™ basement membrane matrix (BD Biosciences, USA) was added to a 24-well plate (300 μL per well) and incubated at 37 °C for 1 h, then BMECs were seeded onto the layer of Geltrex™ matrix and incubated at 37 °C for 12 h. Three random selected fields of view were captured and the length of tube-like structures was measured.21 In addition, the VRGF, KDR, and hypoxia-inducible factor (HIF) gene expression was analyzed by qRT-PCR. The primer sequences used for real-time PCR were shown in Table 1.2.4 Adipogenic differentiation assays
In order to compare the multipotent differentiation abilities of the two BMSCs, the adipogenic differentiation assay was performed along with the osteogenic differentiation assays. For adipogenic induction, the 3rd generation of isolated BMSCs from maxillofacial and femur bones were counted and plated at 3 × 10⁴ cells per cm2 in 24-well plates. When cells were confluent, adipogenic differentiation medium (Cyagen Biosciences, China) was used for three cycles of adipogenic treatments. Each consisted of 72 h incubation with adipogenic induction medium (stimulatory supplements including dexamethasone, indometacin 3-isobutyl-1-methylxanthine and insulin) and 24 h incubation with maintenance medium (stimulatory supplements including insulin). Then cells were fixed and stained with Oil Red O. The experiments were performed in triplicate.2.5 Fabrication of β-TCP microspheres
In the present study, the bioceramics of β-tricalcium phosphate (β-Ca3(PO4)2, β-TCP) microspheres with 120–150 μm were used as the bone grafts for maxillarydefect repairing. The β-TCP microspheres were fabricated according to our previous study. Briefly, the chemical precipitated β-TCP powders after being calcined at 800 °C for 2 h were used as the raw materials to fabricate the β-TCP microspheres via the spray-drying method on a high-speed centrifugal spray-drying machine (LGZ-8, Wuxi Dongsheng, China). The spray-dried β-TCP granules were collected and calcined at 900 °C for 3 h, and then cooled to room temperature in the furnace. Finally, the products were sieved to obtain the β-TCP microspheres with 100–120 mesh.31,322.6 Animal models
Forty female SD rats (body weight: 200 ± 10 g, age: approximately 8 weeks old, n = 40) were purchased from the SLAC Laboratory Animal Co. Ltd (Shanghai, China). Rats were randomly separated into four groups (n = 10 in each group): blank control (group B), β-TCP microspheres only (group T), β-TCP microspheres seeded with F-BMSCs (group F), and β-TCP microspheres seeded with M-BMSCs (group M). For each rat in the study group and the control group, the first left maxillary molar was extracted with a dental explorer under pentobarbital-induced general anesthesia, the removal defects were expanded to a uniform size (2 × 2 × 2.5 mm). For group B, the defect was directly sutured after debridement. For group T, the defect was filled with the β-TCP microspheres. For group F and group M, F-BMSCs and M-BMSCs seeded β-TCP microspheres were implanted into the defect respectively after co-culturing with BMSCs for 12 h. After surgery, rats were housed on a 12 h light/dark cycle with temperature of 25 °C maintained. In each group, 3 SD rats were randomly selected and used for μCT assay, and the other 3 rats were used for HE staining and immunohistochemistry assay. The rest rats were kept in case of sample damaging. While there was no sample lost or damaged in our study.2.7 Statistical analysis
The significance of differences was evaluated with a chi-square test using SPSS 20.0 software (IBM, USA). Difference of statistical data was considered significantly at a p-value < 0.05 (p < 0.05).3 Results
3.1 Morphology and flow cytometric analysis
Both of the two BMSCs isolated bone marrow stromal cells showed typical spindle-like fibroblastic morphology, and grew as helix in shape. F-BMSCs appeared aging at the 6th generation, while M-BMSCs appeared no remarkable morphological changes (Fig. 1a).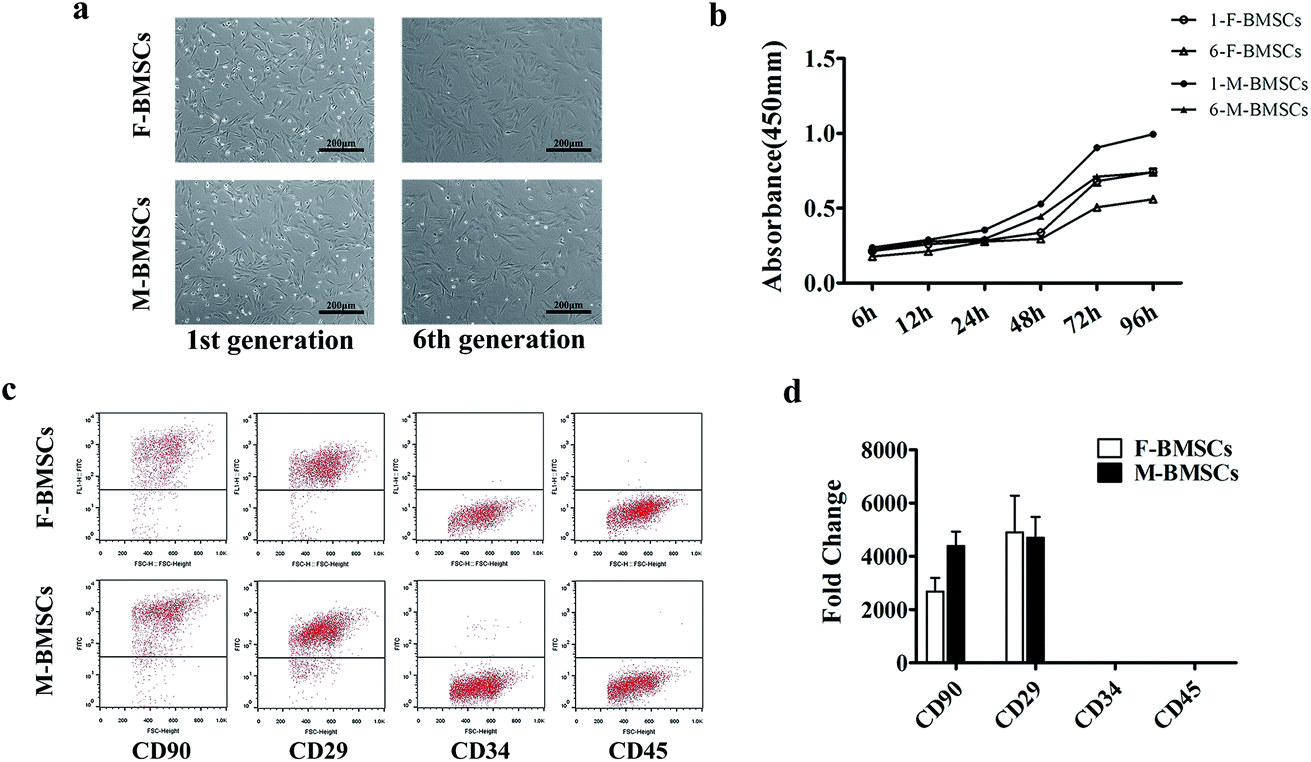 | ||
| Fig. 1 (a) Morphology of F-BMSCs and M-BMSCs in the 1st generation and 6th generation. (b) CCK-8 assay for cell proliferation. (c) Flow cytometric analysis. (d) The gene expression of the surface markers. | ||
From flow cytometric analysis and the real time polymerase chain reactions (qRT-PCR) analysis (Fig. 1c and d), both M-BMSCs and F-BMSCs were positive for CD29 and CD90, while negative for CD45 and CD34. These antibodies were routinely used for characterizing the mesenchymal stem cells and the surface antigens, which did not change after removal of cells from the substrate by trypsin.
3.2 Cell proliferation
CCK-8 assay was used for comparing the cell proliferation behaviors between M-BMSCs and F-BMSCs in this study at different generations. The OD value of M-BMSCs and F-BMSCs increased apparently with the increase of the culture time. In the 1st generation group, the proliferation rate of M-BMSCs showed much higher OD value than that of F-BMSCs through the entire culture period (p < 0.05), and the difference got bigger with the increase of the culture time. As for the 6th generation group, the proliferation rate was lower comparing to the 1st generation group (Fig. 1b). In addition, cell number in the 1st generation was counted (Fig. S1†). The results showed that cells entered exponential phase of growth after 24 h of culture, and then entered stationary phase after 72 h of culture. The calculated population doubling time (PDT) for M-BMSCs and M-BMSCs was 41.3 ± 3.2 h and 47.6 ± 4.5 h, respectively. The results indicated higher proliferation rate in M-BMSCs group (Table S1†).3.3 Multipotent differentiation assays
ALP was the early marker of osteogenic differentiation. In order to compare the osteogenic differentiation, F-BMSCs and M-BMSCs were cultured in osteogenic media for days 3, 7, 10 and 14. ALP staining was stronger in M-BMSCs than that in F-BMSCs at each point in time (Fig. 2a). In addition, the ALP activity also indicated that the ALP expression increased with the increase of the culture time, and peaked at day 10 (Fig. 2b). The expression of ALP activity was at a higher level in M-BMSCs than that in F-BMSCs throughout the osteoinductive process in vitro. Alizarin Red staining was further used for observing the mineral deposition of the cultured osteoblasts, and the results showed significant mineral nodes in M-BMSCs compared to F-BMSCs at day 14. The OD value also revealed higher osteogenic capability in M-BMSCs group in qualification (Fig. 2c).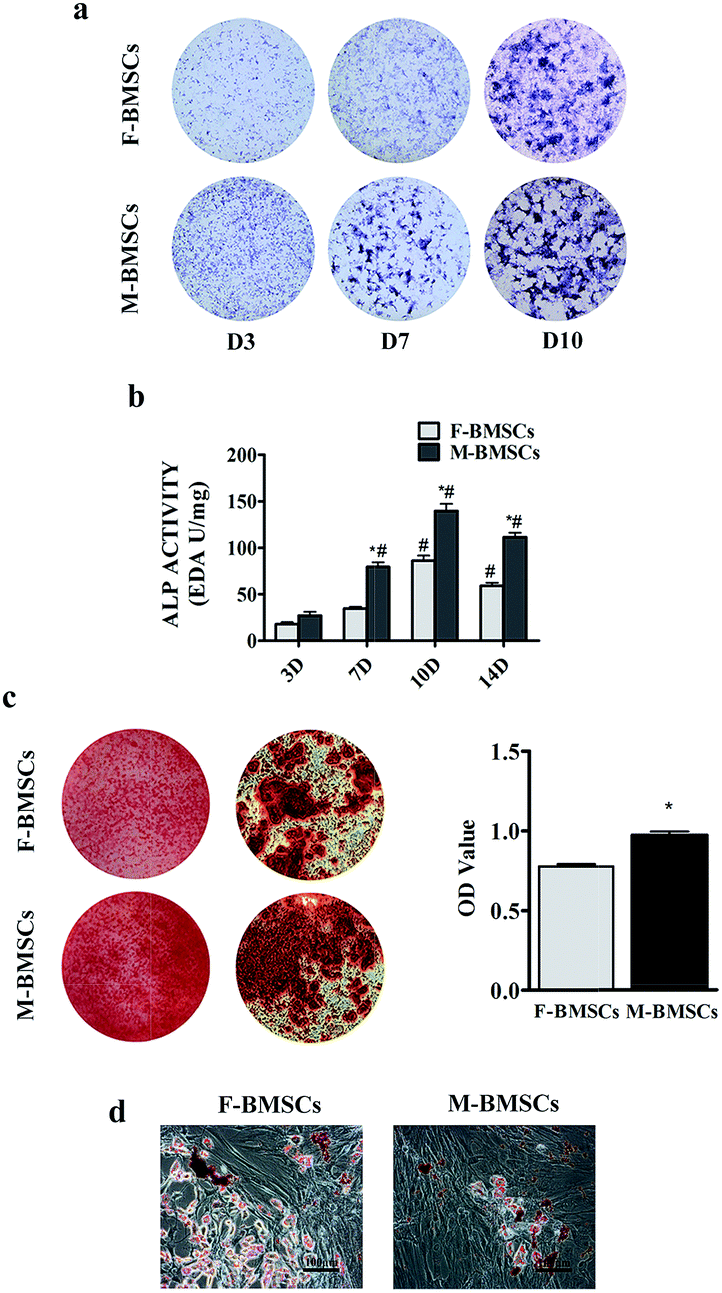 | ||
| Fig. 2 Multipotent differentiation assays: (a) ALP staining, (b) ALP activity, (c) Alizarin red staining (d) Oil Red O staining. *p < 0.05 indicates statistical significance between the M-BMSCs group and the F-BMSCs group; #p < 0.05 indicates the statistical significance between day 3 and the other time points in each group. | ||
Under the adipogenic conditions, accumulated lipid droplets appeared in F-BMSC group, whereas M-BMSC group contained less adipocytes (Fig. 2d).
3.4 Osteogenic and angiogenic differentiation in vitro
The qRT-PCR was used to examine the expression of bone-related genes such as ALP, Runx2, FGF2, TGFβ1, IGF2 and OCN, and angiogenic factors, such as VEGF and KDR on days 3, 7 and 14 (Fig. 3a). The gene expression of ALP and OCN increased apparently with the increase of culture time both in F-BMSCs and M-BMSCs groups. As for Runx2 in M-BMSCs group, with the increase of the culture time from day 3 to day 7, the expression level increased apparently, and then increased slightly with further increasing the culture time to day 14. While the Runx2 in F-BMSCs group decreased throughout the culture time. For FGF2, the gene expression decreased with the increase of the culture time in M-BMSCs group, while reached to highest in D7 in F-BMSCs group. For IGF2, M-BMSCs group had higher gene expression than that of F-BMSCs group in D3 and D14, while in D7, the gene expression was higher in F-BMSCs group. The expression of TGFβ1 was higher in M-BMSCs group in each time point. As for the angiogenesis-related genes, the expression of VEGF in M-BMSCs group decreased with the increase of the culture time. Comparing with F-BMSCs group, M-BMSCs group had higher VEGF expression. Moreover, KDR had relatively higher expression in M-BMSCs group while F-BMSCs group barely expressed this gene. Most importantly, both the osteogenic gene and angiogenic factor expression levels in the M-BMSCs group were significantly higher than those in the F-BMSCs group except the OCN at day 14 and VEGF at day 7.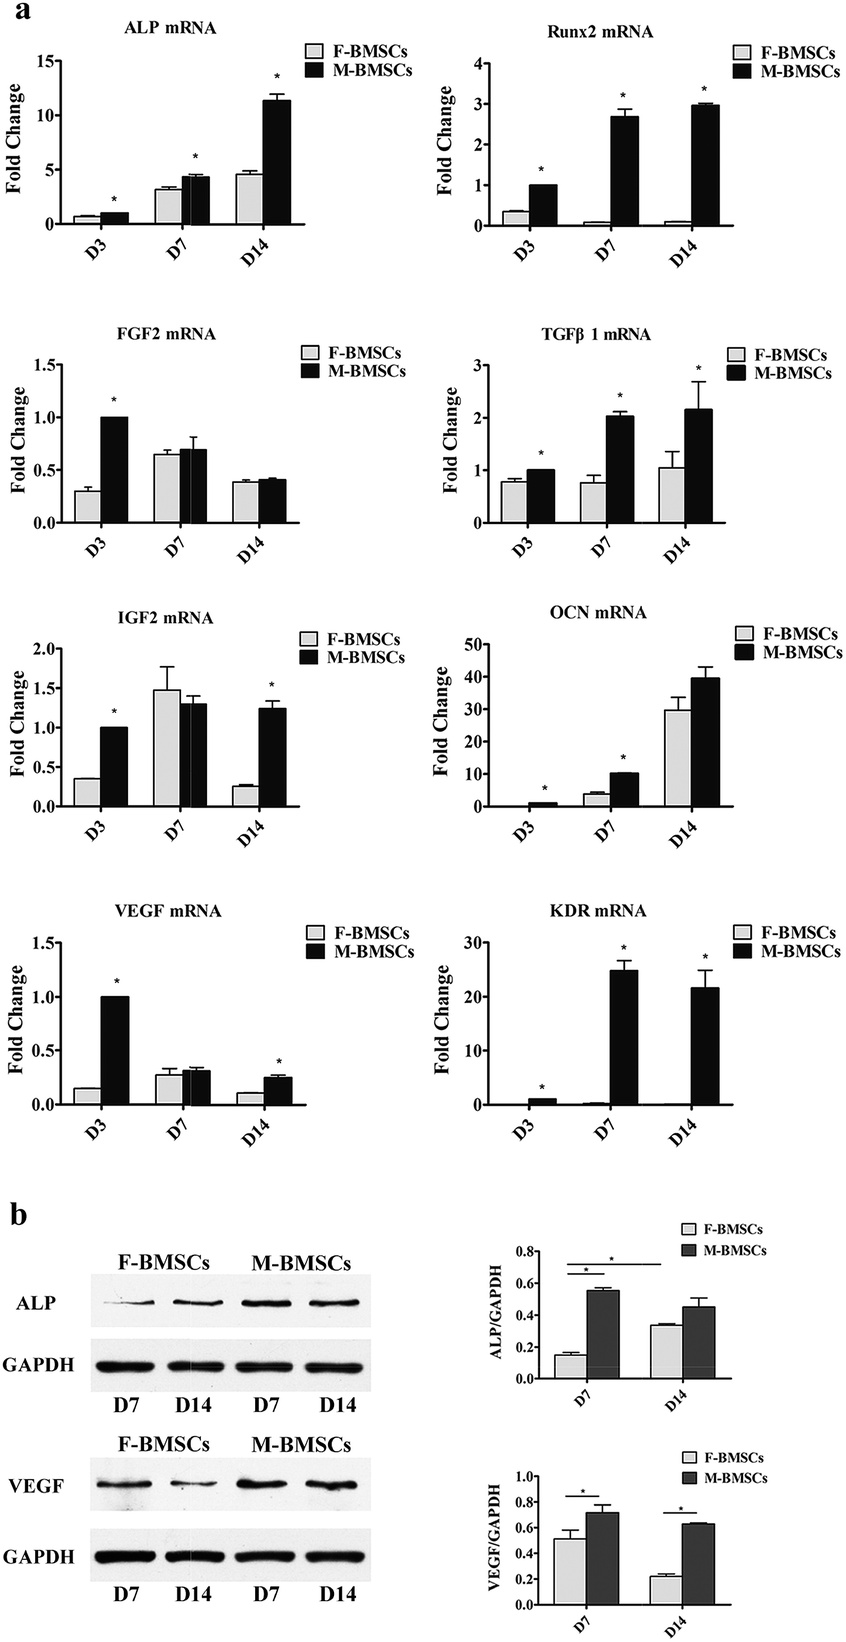 | ||
| Fig. 3 (a) The osteogenic and angiogenic gene expression analysis: osteogenic genes of ALP, Runx2, FGF2, TGFβ1, IGF2 and OCN and angiogenic genes of VEGF and KDR expressions. (b) Western blotting analysis for ALP and VEGF protein expressions. *p < 0.05 indicates statistical significance between M-BMSCs group and the F-BMSCs group. | ||
In order to measure the osteogenic and angiogenic protein expression levels, western blotting analysis was further used to determine the ALP and VEGF protein expression levels on days 7 and 14 (Fig. 3b). The results revealed that gray-scale values of ALP and VEGF for M-BMSCs group were higher than those for F-BMSCs group at each time point.
The angiogenic potential of the two BMSCs in vitro was further confirmed by co-cultured with rat brain microvascular endothelial cells (Fig. 4a). After 3 days of supernatant treatment from M-BMSCs (M + MEC group) and the F-BMSCs (F + MEC group), tube-like structures were evident, and the total tube length was significantly increased in the M + MEC group compared with F + MEC group. From the qRT-PCR assay, M-BMSCs contained higher angiogenic gene expression (Fig. 4b).
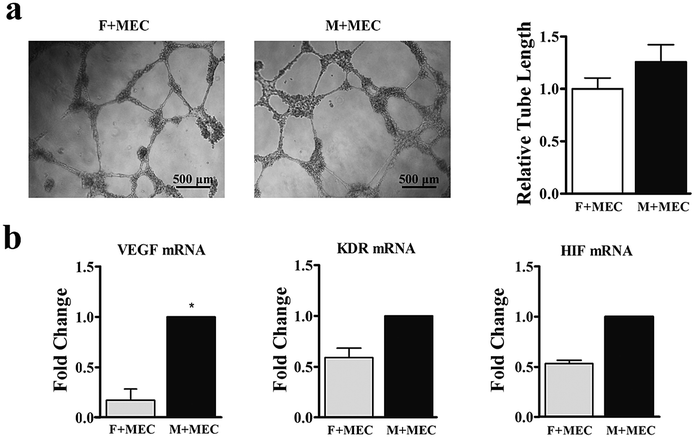 | ||
| Fig. 4 (a) Tube formation assay and quantitative analysis of tube length. (b) Relative gene expression of MEC after co-culture with M-BMSCs and F-BMSCs *p < 0.05 indicates statistical significance between M + MEC group and the F + MEC group. | ||
3.5 Characterizations of β-TCP microspheres
The SEM micrograph result showed that the samples were sphere-like shape (Fig. 5a). The XRD analysis revealed that microspheres were composed of higher crystalline and no second phase other than β-TCP (Fig. 5b).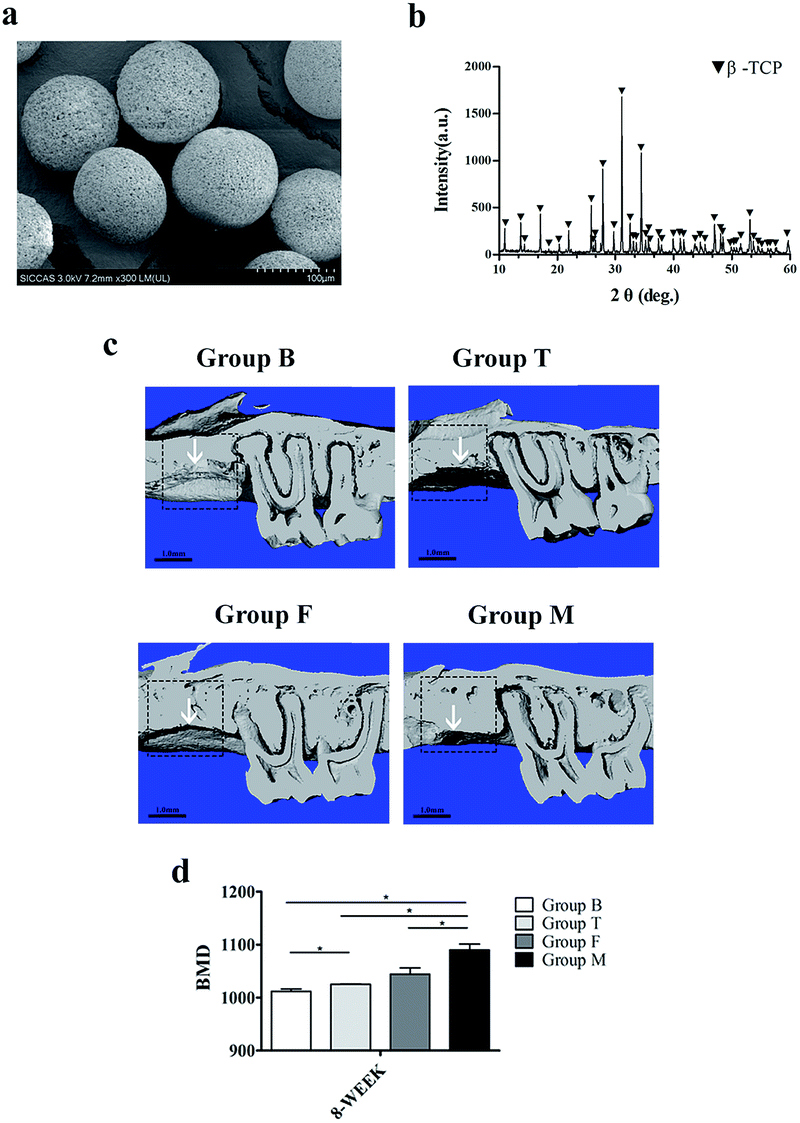 | ||
| Fig. 5 (a) SEM micrograph and (b) XRD patterns of the β-TCP microspheres. (c) Microcomputed tomography analysis for the reconstructed images of the four groups: group B; group T; group F; group M. (d) Bone histomorphometric analysis for bone mineral density. *p < 0.05 indicates statistical significance between the groups; the white arrow indicates the bone regeneration endpoint. | ||
3.6 Microcomputed tomography analysis
The μCT was used for tracking the new bone formation within the defects after surgery (Fig. 5c). Group M possessed better bone regeneration capacity compared with other three groups. Group F took the next place, while the group B showed the minimum bone formation was accompanied with periodontal bone loss. From the value of the bone mineral density (BMD) for each group, it seems that group M had significantly higher BMD compared with group F (Fig. 5d).3.7 Morphological and immunohistochemical analysis in vivo
HE staining was used to observe new bone formation for surgical bone defect (Fig. 6a and b). The HE staining images showed that alveolar bone crests were replaced by growth of connective tissues. In addition new vascular structure appeared in four groups. Apparent new bone formation could be found in group F and group M, and the relative new bone area was larger in group M. Positive ALP and VEGF immunoreactivities were detected in the four groups (Fig. 6c and d). From immunohistochemical analysis, it seems that group M still had active osteogenesis with higher ALP expression, while the group B contains more connective tissue with higher VEGF expression. The expression of ALP and VEGF between group F and group M had statistical significance.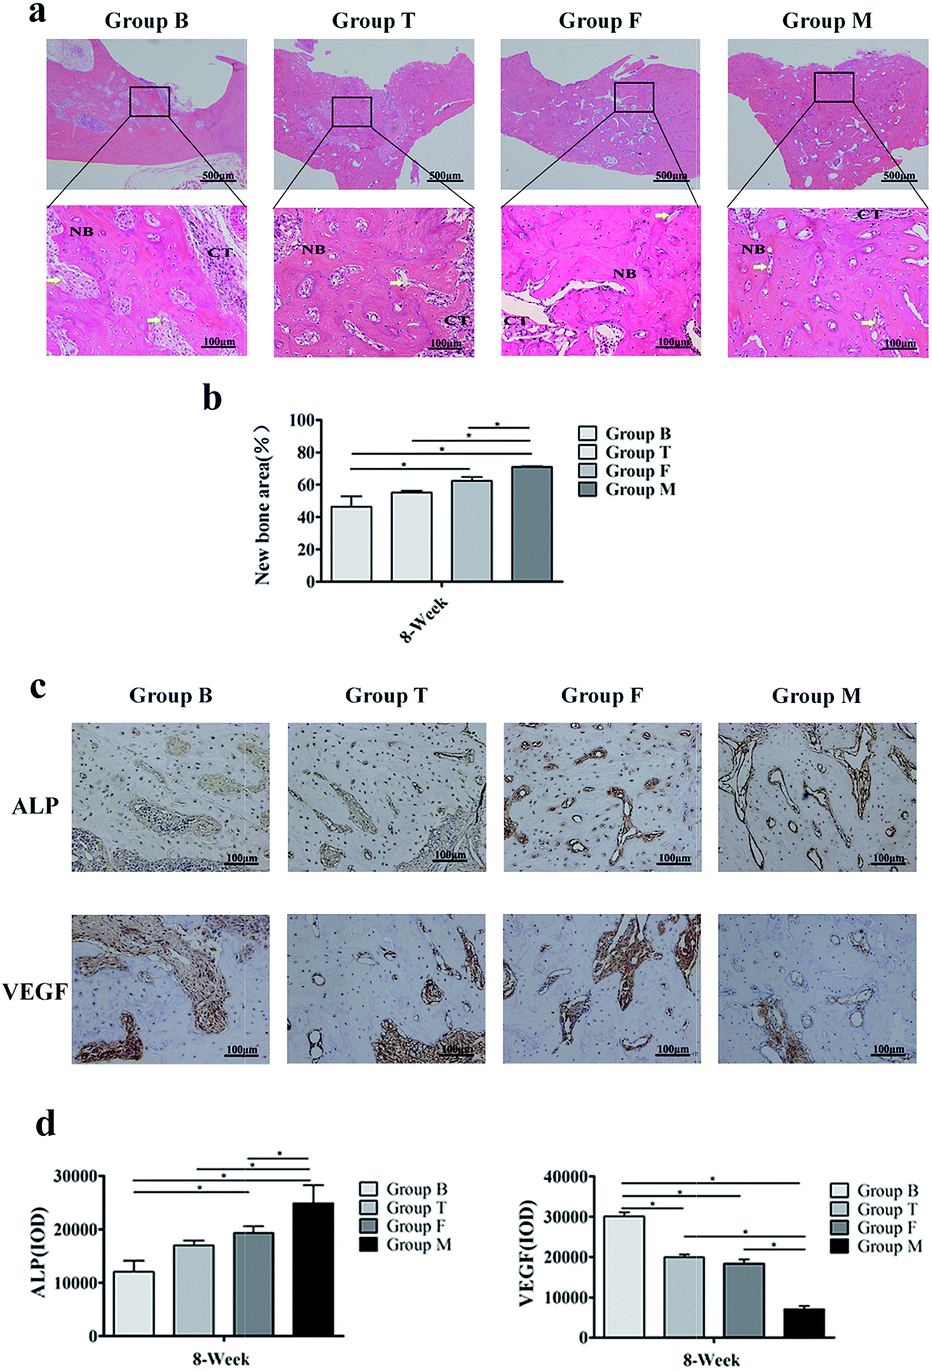 | ||
| Fig. 6 Morphological and immunohistochemical analysis of the extraction sites. (a) HE staining for low magnification and high magnification images with newly formed bone (NB), connective tissues (CT), the yellow arrows indicate the vascular tissue. (b) Quantification of new bone area at 8 weeks after tooth extraction. (c and d) Immunohistochemical analysis of ALP and VEGF expression. *p < 0.05 indicates statistical significance between the groups. | ||
4 Discussion
BMSCs contain the abilities to proliferate and differentiate into multi-lineage cells.34 Transplantation of BMSCs promotes new bone regeneration and is commonly used as seed cells in bone regeneration and bone tissue engineering applications. Unlike stromal cells from the limb bone, maxillofacial bone marrow derived cells have site-specific characters. The developmental and clinical difference between F-BMSCs and M-BMSCs implies different bone formation potential. Previous studies have shown that craniofacial BMSCs had superiority over BMSCs from the limb bone. However, most of these studies focus on cells osteogenesis capacity of in vitro. Along with osteogenic capability, BMSCs also secret VEGF in a differentiation dependent manner during osteogenesis.35Osteogenesis and vascularization are two important stages in bone tissue regeneration. Vasculature, which precedes bone formation, supplies osteoblast necessary nutrients and can regulate activity of osteoblasts.20,34 Meanwhile, the proliferation and differentiation of osteoblasts promote bone matrix deposition, leading to the formation of new bone tissues. As the candidate seed cells for bone formation, both of F-BMSCs and M-BMSCs contain osteogenesis and angiogenesis potentials. As far as we know, without research has been performed to systematically compare osteogenic and angiogenic capabilities between F-BMSCs and M-BMSCs. In order to choose the ideal seed cell sources, we studied and compared their cellular and histologic processes in vitro and in vivo.
In the present study, SPF level female SD rats of paired weight from the same family were used. Cells used in our in vitro and in vivo studies were also collected from the same SD rats. In the experiment procedure, we successfully isolated and cultured BMSCs from jaw bone and limb bone, respectively. The high purity of the cells was confirmed through flow cytometric analysis. BMSCs contain positive surface antigens, such as CD166, CD105, CD90, CD44, CD29 and CD13. CD79, CD45 and CD34 which were expressed in hematopoietic stem cells as well as bone marrow fibroblastic cells were negative in BMSCs.23,36 The different antigen levels might suggest they came from different sites.
Both of the two kinds of BMSCs contained stem cell state. Without significant morphology difference was observed between them until the 6th generation. F-BMSCs showed flat polygonal morphology at 6th generation. The CCK-8 assay also indicated lower proliferation rate in F-BMSCs at 6th generation. It revealed that M-BMSCs kept longer proliferation and different abilities when compared with F-BMSCs.37,38
In order to compare the osteogenic potential between F-BMSCs and M-BMSCs, the two BMSCs were cultured in the same osteoblast inducing medium to detect the determination of ALP activity and calcium deposition. As the early maker of osteogenic differentiation, ALP hydrolyze the pyrophosphate which promotes the bone mineralization, and promotes the formation of apatite,39 whereas calcium deposition marked the late stage of osteogenesis. We found that M-BMSCs had stronger ALP activity in the early stage of osteogenesis. The number of calcium node in M-BMSCs group was more than that in F-BMSCs group. It suggested that M-BMSCs contain better osteogenic potential. As a member of the stem cell family, BMSCs contains multipotent differentiation abilities. From the Oil Red O staining, F-BMSCs contained better adipogenic differentiation abilities.
Bone formation-related gene expressions including ALP, Runx2, FGF2, TGFβ1, IGF2 and OCN were further quantified by RT-PCR. In the present study, M-BMSCs showed significantly increased ALP, Runx2, FGF2, TGFβ1, IGF2 and OCN expression. Runx2 stimulates bone formation and osteoblast differentiation. FGF2 activates Runx2 by phosphorylation through Ras/MAPK/ERK pathway.40 And TGF-β1 and IGF2 enhances the proliferation of mesenchymal cells and osteoblasts in fractures as well as in experimental bone defects.41 As the most abundant collagenous protein in extracellular matrix, OCN involves in the later stages of osteogenesis and mineral formation.42 Compared with F-BMSCs, our in vitro study showed M-BMSCs with higher expression of these osteogenic factors entered into the later stage of bone formation earlier than F-BMSCs.
Under osteogenic induction condition, we found angiogenic factors including VEGF and KDR were expressed in the BMSCs. VEGF is a critical regulator in angiogenesis, and plays a significant role in skeletal growth. Previous studies had demonstrated that BMSCs tend to reside in perivascular and affect endothelial cells with growth factors and cytokines in a paracrine fashion.43 As the receptor of VEGF, KDR has strong tyrosine kinase activity and is the main receptor to activate various signaling pathways.44 The present study suggested that M-BMSCs and F-BMSCs promote vascularization along with bone formation. Higher expression of VEGF and KDR indicated better angiogenic potential for M-BMSCs. Moreover, the tube formation assay also confirmed that M-BMSCs promoted better angiogenesis compared to F-BMSCs. The result was further confirmed by VEGF and ALP on protein levels.
In order to further evaluate the osteogenic and angiogenic potential between F-BMSCs and M-BMSCs in bone defect regeneration applications, the BMSCs loaded β-TCP microspheres were implanted into the defect. The β-TCP microspheres with a higher specific surface area might play a suitable carrier to deliver the cells, and they are also suitable for cellular infiltration and proliferation.5 The results from μCT assay indicated that β-TCP contained ability to promote bone regeneration in vivo. It seems that the β-TCP microspheres has been absorbed after 8 weeks of the surgery.45 However, bone regeneration ability was more active in the groups loaded with BMSCs as seed cells. The mean BMD was significantly higher in M-BMSCs group compared with F-BMSCs group and β-TCP group. To further confirm this, histologic examination was performed. From HE staining and immunohistochemical analysis, the percentage of new bone area and the ALP expression were statistically higher in M-BMSCs group. It seems that M-BMSCs as seed cells have better capability to accelerate the bone healing in vivo, and the result was in consistent with the studies in vitro.
In addition, the development and formation of new bone is accompanied with vascular ingrowth. The vessel in connective tissue provides necessary factors, such as growth factors, cytokines, and chemokines for bone marrow. Along with bone defect healing process, the connective tissue was gradually replaced by new bone.46 From HE staining analysis, it seems that blood vessel in connective tissue decreased in BMSCs groups. The immunohistochemical analysis of VEGF expression also confirmed this tendency, as VEGF was only highly expressed during the early phase of bone defects regeneration.47 It seems that M-BMSCs group is in a more mature stage of bone regeneration after 8 weeks of the surgery.
Taken together, the in vivo study proves that M-BMSCs contains better osteogenic and angiogenic capability as seed cells in mandibular bone regeneration and bone tissue engineering applications. However, whether the osteogenic potential of M-BMSCs is still better when applied for the restoration of any other site bone defects should be further investigated in details.
5 Conclusions
Seed cells serve as the important part in bone tissue engineering for clinic applications. The present studies demonstrated that M-BMSCs presents better osteogenic capability and higher secretion level of angiogenic factors than F-BMSCs in the same culture medium, and contained better bone regeneration capacity as seed cells in the process of maxillary defect restoration. The results enhanced our understanding of seed cells, and helped us to choose the ideal seed cells for patients with maxillary bone defect and to develop new approaches for therapy.Conflicts of interest
There are no conflicts to declare.Acknowledgements
The authors gratefully acknowledge the support of the Natural Science Foundation of China (No. 81672134, 81371129, 81670973), Science and Technology Commission of Shanghai Municipality (No. 15441905300, 17510710800), and the Fund of Shanghai Municipal Commission of Health and Family Planning (grant No. 201540369).Notes and references
- L. Zhao, J. Li, L. Zhang, Y. Wang, J. Wang, B. Gu, J. Chen, T. Hao, C. Wang and N. Wen, RSC Adv., 2016, 6, 62071–62082 RSC.
- Y. Yu, S. Hua, M. Yang, Z. Fu, S. Teng, K. Niu, Q. Zhao and C. Yi, RSC Adv., 2016, 6, 110557–110565 RSC.
- N. Cui, J. Qian, J. Wang, Y. Wang, W. Xu and H. Wang, RSC Adv., 2016, 6, 97096–97106 RSC.
- J. Mitra, G. Tripathi, A. Sharma and B. Basu, RSC Adv., 2013, 3, 11073 RSC.
- J. Jia, W. Siheng, C. Fang, A. Chengchong and C. Shiyi, RSC Adv., 2016, 6, 41800–41808 RSC.
- J. M. Seong, B. C. Kim, J. H. Park, I. K. Kwon, A. Mantalaris and Y. S. Hwang, Biomed. Mater., 2010, 5, 535–547 CrossRef PubMed.
- M. Tatullo, M. Marrelli and F. Paduano, Int. J. Med. Sci., 2014, 12, 72–77 CrossRef PubMed.
- K. Lin, L. Xia, H. Li, X. Jiang, H. Pan, Y. Xu, W. W. Lu, Z. Zhang and J. Chang, Biomaterials, 2013, 34, 10028–10042 CrossRef CAS PubMed.
- Y. Xiao, S. Mareddy and R. Crawford, Int. J. Oral Sci., 2010, 02, 127–135 Search PubMed.
- H. Ohnishi, Y. Oda and H. Ohgushi, Sci. Technol. Adv. Mater., 2010, 11, 014110 CrossRef PubMed.
- C. Seebach, D. Henrich, A. Schaible, B. Relja, M. Jugold, H. Bönig and I. Marzi, Tissue Eng., Part A, 2015, 21, 1565–1578 CrossRef CAS PubMed.
- Y. Xu, Z. Wu, X. Dong and H. Li, RSC Adv., 2017, 7, 5306–5314 RSC.
- A. J. Gaggl, H. K. Burger and F. M. Chiari, Br. J. Oral Maxillofac. Surg., 2008, 46, 211–217 CrossRef PubMed.
- A. Gaggl, H. Bürger, S. Virnik, P. Schachner and F. Chiari, Cleft Palate Craniofac. J., 2012, 49, 305–313 CrossRef PubMed.
- Y. Ichikawa, J. Watahiki, T. Nampo, K. Nose, G. Yamamoto, T. Irie, K. Mishima and K. Maki, J. Periodontal Res., 2015, 50, 468–478 CrossRef CAS PubMed.
- A. Abzhanov, S. J. Rodda, A. P. McMahon and C. J. Tabin, Development, 2007, 134, 3133–3144 CrossRef CAS PubMed.
- T. L. Aghaloo, T. Chaichanasakul, O. Bezouglaia, B. Kang, R. Franco, S. M. Dry, E. Atti and S. Tetradis, J. Dent. Res., 2010, 89, 1293–1298 CrossRef CAS PubMed.
- S. O. Akintoye, P. Giavis, D. Stefanik, L. Levin and F. K. Mante, Clin. Oral Implants Res., 2008, 19, 1197–1201 CrossRef PubMed.
- W. Dong, J. Ge, P. Zhang, Y. Fu, Z. Zhang, J. Cheng and H. Jiang, Cell Tissue Res., 2014, 358, 165–175 CrossRef CAS PubMed.
- J. M. Kanczler and R. O. C. Oreffo, Eur. Cells Mater., 2008, 15, 100–114 CrossRef CAS PubMed.
- Y. Du, F. Jiang, Y. Liang, Y. Wang, W. Zhou, Y. Pan, M. Xue, Y. Peng, H. Yuan, N. Chen and H. Jiang, J. Mol. Histol., 2016, 47, 153–168 CrossRef CAS PubMed.
- A. Smajilagić, M. Aljičević, A. Redžić, S. Filipović and A. Lagumdžija, Bosnian J. Basic Med. Sci., 2013, 13, 27 CrossRef PubMed.
- M. F. Pittenger, A. M. Mackay, S. C. Beck, R. K. Jaiswal, R. Douglas, J. D. Mosca, M. A. Moorman, D. W. Simonetti, S. Craig and D. R. Marshak, Science, 1999, 284, 143–147 CrossRef CAS PubMed.
- X. Xing, K. Cheng, W. Cheng, T. Zhou, J. Min and J. Xu, J. Pharm. Biomed. Anal., 2016, 129, 466–472 CrossRef PubMed.
- A. J. Rahyussalim, J. A. Pawitan, A. R. Kusnadi and T. Kurniawati, Medical Journal of Indonesia, 2016, 25, 10 CrossRef.
- M. M. Bradford, Anal. Biochem., 2015, 72, 248–254 CrossRef.
- J. Baharara, E. Amini, M. A. Kerachian and M. Soltani, Iran. J. Basic Med. Sci., 2014, 17, 626–631 Search PubMed.
- Y. Zhou, Y. Wu, X. Jiang, X. Zhang, L. Xia, K. Lin and Y. Xu, PLoS One, 2015, 10, 172–174 Search PubMed.
- A. Zaminy, K. I. Ragerdi, M. Barbarestani, A. Hedayatpour, R. Mahmoudi and N. A. Farzaneh, Iran. Biomed. J., 2008, 12, 133 CAS.
- J. Fafiánlabora, P. Fernándezpernas, I. Fuentes, T. J. De, N. Oreiro, S. Sangiaoalvarellos, J. Mateos and M. C. Arufe, Sci. Rep., 2015, 5, 16765 CrossRef PubMed.
- K. Lin, J. Chang, J. Lu, W. Wu and Y. Zeng, Ceram. Int., 2007, 33, 979–985 CrossRef CAS.
- K. Lin, L. Chen, H. Qu, J. Lu and J. Chang, Ceram. Int., 2011, 37, 2397–2403 CrossRef CAS.
- X. Gong, W. Yu, H. Zhao, J. Su and Q. Sheng, Sci. Rep., 2017, 7, 36129 CrossRef CAS PubMed.
- R. A. Carano and E. H. Filvaroff, Drug Discovery Today, 2003, 8, 980–989 CrossRef CAS PubMed.
- H. Mayer, H. Bertram, W. Lindenmaier, T. Korff, H. Weber and H. Weich, J. Cell. Biochem., 2005, 95, 827–839 CrossRef CAS PubMed.
- R. J. Deans and A. B. Moseley, Exp. Hematol., 2000, 28, 875–884 CrossRef CAS PubMed.
- S. F. H. D. Witte, E. E. Lambert, A. Merino, T. Strini, H. J. C. W. Douben, L. O'Flynn, S. J. Elliman, A. J. E. M. M. d. Klein, P. N. Newsome and C. C. Baan, Cytotherapy, 2017, 19, 798–807 CrossRef PubMed.
- M. Dhanasekaran, S. Indumathi, R. P. Lissa, R. Harikrishnan, J. S. Rajkumar and D. Sudarsanam, Cytotechnology, 2013, 65, 187 CrossRef CAS PubMed.
- U. Sharma, D. Pal and R. Prasad, Indian J. Clin. Biochem., 2014, 29, 269–278 CrossRef CAS PubMed.
- K. Y. Choi, H. J. Kim, M. H. Lee, T. G. Kwon, H. D. Nah, T. Furuichi, T. Komori, S. H. Nam, Y. J. Kim and H. J. Kim, Dev. Dyn., 2005, 233, 115 CrossRef CAS PubMed.
- L. S. Beck, E. P. Amento, Y. Xu, L. Deguzman, W. P. Lee, T. Nguyen and N. A. Gillett, J. Bone Miner. Res., 1993, 8, 753 CrossRef CAS PubMed.
- J. H. Lee, J. H. Park, A. El-Fiqi, J. H. Kim, Y. R. Yun, J. H. Jang, C. M. Han, E. J. Lee and H. W. Kim, Acta Biomater., 2014, 10, 2750–2761 CrossRef CAS PubMed.
- M. Gnecchi, Z. Zhang, A. Ni and V. J. Dzau, Circ. Res., 2008, 103, 1204–1219 CrossRef CAS PubMed.
- L. Claesson-Welsh, Biochem. Soc. Trans., 2011, 437, 169–183 Search PubMed.
- F. Monchau, A. Lefèvre, M. Descamps, A. Belquinmyrdycz, P. Laffargue and H. F. Hildebrand, Biomol. Eng., 2002, 19, 143–152 CrossRef CAS PubMed.
- K. Tatsuyama, Y. Maezawa, H. Baba, Y. Imamura and M. Fukuda, Eur. J. Histochem., 2000, 44, 269–278 CAS.
- S. Ohtsubo, M. Matsuda and M. Takekawa, Histol. Histopathol., 2003, 18, 153–163 CAS.
Footnote |
| † Electronic supplementary information (ESI) available: Grows curve of M-BMSCs and F-BMSCs in the 1st generation; average population doubling time. See DOI: 10.1039/c7ra07139f |
| This journal is © The Royal Society of Chemistry 2017 |