 Open Access Article
Simultaneous removal of PM and NOx over highly efficient 3DOM W/Ce0.8Zr0.2O2 catalysts†
Ying Cheng‡
,
Weiyu Song‡,
Jian Liu *,
Zhen Zhao
 and
Yuechang Wei
State Key Laboratory of Heavy Oil Processing, China University of Petroleum, Beijing 102249, China. E-mail: liujian@cup.edu.cn; Fax: +86-10-6974721; Tel: +86-10-89732278
First published on 15th December 2017
Abstract
Herein, three-dimensional ordered macropore (3DOM) x% W/Ce0.8Zr0.2O2 (x = 0.5, 0.8, 1, 3) catalysts were prepared and employed for the simultaneous removal of PM (particulate matter) and NOx from diesel engine exhaust. The contact between the solid PM and the catalyst active site was strengthened by the special 3DOM structure. 3DOM 0.8% W/Ce0.8Zr0.2O2 had superior catalytic activity with a maximum concentration of CO2 at 408 °C and nearly 100% NO conversion at 378–492 °C, and also presented high catalytic activity even under a high space velocity of 50![[thin space (1/6-em)]](https://www.rsc.org/images/entities/char_2009.gif) 000 h−1. Furthermore, the stability of the catalyst was excellent even after aging at 900 °C for 5 h. The large amount of chemisorbed oxygen species, good low temperature reduction performance as well as abundant acid sites enhanced the catalytic efficiency for simultaneous PM and NOx abatement over the 3DOM 0.8% W/Ce0.8Zr0.2O2 material; this is a promising catalyst for application in exhaust purification.
000 h−1. Furthermore, the stability of the catalyst was excellent even after aging at 900 °C for 5 h. The large amount of chemisorbed oxygen species, good low temperature reduction performance as well as abundant acid sites enhanced the catalytic efficiency for simultaneous PM and NOx abatement over the 3DOM 0.8% W/Ce0.8Zr0.2O2 material; this is a promising catalyst for application in exhaust purification.
1. Introduction
Contrary to gasoline engines, diesel engines have become extremely popular due to their relevance for excellent fuel economy and potential for reliability and durability.1–4 Particulate matter (PM) and nitrogen oxides (NOx) released from diesel engines can lead to severe environmental and health problems and directly produce acid rain and photochemical smog. In the past few years, many of the technologies for NOx and PM elimination have been used to meet the increasingly stringent emission regulations, and catalytic purification is considered a potential approach due to its high efficiency. The usability of a catalyst with high performance is the core of this technology.Nowadays, the abatement of PM and NOx from diesel engines is often performed by a separate after-treatment technique such as the widespread use of DPF (Diesel Particulate Filters) and SCR (Selective Catalytic Reduction) technology.5–11 The filter system has been through three generations. Generation 1 used Pt-based oxidation catalysts to eliminate HC and CO emissions and also needed a base-metal fuel additive that promoted PM combustion. Generation 2 only used Pt-based oxidation catalysts to eliminate pollutants. Generation 3 was designed by Johnson Matthey in 2005 and involved a single small cordierite filter. HC and CO were oxidized by the catalyst through normal driving; PM was burned by the increased temperature caused by the oxidation of extra partially burnt fuel during active regenerations. All these processes were cumbersome and expensive.12 To achieve extremely high performance for abatement, combinations of noble metals with the other catalysts have been used.13,14 Nascimento et al. reported that the Ru-modified Ce0.4Zr0.6O2 catalyst was a high performance catalyst for PM oxidation reactions in the temperature range of 220–500 °C.15 The Mn-promoted Pd0.5/TiO2–Al2O3 catalyst for SCR reaction of NOx by H2 (H2-SCR) was also reported by Duan et al.16 However, the high costs and limited supply of these noble metals restrict their application in viable commercial products. To avoid using the noble metals, new catalysts are greatly desired, especially in a relatively low temperature range, and the search for these continues.17 CeO2 is one of the core components of three-way catalysts, which supplies abundant ability to store oxygen on account of the redox cycling between Ce3+ to Ce4+; however, pure CeO2 is not fit for these applications owing to its high redox temperature (700 °C) and the decrease in surface area for sintering. By introducing Zr or zirconium oxide into CeO2, the thermal stability and oxygen storage ability may be remarkably enhanced.18 WO3 is regarded as a dominant component for NH3-SCR such as V2O5–WO3 supported on TiO2 anatase,19,20 which can increase the amount of oxygen vacancies and reactive sites. In addition, the employment of WO3 also affects the catalyst by enhancing the surface acidity, which may be beneficial for the adsorption of NH3. Therefore, we investigated the design and use of the non-noble metal bifunctional catalyst W/Ce0.8Zr0.2O2 as a monolithic catalytic cleaner to achieve the simultaneous abatement of PM and NOx.
In a heterogeneous catalysis reaction, efficient contact is very important for highly catalytic performance. PM combustion typically belongs to the three-phase edge reaction, which proceeds in several gas reactants (O2, NO, NO2) and solid reactants (catalyst and PM). Thus, effective contact between PM and catalyst is vital to excellent catalytic PM oxidation performance. Therefore, the catalyst design is significant for the improvement of the contact between the catalyst active sites and PM.21 As is well known, the limitation of these conventional catalysts is that there are smaller pore sizes (<10 nm) than the PM (>25 nm).22–24 The PM cannot be allowed to transfer and diffuse in the internal spaces of the catalysts, and only the outer space of the catalyst can be effectively utilized. In this work, three-dimensionally ordered macropore (3DOM) catalysts have been synthesized with orderly inter-connected macroporous structure to offer more channels and also boost the mass transfer and reactant diffusion,25,26 thus improving the contact between the PM and catalyst active sites and dramatically enhancing the catalytic performance. Moreover, the temperature for PM combustion can be lowered and it can lead to greater energy-saving and economic benefits.
To overcome the drawbacks of the traditional process, a fourth generation filter system used in a single catalytic converter that can replace the otherwise separate catalytic DPF and SCR steps has been put forward. Based on the properties and the distinct features, 3DOM x% W/Ce0.8Zr0.2O2 catalysts have been synthesized and employed as monolithic catalytic cleaners for the simultaneous removal of PM and NOx; their physico-chemical properties and highly catalytic performances have also been investigated.
2. Experimental
2.1 Synthesis of 3DOM catalysts
The monodisperse polymethyl methacrylate (PMMA) microspheres with average diameter of about 330 nm were synthesized according to the previously reported procedure.27,28 3DOM Ce0.8Zr0.2O2 mixed-oxide was synthesized by means of the carboxy-modified colloidal crystal templating method (CMCCT). ZrOCl2·8H2O, (NH4)6H2W12O40·4H2O and Ce(NO3)3·6H2O were used as the metal precursors. ZrOCl2·8H2O and Ce(NO3)3·6H2O were dissolved together in a mixture of deionized water, ethylene glycol (EG) and methanol (EOH) (with the volume ratio of 10![[thin space (1/6-em)]](https://www.rsc.org/images/entities/char_2009.gif) :
:![[thin space (1/6-em)]](https://www.rsc.org/images/entities/char_2009.gif) 7
7![[thin space (1/6-em)]](https://www.rsc.org/images/entities/char_2009.gif) :
:![[thin space (1/6-em)]](https://www.rsc.org/images/entities/char_2009.gif) 3) by vigorously stirring for 40 min to obtain the mixed solution. After stirring, dry PMMA was permeated by the mixed solution for about 12 h to achieve full impregnation. The solution was vacuum filtered to clear up the remaining solution and the vacuum oven was utilized to dry the precipitate overnight at 50 °C, followed by calcination in air for 10 h, heating from 30 to 550 °C with a heating rate of 1 °C min−1, generating 3DOM Ce0.8Zr0.2O2 oxide.
3) by vigorously stirring for 40 min to obtain the mixed solution. After stirring, dry PMMA was permeated by the mixed solution for about 12 h to achieve full impregnation. The solution was vacuum filtered to clear up the remaining solution and the vacuum oven was utilized to dry the precipitate overnight at 50 °C, followed by calcination in air for 10 h, heating from 30 to 550 °C with a heating rate of 1 °C min−1, generating 3DOM Ce0.8Zr0.2O2 oxide.
x% W/Ce0.8Zr0.2O2 samples were synthesized by impregnating Ce0.8Zr0.2O2 with an aqueous solution of ammonium metatungstate (NH4)6H2W12O40·4H2O containing x% W, followed by drying in air at 100 °C for 12 h and then calcining in air at 500 °C for 5 h. These samples were denoted as 3DOM x% W/Ce0.8Zr0.2O2 (x = 0.5, 0.8, 1, 3).
A similar procedure was applied to synthesize the pristine 0.8% W/CeO2 and 0.8% W/ZrO2 samples.
2.2 Characterization
X-ray diffraction (XRD) was conducted to verify the crystal structure and composition presented in the 3DOM materials. XRD patterns were obtained using a Shimadzu XRD 6000 with Cu Kα radiation operated at 10 mA and 40 kV and recorded at 0.02° intervals in the range 5–90° with a rate of 4° min−1. The obtained XRD data were indexed using the standard JCPDS cards (Joint Committee on Powder Diffraction Standards). The Scherrer equation was used to calculate the crystal sizes of the samples.Nitrogen adsorption–desorption isotherms were obtained at a liquid N2 temperature (−196 °C) to investigate the textural properties of the catalysts using an automatic TriStarII 3020 instrument. Before the nitrogen adsorption measurements, each catalyst underwent vacuum pre-treatment at 350 °C for 3 h.
The microstructure and morphology of the catalysts were determined by transmission electron microscopy (TEM) and scanning electron microscopy (SEM).
Raman spectra were used to investigate the catalyst structures; an inVia Reflex-Renishaw spectrometer was used with the anti-Stokes range of 100–2000 cm−1. A He–Gd laser (excitation wavelength of 532 nm) was used as the excitation source.
X-ray photoelectron spectra (XPS) of these samples were obtained on an XPS PHI-1600 ESCA using Mg Kα (hν = 1253.6 eV) as the X-ray source. The C 1s peak (binding energy, BE = 284.8 eV) was employed as standard to determine the BE of Ce 3d and O 1s.
In NH3-TPD, the samples were pre-treated with N2 at 600 °C for 1 h, then cooled to 30 °C and further to achieve saturation with high purity NH3, then flushed with N2 to purge the physisorbed NH3. Finally, NH3-TPD operation was performed from 60 to 600 °C at a 10 °C min−1 heating rate.
Prior to H2-TPR analysis, 100 mg of sample was pre-treated under Ar atmosphere at 300 °C for 1 h to clean up carbon dioxide and adsorbed water, then cooled to room temperature. The catalyst bed was exposed to 10% H2/Ar flow (40 mL min−1) while the temperature was increased from 100 to 1000 °C at the rate of 10 °C min−1.
In situ diffuse reflectance infrared Fourier transform (DRIFT) spectra were recorded on a FTIR spectrometer (Thermo Nicolet Is50), equipped with a high temperature environmental cell and a MCT detector cooled by liquid N2. The catalyst was put in the Harrick IR cell and heated to 400 °C to purge the impurities under N2 atmosphere with the flow rate of 100 mL min−1 for 60 min. The background spectrum was collected under flowing N2 atmosphere, and was subtracted from the sample spectra. DRIFT spectra were recorded by accumulating 32 scans with the resolution of 4 cm−1.
2.3 Catalyst activity
For simultaneous PM-NOx removal, PM oxidation and NH3-SCR catalytic tests were undertaken in a continuous-flow fixed-bed reactor with a quartz tube. Printex-U was utilized to simulate PM. The average grain size and surface area for Printex-U were 25 nm and 100 m2 g−1, respectively. Before each catalytic activity test, the catalyst and Printex U with a 10![[thin space (1/6-em)]](https://www.rsc.org/images/entities/char_2009.gif) :
:![[thin space (1/6-em)]](https://www.rsc.org/images/entities/char_2009.gif) 1 mass ratio were mixed using a spatula to achieve loose contact, which resembled an actual pollutant state emitted from diesel engines.29 The mixture was put between quartz wool plugs in a quartz tubular reactor. The reaction gases consisted of 1000 ppm NH3, 1000 ppm NO, 5% H2O (when used) and 3% O2 with N2 as the balance gas. The gas hourly space velocity (GHSV) was 25
1 mass ratio were mixed using a spatula to achieve loose contact, which resembled an actual pollutant state emitted from diesel engines.29 The mixture was put between quartz wool plugs in a quartz tubular reactor. The reaction gases consisted of 1000 ppm NH3, 1000 ppm NO, 5% H2O (when used) and 3% O2 with N2 as the balance gas. The gas hourly space velocity (GHSV) was 25![[thin space (1/6-em)]](https://www.rsc.org/images/entities/char_2009.gif) 000 h−1 with a flow rate of 100 mL min−1 at standard pressure and temperature. The catalytic test for the optimal catalyst was also performed at higher GHSV by decreasing the amount of the catalyst. The online IR spectroscopy (Thermo Is50 FTIR) was employed to detect the outlet concentrations of NH3, NO, NO2, N2O and CO2. The sample was first swept by N2 with a flow rate of 100 mL min−1 for about 45 min before obtaining a background IR spectrum of the reactor effluent. Afterwards, effluent IR spectra were recorded for the reactor feed including 1000 ppm NH3, 1000 ppm NO, 3% O2 in N2. Activity tests were conducted from 30 to 600 °C at a rate of 3 °C min−1. The catalyst stability was evaluated by repeatedly evaluating its performance in this manner. In another run, 10 mg Printex U was mixed with the catalyst. The potential impact of the mass transfer limitations for the reaction was ruled out and verified by applying the Koros–Nowak criterion to calculate the reaction rates.
000 h−1 with a flow rate of 100 mL min−1 at standard pressure and temperature. The catalytic test for the optimal catalyst was also performed at higher GHSV by decreasing the amount of the catalyst. The online IR spectroscopy (Thermo Is50 FTIR) was employed to detect the outlet concentrations of NH3, NO, NO2, N2O and CO2. The sample was first swept by N2 with a flow rate of 100 mL min−1 for about 45 min before obtaining a background IR spectrum of the reactor effluent. Afterwards, effluent IR spectra were recorded for the reactor feed including 1000 ppm NH3, 1000 ppm NO, 3% O2 in N2. Activity tests were conducted from 30 to 600 °C at a rate of 3 °C min−1. The catalyst stability was evaluated by repeatedly evaluating its performance in this manner. In another run, 10 mg Printex U was mixed with the catalyst. The potential impact of the mass transfer limitations for the reaction was ruled out and verified by applying the Koros–Nowak criterion to calculate the reaction rates.
For PM oxidation, the temperatures for the maximal PM combustion rate (denoted as Tm) in the CO2 concentration profiles were applied to determine the performances of different catalysts. The capability of the catalyst for NOx reduction was evaluated by NO conversion and N2 selectivity, which are defined by the following equations:
where [NO]inlet, [NO]outlet, [NH3]inlet and [NH3]outlet are assigned to the inlet and outlet concentrations of NO and NH3 at a steady-state, respectively.
3. Results
3.1 The catalytic activity of W/Ce0.8Zr0.2O2 for simultaneous PM and NOx removal
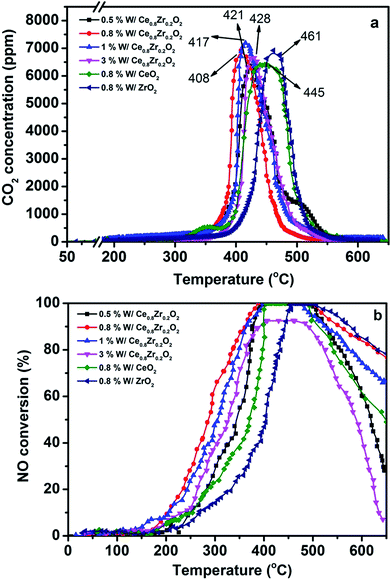
Fig. 1a shows PM oxidation over 3DOM x% W/Ce0.8Zr0.2O2 (x = 0.5, 0.8, 1, 3) catalysts. All catalysts exhibited accelerating PM oxidation trends with the lower reaction temperature. Tm for PM combustion without catalyst was at about 585 °C.30 Highly catalytic activity (in terms of Tm values) was reached at 408 °C for 3DOM 0.8% W/Ce0.8Zr0.2O2 catalyst. As compared to 3DOM x% W/Ce0.8Zr0.2O2 (x = 0.5, 1, 3), Tm for those catalysts were 421, 417, 428 °C (in Table S1†), respectively.Fig. 1b displays NH3-SCR activity over 3DOM x% W/Ce0.8Zr0.2O2 catalysts. 3DOM 0.5% W/Ce0.8Zr0.2O2 showed complete NO conversion at 402–496 °C. However, when more W was added, NO conversion was different. 100% NO conversion for 3DOM 0.8% W/Ce0.8Zr0.2O2 catalyst could be reached at 378–492 °C. When the W amount was controlled at 1%, NO conversion was also significantly lowered. With the increase of the W amount to 3%, NO conversion decreased, and only about 80% NO conversion from 350 to 520 °C could be detected. The operation temperature window for 3DOM 0.8% W/Ce0.8Zr0.2O2 catalyst was the widest among all 3DOM x% W/Ce0.8Zr0.2O2 catalysts. The 3DOM 0.8% W/Ce0.8Zr0.2O2 catalyst afforded highly catalytic activity for PM combustion and NO reduction with a Tm at 408 °C and a 100% NO conversion in the temperature range 378–492 °C. Moreover, N2 selectivity for all 3DOM x% W/Ce0.8Zr0.2O2 catalysts was very high as shown in Fig. S1.†
Based on the above results, 0.8% was used as the optimal W amount and its effect for simultaneous PM and NOx elimination was further compared to pristine 3DOM 0.8% W/CeO2 and 0.8% W/ZrO2. The catalytic PM combustion temperature for 3DOM 0.8% W/CeO2 and 0.8% W/ZrO2 was 445 and 461 °C, respectively. NO conversion observed by 3DOM 0.8% W/CeO2 was 398–485 °C, and a higher and narrow catalytic NO conversion temperature window centered at about 472–526 °C was found for 3DOM 0.8% W/ZrO2. The catalytic activity exhibited that a strong interaction between Ce–Zr solid solution and W species may have possibly existed in the 3DOM 0.8% W/Ce0.8Zr0.2O2 catalyst and it should play a vital role in the excellent performance of 3DOM x% W/Ce0.8Zr0.2O2 catalysts.
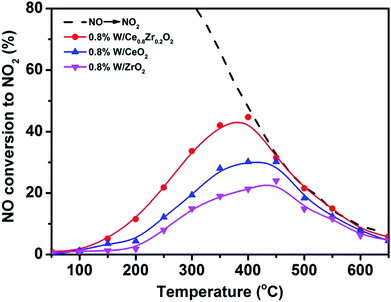
NO2 is a radical chemical compound that oxidizes more easily than oxygen, thus promoting PM oxidation. The oxidation ability for NO to NO2 with O2 over 3DOM catalysts is also important for the simultaneous removal and the results are shown in Fig. 2. For all samples, the conversion of NO to NO2 increased with the increase of the temperature, and it slowly decreased after reaching the maximum conversion. The maximum conversion of 44% was obtained at 400 °C over 3DOM 0.8% W/Ce0.8Zr0.2O2. In comparison, for other catalysts, the temperature of maximum conversion moved to the higher temperature region. 3DOM 0.8% W/Ce0.8Zr0.2O2 catalyst showed superior activity in the oxidation of NO to NO2, which was beneficial for enhancing the PM combustion and improving the rate of NOx removal via the fast SCR reaction.31–33
3.2 Influence of GHSV and H2O
Traditional catalysts are usually coated on a particulate filter substrate. Thus, the effective GHSV of the coated filter would be around 8 times. Usually GHSV of 50![[thin space (1/6-em)]](https://www.rsc.org/images/entities/char_2009.gif) 000 to 100
000 to 100![[thin space (1/6-em)]](https://www.rsc.org/images/entities/char_2009.gif) 000 h−1 are applied in emission control devices for diesel engines. For 3DOM 0.8% W/Ce0.8Zr0.2O2 catalyst, the monolithic 3DOM catalyst was designed and as a whole applied to removing PM and NOx from diesel engine exhaust. The catalyst seems to not need to be coated with DPF to activate the catalyst-driven continuous regeneration. Thus, the effective GHSV is kept.
000 h−1 are applied in emission control devices for diesel engines. For 3DOM 0.8% W/Ce0.8Zr0.2O2 catalyst, the monolithic 3DOM catalyst was designed and as a whole applied to removing PM and NOx from diesel engine exhaust. The catalyst seems to not need to be coated with DPF to activate the catalyst-driven continuous regeneration. Thus, the effective GHSV is kept.
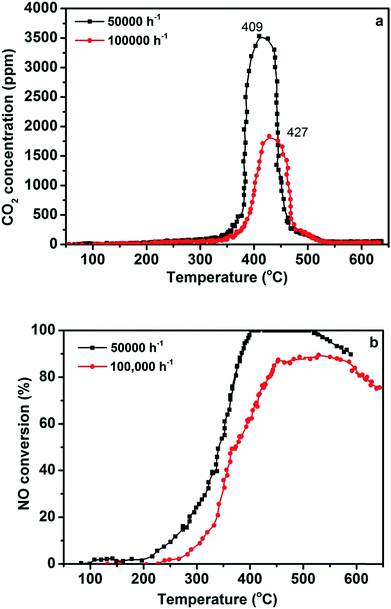
Different GHSV values are also important for practical application; the effect of different GHSV values on the efficiency of simultaneous abatement over the 3DOM 0.8% W/Ce0.8Zr0.2O2 catalyst is displayed in Fig. 3. It was noted that GHSV from 50![[thin space (1/6-em)]](https://www.rsc.org/images/entities/char_2009.gif) 000 to 100
000 to 100![[thin space (1/6-em)]](https://www.rsc.org/images/entities/char_2009.gif) 000 h−1 led to the sharp decrease of NO conversion. The 3DOM 0.8% W/Ce0.8Zr0.2O2 catalyst showed 100% NO conversion in a relatively limited temperature window 399–517 °C at high GHSV of 50
000 h−1 led to the sharp decrease of NO conversion. The 3DOM 0.8% W/Ce0.8Zr0.2O2 catalyst showed 100% NO conversion in a relatively limited temperature window 399–517 °C at high GHSV of 50![[thin space (1/6-em)]](https://www.rsc.org/images/entities/char_2009.gif) 000 h−1. Only 85% (maximal value) of NO conversion could be found in that temperature range at GHSV of 100
000 h−1. Only 85% (maximal value) of NO conversion could be found in that temperature range at GHSV of 100![[thin space (1/6-em)]](https://www.rsc.org/images/entities/char_2009.gif) 000 h−1. On the other hand, the maximum temperature range for PM combustion was 409–427 °C. Although the efficiency of the 3DOM 0.8% W/Ce0.8Zr0.2O2 catalyst decreased in a high GHSV, it still exhibited positive activity for PM and NO removal.34
000 h−1. On the other hand, the maximum temperature range for PM combustion was 409–427 °C. Although the efficiency of the 3DOM 0.8% W/Ce0.8Zr0.2O2 catalyst decreased in a high GHSV, it still exhibited positive activity for PM and NO removal.34
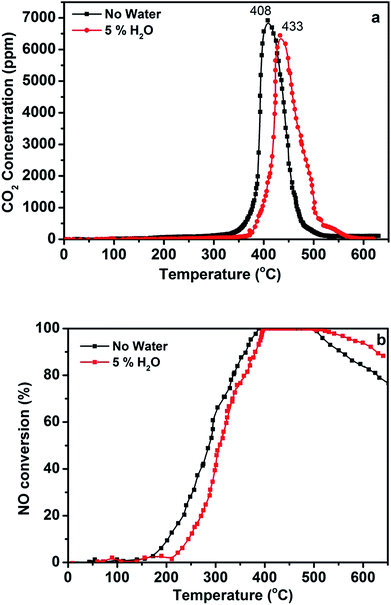
Water in the reactant gas is an important variable for the emission control of catalysts in humid conditions. Therefore, the catalytic performance of the 3DOM 0.8% W/Ce0.8Zr0.2O2 catalyst was detected for simultaneous abatement in the presence of 5% H2O, and the result is shown in Fig. 4. When there was no water, the optimal 3DOM 0.8% W/Ce0.8Zr0.2O2 catalyst was effective for 100% NO reduction at 378–492 °C and for completely oxidizing PM to CO2 at about 408 °C. When 5% H2O was introduced into the simulated exhaust gases, the activity of the catalyst for PM oxidation and NO conversion was changed slightly. The 3DOM 0.8% W/Ce0.8Zr0.2O2 catalyst was effective for reducing NO by 100% conversion in the range of 395–517 °C and for completely oxidizing PM to CO2 at about 433 °C. In actual diesel vehicle exhaust treatment, H2O has an obvious effect on the catalytic behavior. As shown in Fig. 4, the presence of H2O significantly decreased NO reduction in the low temperature, which may be ascribed to competitive adsorption on the acid sites between H2O and NH3. It also increased NO reduction at high temperature, which may be due to NH3 oxidation being inhibited by H2O.
3.3 Catalytic stability
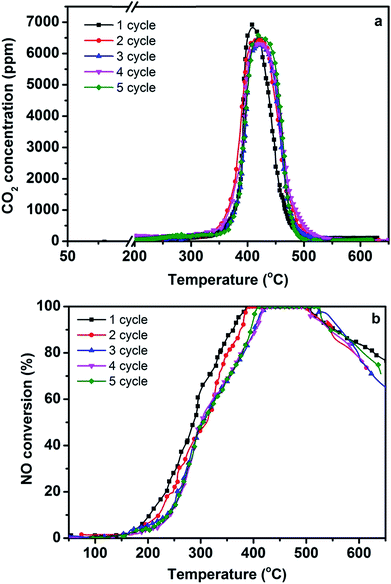
For clarification of the stability of the 3DOM 0.8% W/Ce0.8Zr0.2O2 catalyst, the catalytic activities for 5-cycle runs were tested. As seen from Fig. 5, the 3DOM 0.8% W/Ce0.8Zr0.2O2 catalyst maintained excellent catalytic performance, and the Tm for PM combustion and 100% NO conversion did not significantly change after 5-cycle runs. The 3DOM 0.8% W/Ce0.8Zr0.2O2 catalyst can be re-used with no obvious activity loss. It may be useful in the commercial application life of the catalyst.3.4 The results of XRD and BET analysis
Fig. 6 shows XRD patterns of the 3DOM 0.8% W/CeO2 and x% W/Ce0.8Zr0.2O2 catalysts. No phase attributed to the W species could be detected in all catalysts, indicating the minor grain size or the high dispersion of W species. For 3DOM 0.8% W/ZrO2, the main pattern exhibited diffraction peaks regarding monoclinic ZrO2 at 24.3°, 28.3°, 31.3°, and tetragonal ZrO2 was detected at 30.3°, 50.4°, 60.2°. With regard to 3DOM 0.8% W/CeO2 and x% W/Ce0.8Zr0.2O2 samples, all the diffraction peaks corresponded well to CeO2 (PDF no. 43-1002), while for 3DOM x% W/Ce0.8Zr0.2O2 samples, the main peak corresponding to the (111) crystal face showed a slight shift. It was mainly due to Zr4+ being easy to incorporate into the CeO2 crystal lattice, since the ionic radius of Zr4+ (0.086 nm) is similar to that of Ce4+ (0.101 nm). The 3DOM x% W/Ce0.8Zr0.2O2 catalysts exhibited the weaker and broader diffraction peaks and a little lower XRD peak intensity than that of 3DOM 0.8% W/CeO2, which was due to the decrease in the crystallinity.35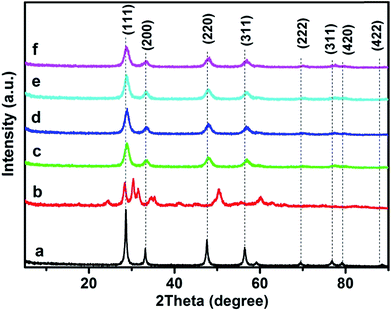 | ||
| Fig. 6 XRD patterns of 3DOM catalysts (a) 0.8% W/CeO2 (b) 0.8% W/ZrO2 (c) 0.5% W/Ce0.8Zr0.2O2 (d) 0.8% W/Ce0.8Zr0.2O2 (e) 1% W/Ce0.8Zr0.2O2 (f) 3% W/Ce0.8Zr0.2O2. | ||
N2 adsorption–desorption curves of 3DOM 0.8% W/CeO2 and x% W/Ce0.8Zr0.2O2 materials are shown in Fig. S2.† A sharp increase of the H3 loop between the 0.8 and 1.0 P/P0 range of each sample indicated the macroporous structure.36 BET analysis of 3DOM materials is summarized in Table S2.† The surface area of the 3DOM 0.8% W/CeO2 and 0.8% W/ZrO2 samples was 20.6 and 22.4 m2 g−1, respectively, whereas it was 32.3 m2 g−1 for the 0.8% W/Ce0.8Zr0.2O2 sample, which was much higher than those of 3DOM 0.8% W/CeO2 and 0.8% W/ZrO2 catalysts. The macroporous structure is conducive to providing massive inner area as well as pore volume, and it also promotes the transfer and diffusion of PM in those catalysts.37 Hence, the 3DOM x% W/Ce0.8Zr0.2O2 catalyst may give effective catalytic performance for the simultaneous abatement of PM and NOx.
3.5 The results of Raman spectroscopy characterization
In Fig. S3,† the Raman spectra for 3DOM 0.8% W/CeO2 and x% W/Ce0.8Zr0.2O2 catalysts display a dominant peak at 464 cm−1, which could be ascribed to the F2g mode of the fluorite type lattice. For the 3DOM 0.8% x% W/Ce0.8Zr0.2O2 catalyst, the intensity of the characteristic F2g mode of CeO2 decreased, which corresponded well to XRD analysis, indicating the low degree of crystallization on the 3DOM x% W/Ce0.8Zr0.2O2 catalyst. The main Raman band shift could also be detected for x% W/Ce0.8Zr0.2O2 catalysts, which may be attributed to the close interaction between the Ce–Zr and W species. 3DOM 0.8% W/ZrO2 showed characteristic bands at 349, 380, 561 and 619 cm−1 for monoclinic ZrO2 as well as the bands at 318, 478 and 645 cm−1 ascribed to tetragonal ZrO2.38 For the 3DOM 0.8% W/ZrO2 sample, two obvious peaks centered at 274 and 321 cm−1 were found, which were related to the characteristic bands of the m-WO3 phase.39 Peaks centered at 274, 714, 806 and 968 cm−1 assigned to the m-WO3 phase were detected on the 3% W/Ce0.8Zr0.2O2 sample. Considering the previous report by Peng et al., the loading of the W species in 3DOM 0.8% W/CeO2 and x% W/Ce0.8Zr0.2O2 (x = 0.5, 0.8, 1) probably existed as the amorphous phase.40 Under these circumstances, it is rational that there is no obvious peak ascribed to W species in those samples.3.6 The results of SEM
Fig. S4† displays the typical SEM images of 3DOM 0.8% W/CeO2, 0.8% W/ZrO2 and 0.8% W/Ce0.8Zr0.2O2 catalysts. All materials presented a high quality 3DOM architecture. Highly ordered macroporous structures were retained through the long-range replication of the 3D close-packed PMMA template.41 The macropore sizes and wall thicknesses of the catalysts were about 330 ± 20 nm and 30–40 nm, respectively. A clear observation was that all the samples had unvarying wall thickness, windows and aperture, and those macropores possessed a highly periodic arrangement and interconnection with the small windows. The next level was also clear in SEM images and strongly interconnected through the opening windows. After the loading of W, the structure of 3DOM was not changed, indicating that the introduction of W did not remarkably affect 3DOM structure formation.3.7 The results of TEM
The morphologies of 3DOM 0.8% W/CeO2, 0.8% W/ZrO2 and 0.8% W/Ce0.8Zr0.2O2 samples were further observed from their TEM images, shown in Fig. 7. TEM results on the formation of a high quality 3DOM catalyst were in agreement with the SEM images. The next layer was also visible in the TEM images and were strongly interconnected through the opening windows. After analyzing the lattice fringe of those samples, only lattice planes (0.310 and 0.273 nm) corresponding to the separation of the (111) and (200) lattice planes of CeO2 could be detected for 3DOM 0.8% W/CeO2 and 0.8% W/Ce0.8Zr0.2O2 samples. For the 3DOM 0.8% W/ZrO2 sample, the lattice spacing (d = 0.322 nm) assigned to (110) of ZrO2, and the crystal face of WO3 ascribed to (020) (d = 0.375 nm) were observed,42 indicating that there were some WO3 on the surface of ZrO2, which corresponded well to the Raman analysis.3.8 The results of XPS analysis
XPS is an efficient means for characterizing the metal oxide states, the formation of surface elements and adsorbed oxygen species of the materials. Fig. 8 shows XPS spectra of Ce 3d, O 1s for 3DOM 0.8% W/CeO2, 0.8% W/ZrO2 and 0.8% W/Ce0.8Zr0.2O2 catalysts, and the corresponding experimental data are presented in Table 1.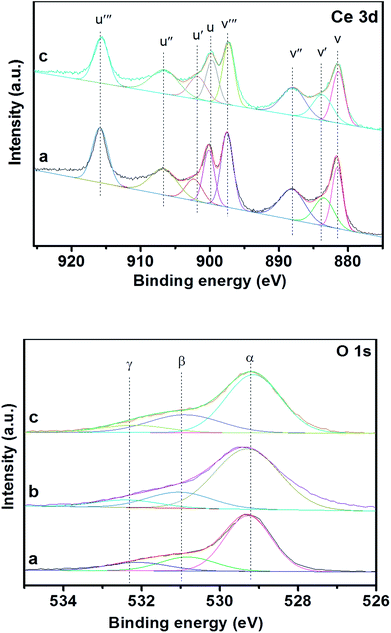 | ||
| Fig. 8 XPS curves of Ce 3d, O 1s for 3DOM catalysts (a) 0.8% W/CeO2 (b) 0.8% W/ZrO2 (c) 0.8% W/Ce0.8Zr0.2O2. | ||
| Catalyst | Ce speciesa | O speciesa | ||||
|---|---|---|---|---|---|---|
| Ce3+ | Ce4+ | Rb | Adsorbed oxygen | Lattice oxygen | ||
| (O− + O2−) | O2− | Rc | ||||
| a Determined by the peak area of surface species in XPS spectra.b Ratio of Ce species of Ce3+/Ce4+.c Ratio of the peak area of adsorbed oxygen (O− + O2−) to lattice oxygen (O2−)Oads/Olatt. | ||||||
| 0.8 W/CeO2 | 16.6 | 83.4 | 19.9 | 32.6 | 67.4 | 0.484 |
| 0.8 W/ZrO2 | 27.7 | 72.2 | 0.383 | |||
| 0.8 W/Ce0.8Zr0.2O2 | 18.8 | 81.2 | 23.1 | 35.2 | 64.8 | 0.543 |
Ce 3d was numerically assigned to eight components for each sample, and the corresponding assignments were labeled as V (881.5 eV), V′ (883.9 eV), V′′ (888.0 eV), V′′′ (897.3 eV), U (899.9 eV), U′ (901.9 eV), U′′ (906.7 eV), U′′′ (915.8 eV). The sub-bands centered V, V′′, V′′′, U, U′′, U′′′ were related to the 3d104f0 state of the Ce4+ species, and the sub-bands labeled V′ and U′ represented the 3d104f1 state of the Ce3+ species. The surface ratio of Ce3+/Ce4+ and Oads/Olatt had an important implication for the improvement of the performance of the materials. To make a quantitative analysis of the spectra of Ce 3d presented in Table 1, one could observe the minor discrepancy in the surface Ce3+/Ce4+ ratio between 3DOM 0.8% W/CeO2 and 0.8% W/Ce0.8Zr0.2O2 catalysts, due to the different supports. Among the 3DOM samples, the surface Ce3+/Ce4+ ratio in 3DOM 0.8% W/Ce0.8Zr0.2O2 was much higher than that in 3DOM 0.8% W/CeO2. It was reported by Wei et al.43 that the existence of Ce3+ was related to the oxygen vacancies and promoted the adsorption and activation of oxygen species. An increase in Ce3+ was beneficial for the improvement of the oxygen vacancies and relatively high mobility of the bulk oxygen species.44–46 Hence, the 3DOM 0.8% W/Ce0.8Zr0.2O2 sample may possess excellent catalytic activity.
Fig. 8 also displays the XPS spectra of O 1s of 3DOM 0.8% W/CeO2, 0.8% W/ZrO2 and 0.8% W/Ce0.8Zr0.2O2 catalysts. Based on the curve peak-fitting deconvolution, three species of surface oxygen were identified. The BE of α (529.4 eV) was attributed to the lattice oxygen (O2−), and β (531.86 eV) and γ (533.2 eV) were assigned to chemically adsorbed oxygen (O−, O2−), respectively. It is well-known that the surface adsorbed oxygen is thought to be the dominant active oxygen species, due to its better mobility than the lattice oxygen. Meanwhile, gas phase oxygen participates in the SCR reaction by filling the oxygen vacancies on the surface of the catalyst and then helps the “fast SCR” reaction to promote NO reduction activity.47 Thus, the surface Oads/Olatt ratio could partly reflect the active oxygen species in the reaction and also have a positive effect on the catalytic performance of the materials. It was noted in Table 1 that the 3DOM 0.8% W/Ce0.8Zr0.2O2 sample possessed the highest Oads/Olatt ratio, giving an indication that the sample should contain more electrophilic oxygen species, which was in agreement with the observations in BET analysis. Moreover, the different amounts of Oads/Olatt for 3DOM 0.8% W/CeO2, 0.8% W/ZrO2 may be derived from the inner difference of the CeO2 and ZrO2. The abundant oxygen defects were prone to absorbing O2 to form the active oxygen species, which was in favour of the enhancement of the performance for PM oxidation reactions.
3.9 The results of H2-TPR and NH3-TPD
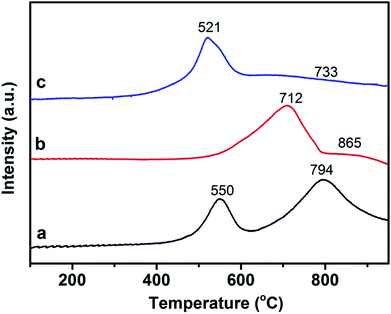
The intrinsic redox properties of the materials are related to the simultaneous PM combustion and NO reduction reaction. The good oxidation properties directly lead to the high PM combustion efficiency. The excellent reduction performance is conducive to promoting NOx abatement from diesel engines. Therefore, the catalyst should possess excellent redox performance for the simultaneous removal reaction. H2-TPR analysis is a powerful tool for dissecting the reducibility and oxygen species mobility of the samples. For metallic oxide catalysts the reducibility of the metallic ion with high valence being converted to low valence, and the absorption or release oxygen as well as the species of the absorbed or activated oxygen can also be reflected. The reduction of 3DOM 0.8% W/CeO2, 0.8% W/ZrO2, 0.8% W/Ce0.8Zr0.2O2 catalysts were performed using the H2-TPR technique, as showed in Fig. 9. Two distinguished reduction peaks located at 550 and 794 °C were detected for 3DOM 0.8% W/CeO2. The first stage could be ascribed to the outermost layer reduction of Ce4+ to Ce3+ ions and capping oxygen, and the second may be associated with the inner Ce4+ layer reduction and the lattice oxygen. The reduction behavior of 0.8% W/ZrO2 was quite different from that of 0.8% W/CeO2. Two broad peaks in the high temperature range appeared for the 3DOM 0.8% W/ZrO2 catalyst. The former at 712 °C could be associated with the oxygen species of ZrO2 reduction.48 The latter at 865 °C was probably assigned to the WOx species reduction, and the peaks presenting at higher temperatures (over 700 °C) could be assigned to the amorphous tetrahedral WOx species reduction.49 Interestingly, after the introduction of Zr ions into CeO2, the first stage at 521 °C could be assigned to the outermost layer reduction of Ce4+ to Ce3+ ions and capping oxygen, and the second, located at 733 °C, may be associated with the inner Ce4+ layer reduction and the lattice oxygen. The initial reduction peaks shifted to lower temperature, indicating that the mobility of the surface oxygen species was improved by W loading. At the same time, the peak located at high temperature also shifted to lower temperature, due to Zr dopant, indicating that the mobility of lattice oxygen should also be greatly improved, and the bond strength between W and Ce–Zr should become weaker due to their interaction. This means that 3DOM 0.8% W/Ce0.8Zr0.2O2 was easily reduced by hydrogen and the sample presented excellent redox properties.50PM combustion is a typically deep oxidation reaction, the intrinsic redox performance of catalysts plays a major role in PM oxidation.37 Topsøe51 proposed a catalytic cycle for the SCR reaction, referring to both acid–base and redox functions. Previous studies by Lietti et al. indicated that the NH3-SCR catalyst with redox functions dominated the catalytic performance.52,53 Therefore, the superior redox properties of 8% W/Ce0.8Zr0.2O2 may be in favor of SCR activity and PM combustion.
In addition to the redox properties, the surface acidity of the catalysts is also vital for the simultaneous removal reaction, especially for NO conversion.40 The surface acidity of 3DOM 0.8% W/CeO2, 0.8% W/ZrO2 and 0.8% W/Ce0.8Zr0.2O2 catalysts were measured by NH3-TPD and are illustrated in Fig. S5.† A distinctly broad desorption peak was detected, which occurred in a wide temperature range from 100 to 500 °C, indicating that the addition of W promoted the surface acidity of the catalysts. The desorption peak at lower temperatures (100–220 °C) was proven to originate from the desorption of ammonia that was physically adsorbed to weak acid sites, while the desorption peak at 220–500 °C was attributed to strong acid sites, and could determine the properties of the acid sites. There was an NH3 desorption peak at 197 °C for 3DOM 0.8% W/CeO2 and at 201 °C for 3DOM 0.8% W/ZrO2, whereas the same peak at 181 °C could be found for 3DOM 0.8% W/Ce0.8Zr0.2O2. After introducing Zr into the support, the acidity and amount of the catalyst increased, and the NH3 desorption peak of 3DOM 0.8% W/Ce0.8Zr0.2O2 was stronger than those of 3DOM 0.8% W/CeO2 and 0.8% W/ZrO2, suggesting the interaction between the Ce–Zr and W species. Furthermore, the NH3-TPD curve of 3DOM 0.8% W/Ce0.8Zr0.2O2 showed a larger area than those of the 3DOM 0.8% W/CeO2 and 0.8% W/ZrO2 samples at high temperatures, indicating that there were abundant surface acid sites; thus, more acid sites promoted NO reduction activity.42
3.10 The results of the co-adsorption of NH3
In situ DRIFT measurements were utilized to discuss NH3 desorption properties on the catalysts. In situ DRIFT of NH3 adsorption was conducted to detect the variation of acidity on the catalyst and the results are presented in Fig. 10. The bands at 1159 and 1313 cm−1 were related to the coordinated NH3 bound to Lewis acid sites. The band at approximately 1341 cm−1 was characteristic of the –NH2 species. Bands at 1443 and 1539 cm−1 were ascribed to the NH4+ species on the Brønsted acid, which was due to the asymmetric bending vibration of the N–H bond in the –NH3+ group, producing the decomposition of the NH4+ chemisorbed on a Brønsted acid site.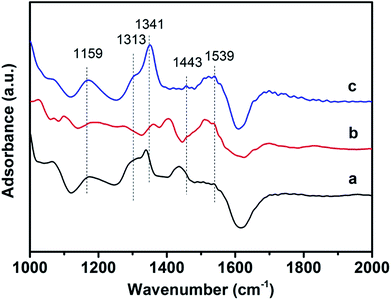 | ||
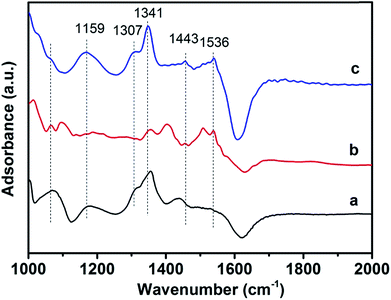
| Fig. 10 In situ DRIFT spectra of NH3 desorption over 3DOM catalysts at 400 °C in the presence of 1000 ppm NH3 (a) 0.8% W/CeO2 (b) 0.8% W/ZrO2 (c) 0.8% W/Ce0.8Zr0.2O2. | ||
For the 3DOM 0.8% W/CeO2 catalyst, only the bands at 1159, and 1341 cm−1 could be detected, which were ascribed to NH3 adsorption on the Lewis acid sites and –NH2 species, respectively. Compared with the 3DOM 0.8% W/ZrO2 sample, the bands at 1341, 1443 and 1539 cm−1 ascribed to Lewis acid sites and NH4+ species on the Brønsted acid could be detected. These differences showed that the different supports remarkably affected NH3 adsorption and activation. For the 3DOM 0.8% W/Ce0.8Zr0.2O2 catalyst, the bands at 1159, 1313, 1341, 1443 and 1539 could be detected, characteristic of the Lewis, Brønsted acid as well as the –NH3+ group and –NH2 species. More acid sites could be detected on the 0.8% W/Ce0.8Zr0.2O2 sample. The activation and adsorption of NH3 promoted the reduction of NOx. Ce–Zr mixed oxides and were prone to produce more ammonium groups that could easily combine with NO to produce NO3−, which was beneficial for PM combustion.
3.11 The results of the co-adsorption of NH3 + NO + O2
Fig. 11 presents in situ DRIFT spectra over 3DOM catalysts at 400 °C in a flow of NH3 + NO + O2. For the 3DOM 0.8% W/Ce0.8Zr0.2O2 sample, several bands at 1159, 1307, 1341, 1443, 1536 cm−1 could be observed. The band at 1307 cm−1 was attributed to the bidentate nitrate.54 The band at 1159 cm−1 was very close to the coordinated NH3 bound to Lewis acid sites, and the bands at 1443 and 1536 cm−1 were attributed to the NH4+ species on the Brønsted acid.55 The bands at 1341 cm−1 were related to the scissoring and wagging vibrations of the –NH2 species generated by hydrogen abstraction from NH3 coordinated to Lewis acid sites. Whereas, for the 3DOM 0.8% W/CeO2 sample, only bands at 1159, 1307 and 1341 cm−1 could be observed. Only bands at 1341, 1443 and 1536 cm−1 were observed for the 3DOM 0.8% W/ZrO2 catalyst. It was evident that there were many bands ascribed to NH4+, –NH2 species and nitrate species on the 3DOM 0.8% W/Ce0.8Zr0.2O2 catalyst, promoting PM oxidation and NO reduction.4. Conclusions
The highly ordered 3DOM catalysts were successfully synthesized through a CMCCT method. 3DOM W/Ce0.8Zr0.2O2 showed superior catalytic activity and high stability for simultaneous PM and NOx elimination.(1) Among all the 3DOM x% W/Ce0.8Zr0.2O2 catalysts, 3DOM 0.8% W/Ce0.8Zr0.2O2 exhibited superior catalytic activity with a maximum concentration of CO2 at 408 °C and a complete 100% NO conversion at 378–492 °C, achieving the purpose of the simultaneous PM and NOx abatement in diesel engine exhaust temperature range.
(2) 3DOM 0.8% W/Ce0.8Zr0.2O2 samples possessed high-quality 3DOM architecture and showed better low-temperature reducibility than the bare 3DOM 0.8% W/CeO2 and 0.8% W/ZrO2 counterpart. The Ce3+/Ce4+ ratio and the surface active oxygen species on 3DOM 0.8% W/Ce0.8Zr0.2O2 are much higher than those on 3DOM 0.8% W/CeO2 and 0.8% W/ZrO2 catalysts. The 3DOM 0.8% W/Ce0.8Zr0.2O2 sample also presented excellent catalytic activity in a relatively high GHSV of 50![[thin space (1/6-em)]](https://www.rsc.org/images/entities/char_2009.gif) 000 h−1.
000 h−1.
(3) The specific 3DOM architecture, much chemisorbed oxygen species amounts, excellent low-temperature reducibility as well as the abundant acid sites enhanced the catalytic efficiency for the simultaneous removal of PM and NO over the 3DOM 0.8% W/Ce0.8Zr0.2O2 sample.
Conflicts of interest
The authors declare no competing financial interest.Acknowledgements
This work was financially supported by the National Natural Science Foundation of China (U1662103, 21673290 and 21376261), China National Offshore Oil Corporation Fund (LHYJYKSA20160002).Notes and references
- W. Shan, Y. Geng, X. Chen, N. Huang, F. Liu and S. Yang, Catal. Sci. Technol., 2016, 6, 1195–1200 CAS.
- L. Arnarson, H. Falsig, S. B. Rasmussen, J. V. Lauritsen and P. G. Moses, J. Catal., 2017, 346, 188–197 CrossRef CAS.
- T. Boningari, A. Somogyvari and P. G. Smirniotis, Ind. Eng. Chem. Res., 2017, 56, 5483–5494 CrossRef CAS.
- Z. Zhang, L. Chen, Z. Li, P. Li, F. Yuan, X. Niu and Y. Zhu, Catal. Sci. Technol., 2016, 6, 7151–7162 CAS.
- Y. Li, Y. Du, Y. Wei, Z. Zhao, B. Jin, X. Zhang and J. Liu, Catal. Sci. Technol., 2017, 7, 968–981 CAS.
- G. C. Dhal, D. Mohan and R. Prasad, Catal. Sci. Technol., 2017, 7, 1803–1825 CAS.
- Q. Zhang, X. Liu, P. Ning, Z. Song, H. Li and J. Gu, Catal. Sci. Technol., 2015, 5, 2260–2269 CAS.
- B. Guan, H. Lin, Q. Cheng and Z. Huang, Ind. Eng. Chem. Res., 2011, 50, 5401–5413 CrossRef CAS.
- K. Hauff, U. Tuttlies, G. Eigenberger and U. Nieken, Ind. Eng. Chem. Res., 2013, 52, 8399–8409 CrossRef CAS.
- A. Gogos, R. Kaegi, R. Zenobi and T. D. Bucheli, Environ. Sci.: Nano, 2014, 1, 584–594 RSC.
- B. Guan, H. Lin, L. Zhu, B. Tian and Z. Huang, Chem. Eng. J., 2012, 181–182, 307–322 CrossRef CAS.
- M. V. Twigg, Catal. Today, 2011, 163, 33–41 CrossRef CAS.
- S. Fan, J. Xue, T. Yu, D. Fan, T. Hao, M. Shen and W. Li, Catal. Sci. Technol., 2013, 3, 2357–2364 CAS.
- Z. Liu, Y. Liu, B. Chen, T. Zhu and L. Ma, Catal. Sci. Technol., 2016, 6, 6688–6696 CAS.
- L. F. Nascimento, R. F. Martins, R. F. Silva, P. C. Sousa Filho and O. A. Serra, React. Kinet., Mech. Catal., 2013, 111, 149–165 CrossRef.
- K. Duan, B. Chen, T. Zhu and Z. Liu, Appl. Catal., B, 2015, 176, 618–626 CrossRef.
- Z. Li, M. Meng, Q. Li, Y. Xie, T. Hu and J. Zhang, Chem. Eng. J., 2010, 164, 98–105 CrossRef CAS.
- C. E. Hori, H. Permana, K. S. Ng, A. Brenner, K. More, K. M. Rahmoeller and D. Belton, Appl. Catal., B, 1998, 16, 105–117 CrossRef CAS.
- L. J. Alemany, F. Berti, G. Busca, G. Ramis, D. Robba, G. P. Toledo and M. Trombetta, Appl. Catal., B, 1996, 10, 299–311 CrossRef CAS.
- H. Li, G.-F. Qu, Y.-K. Duan, P. Ning, Q.-L. Zhang, X. Liu and Z.-X. Song, Chem. Pap., 2015, 69, 817–826 CAS.
- A. O. Shetian Liu, J. O. -Uchisawa, T. Nanba and S. Kushiyama, Appl. Catal., B, 2001, 30, 259–265 CrossRef.
- M. L. Pisarello, V. Milt, M. A. Peralta, C. A. Querini and E. E. Miró, Catal. Today, 2002, 75, 465–470 CrossRef CAS.
- Z. Wang, X. Yan, X. Bi, L. Wang, Z. Zhang, Z. Jiang, T. Xiao, A. Umar and Q. Wang, Mater. Res. Bull., 2014, 51, 119–127 CrossRef CAS.
- A. Raj, Z. Zainuddin, M. Sander and M. Kraft, Carbon, 2011, 49, 1516–1531 CrossRef CAS.
- Q. Peng, H. Zhao, L. Qian, Y. Wang and G. Zhao, Appl. Catal., B, 2015, 174–175, 157–166 CrossRef CAS.
- H. Arandiyan, H. Dai, K. Ji, H. Sun, Y. Zhao and J. Li, Small, 2015, 11, 2366–2371 CrossRef CAS PubMed.
- J. Xu, J. Liu, Z. Zhao, C. Xu, J. Zheng, A. Duan and G. Jiang, J. Catal., 2011, 282, 1–12 CrossRef CAS.
- G. Zhang, Z. Zhao, J. Xu, J. Zheng, J. Liu, G. Jiang, A. Duan and H. He, Appl. Catal., B, 2011, 107, 302–315 CrossRef CAS.
- M. Piumetti, S. Bensaid, N. Russo and D. Fino, Appl. Catal., B, 2016, 180, 271–282 CrossRef CAS.
- Y. Cheng, W. Song, J. Liu, H. Zheng, Z. Zhao, C. Xu, Y. Wei and E. J. M. Hensen, ACS Catal., 2017, 7, 3883–3892 CrossRef CAS PubMed.
- W. Shan, F. Liu, H. He, X. Shi and C. Zhang, Chem. Commun., 2011, 47, 8046–8048 RSC.
- J. Li, R. Zhu, Y. Cheng, C. K. Lambert and R. T. Yang, Environ. Sci. Technol., 2010, 44, 1799–1805 CrossRef CAS PubMed.
- S. Liu, X. Wu, D. Weng, M. Li and R. Ran, ACS Catal., 2015, 5, 909–919 CrossRef CAS.
- M. e. Yu, C. Li, G. Zeng, Y. Zhou, X. Zhang and Y. e. Xie, Appl. Surf. Sci., 2015, 342, 174–182 CrossRef CAS.
- S. Cai, D. Zhang, L. Zhang, L. Huang, H. Li, R. Gao, L. Shi and J. Zhang, Catal. Sci. Technol., 2014, 4, 93–101 CAS.
- H. L. Fan, T. Sun, Y. P. Zhao, J. Shangguan and J. Y. Lin, Environ. Sci. Technol., 2013, 47, 4859–4865 CrossRef CAS PubMed.
- X. Yu, J. Li, Y. Wei, Z. Zhao, J. Liu, B. Jin, A. Duan and G. Jiang, Ind. Eng. Chem. Res., 2014, 53, 9653–9664 CrossRef CAS.
- S. Zhu, X. Gao, Y. Zhu, J. Cui, H. Zheng and Y. Li, Appl. Catal., B, 2014, 158, 391–399 CrossRef.
- M. L. Hernandez-Pichardo, J. M. de la Fuente, P. Del Angel, A. Vargas, J. Navarrete, I. Hernandez, L. Lartundo and M. González-Brambila, Appl. Catal., A, 2012, 431, 69–78 CrossRef.
- Y. Peng, K. Li and J. Li, Appl. Catal., B, 2013, 140, 483–492 CrossRef.
- Y. Liu, H. Dai, Y. Du, J. Deng, L. Zhang, Z. Zhao and C. T. Au, J. Catal., 2012, 287, 149–160 CrossRef CAS.
- S. Zhan, H. Zhang, Y. Zhang, Q. Shi, Y. Li and X. Li, Appl. Catal., B, 2017, 203, 199–209 CrossRef CAS PubMed.
- Y. Wei, J. Liu, Z. Zhao, A. Duan, G. Jiang, C. Xu, J. Gao, H. He and X. Wang, Energy Environ. Sci., 2011, 4, 2959–2970 CAS.
- H. Wang, Z. Qu, H. Xie, N. Maeda, L. Miao and Z. Wang, J. Catal., 2016, 338, 56–67 CrossRef CAS.
- Y. Wei, J. Liu, Z. Zhao, A. Duan and G. Jiang, J. Catal., 2012, 287, 13–29 CrossRef CAS.
- J. Luo, M. Meng, X. Li, X. Li, Y. Zha, T. Hu, Y. Xie and J. Zhang, J. Catal., 2008, 254, 310–324 CrossRef CAS.
- W. Shan, F. Liu, H. He, X. Shi and C. Zhang, Appl. Catal., B, 2012, 115–116, 100–106 CrossRef CAS.
- J. Zuo, Z. Chen, F. Wang, Y. Yu, L. Wang and X. Li, Ind. Eng. Chem. Res., 2014, 53, 2647–2655 CrossRef CAS.
- H. Zhang, J. Han, X. Niu, X. Han, G. Wei and W. Han, J. Mol. Catal. A: Chem., 2011, 350, 35–39 CrossRef CAS.
- M. Sun, S. Wang, Y. Li, H. Xu and Y. Chen, Appl. Surf. Sci., 2017, 402, 323–329 CrossRef CAS.
- N.-Y. Topsøe, Science, 1994, 263, 26 Search PubMed.
- L. Lietti, I. Nova and P. Forzatti, Top. Catal., 2000, 11, 111–122 CrossRef.
- L. Lietti, P. Forzatti and F. Berti, Catal. Lett., 1996, 41, 35–39 CrossRef CAS.
- X. Wu, F. Lin, H. Xu and D. Weng, Appl. Catal., B, 2010, 96, 101–109 CrossRef CAS.
- G. Qi and R. T. Yang, J. Phys. Chem. B, 2004, 108, 15738–15747 CrossRef CAS.
Footnotes |
| † Electronic supplementary information (ESI) available: Catalytic performance, BET, Raman, SEM, NH3-TPD of the samples. See DOI: 10.1039/c7ra11571g |
| ‡ The both authors contributed equally to this work. |
| This journal is © The Royal Society of Chemistry 2017 |


