 Open Access Article
Creative Commons Attribution 3.0 Unported Licence
Enhancing the performance of thin-film nanocomposite nanofiltration membranes using MAH-modified GO nanosheets
Quanling Xie abe,
Wenyao Shaod,
Shishen Zhangbd,
Zhuan Hongbe,
Qiuquan Wang
 *a and
Birong Zeng
 *c
*c
aDepartment of Chemistry, The MOE Key Laboratory of Spectrochemical Analysis and Instrumentation, College of Chemistry and Chemical Engineering, Xiamen University, Xiamen 361005, China. E-mail: qqwang@xmu.edu.cn
bEngineering Research Center of Marine Biological Resource Comprehensive Utilization, SOA, The Third Institute of Oceanography of the State Oceanic Administration, Xiamen 361005, China
cDepartment of Materials Science and Engineering, College of Materials, Xiamen University, 361005, China. E-mail: brzeng@xmu.edu.cn
dDepartment of Chemical and Biochemical Engineering, College of Chemistry and Chemical Engineering, Xiamen University, Xiamen 361005, China
eFujian Collaborative Innovation Center for Exploitation and Utilization of Marine Biological Resources, Xiamen, 361005, China
First published on 1st December 2017
Abstract
In this work, novel thin-film nanocomposite (TFN) nanofiltration (NF) membranes were developed through modification with maleic anhydride functionalized graphene oxide (MAH-GO) via interfacial polymerization (IP). First, MAH-GO was synthesized by linking MAH molecules to the electrophilic groups (C–OH) of GO nanosheets. The resulting materials were characterized in depth by FT-IR, TEM, SEM, AFM, XPS and Raman spectroscopy. Subsequently, the MAH-GO and GO nanosheets were individually introduced into the polypiperazine-amide (PPA) active layer of TFN NF membranes via IP between piperazine (PIP) and trimesoyl chloride (TMC). The influence of the MAH-GO or GO concentrations on the morphology and performance of TFN NF membranes was systematically investigated. Compared with TFC-blank, the TFN-MG-60 and TFN-GO-80 membranes demonstrated significantly enhanced separation performance without reduction of the salt rejection. Particularly, the water flux of TFN-MG-60 and TFN-GO-80 was found to be 49.3 L m−2 h−1 and 42.0 L m−2 h−1, respectively, corresponding to 176.7% and 150.5% of TFC-blank. Moreover, TFN-MG-60 demonstrated superior water permeability, antifouling capability and chlorine resistance to TFN-GO-80, which was attributed to the incorporation of MAH-GO nanosheets having more hydrophilic carboxyl groups. Meanwhile, TFN-MG-60 retained a high salt rejection rate of 97.6% to Na2SO4, comparable to that of TFC-blank. The MAH-GO nanosheets show great potential in developing high-performance TFN NF membranes to overcome the trade-off effect of conventional thin-film composite membranes.
1 Introduction
Nanofiltration (NF) is the newest of the four classes of pressure-driven membranes whose molecular weight cut-off (MWCO) ranges from 150 to 1000 Da. It was originally developed to bridge the gap between reverse osmosis (RO) and ultrafiltration (UF). In contrast to asymmetric NF membranes prepared by the phase inversion method, NF membranes prepared by interfacial polymerization (IP) display superior properties such as higher permeability, rejection and selectivity. The development of thin-film composite (TFC) membrane provides strong impetus to NF as a recognized and burgeoning alternative to conventional separation techniques, as the top selective layer and bottom porous substrate of a TFC membrane can be independently controlled and optimized to achieve desired selectivity and permeability, while offering excellent mechanical strength and compression resistance.1 Currently, TFC NF are commonly applied in various industries such as water softening, food & dairy, beverage, chemical engineering and pharmaceutical.1,2 Despite that TFC NF membranes have been widely utilized in many industries, there are still substantial challenges for improving the permselectivity,3,4 anti-biofouling5 and chlorine resistance.6,7 In order to address these challenges, thin-film nanocomposite (TFN) membrane has been developed by incorporating an appropriate amount of nanomaterials in the bottom porous substrate8,9 as well as in the top selective layer to enhance the TFC NF performance.10,11 The obtained TFN membranes have shown considerable potential to overcome the flux-rejection trade-off effect due to the unique features of.8 Many previous studies reported embedding various nanofillers (e.g. silicon dioxide,12–14 TiO2 (ref. 15 and 16), MWCNT17–19) in polyamide (PA) selective layers to improve membrane performance.In recent years, graphene oxide (GO) has recently attracted increasing research interest for its application in membrane materials,20–22 as it can act as a unique two-dimensional nanomaterial with abundant oxygen-containing functional groups (carboxyl, hydroxyl and epoxy) on their basal plane and edge. The presence of such hydrophilic groups grants GO outstanding dispersibility in polar organic solvent or aqueous medium,23 as well as provides the important reaction sites for further structural modification. In general, there are two different routes to incorporate GO into the PA selective layer: (I) GO is dispersed in aqueous phase containing aliphatic/aromatic diamine such as piperazine (PIP) and m-pheylenediamine (MPD); (II) GO is dispersed in organic phase containing acid chloride monomers such as trimesoyl chloride (TMC). The route (I) is often preferred because GO demonstrates better dispersibility in aqueous solution than in organic phase.9,24–26 Lai et al.8 and Wang et al.27 investigated the effect of GO concentration in an aqueous PIP solution on membrane performance and found that TFN NF membrane with embedding an appropriate amount of GO exhibited better membrane performance owing to the remarkable increase in membrane hydrophilicity and surface negativity. Bano et al.28 and Xia et al.29 studied the effect of the GO concentration in an aqueous MPD solution on membrane performance and showed that GO-embedded TFN NF membranes offered higher water fluxes and better antifouling properties. In addition, GO-embedded TFN membranes have also been developed as solvent-resistant NF to separate organic mixtures.30,31 In most of studies on GO-embedded TFN NF membranes, GO was directly utilized without structural modification.
GO has been demonstrated to be amphiphilic with an edge-to-center distribution of hydrophilic and hydrophobic domains.32–34 In order to further enhance its hydrophilicity, dispersibility and compatibility, GO was modified with maleic anhydride (MAH) to synthesize MAH functionalized GO (MAH-GO) in this study. MAH-GO was incorporated in the polypiperazine-amide (PPA) active layer as a novel nanofiller during the interfacial polymerization (IP) process to improve the membrane performance. The effects of graphene-based nanosheets with different functional groups and concentrations on the surface morphology, hydrophilicity, separation performance, and antifouling properties of TFN NF membranes were systematically investigated in this study.
2 Experimental
2.1 Materials
Polysulfone (PSf) UF membrane supplied by Beijing Shengwanquan Membrane Technology Co. Ltd (China) was used as substrates of TFC membranes. The properties of PSf UF membrane are listed in Table 1.| Membrane material | MWCO (Da) | Water flux (L m−2 h−1 bar−1) | Contact angle (°) |
|---|---|---|---|
| PSf | 100![[thin space (1/6-em)]](https://www.rsc.org/images/entities/char_2009.gif) 000 000 |
224.6 ± 10.8 | 81.4 ± 1.3 |
PIP and TMC were provided by Shanghai Aladdin (China). Maleic anhydride (MAH), n-hexane, triethylamine (TEA), sodium hypochlorite (NaOCl), hydrochloric acid (HCl), sodium sulfate (Na2SO4), magnesium sulfate (MgSO4), sodium chloride (NaCl) and magnesium chloride (MgCl2) were of analytical grade and obtained from Sinopharm Chemical Reagent Co. Ltd (China). Bovine serum albumin (BSA) was purchased from BBI life sciences (China). Water used in this study was purified by a Millipore system to achieve an electrical resistivity of 18.2 MΩ cm.
2.2 Preparation of GO and MAH functionalized GO (MAH-GO)
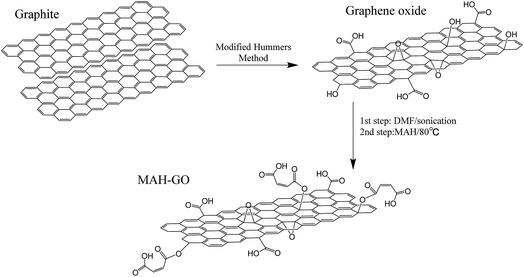
GO was prepared by a modified Hummers method as reported in our previous study.35 The process of MAH-GO fabrication was illustrated in Fig. 1. 0.25 GO powders were first added into 60 mL DMF solution and sonicated for 30 min to form a homogeneous solution. 0.98 g MAH was then added into the mixture solution with refluxing at 80 °C for 60 min. Finally, the resulting product was washed with ethanol to remove the unreacted MAH and dried in vacuum to obtain the MAH-GO.2.3 Preparation of composite NF membrane
Appropriate amounts of nanofillers (MAH-GO or GO) was added into the aqueous solution containing 2.0 wt% PIP and 2.0 wt% TEA, which was treated by the ultrasonic dispersion for 1 h. The resulting aqueous solution was poured on the top of the PSf support membrane (fixed in a self-made polypropylene frame) and held for 2 min. Then the excess aqueous solution was drained off and the residual droplets were removed from the membrane surface by nitrogen blowing. The PIP saturated support layer was then immersed in a solution of 0.1 w/v% TMC dissolved in n-hexane for 1 min. After being cured at 60 °C for 8 min, the prepared composite NF membranes were rinsed using pure water and immersed in pure water before use. The obtained composite membranes were named TFN-MG-x or TFN-GO-x, where x denoted the aqueous solution containing x ppm of MAH-GO or GO. The composite NF membrane without adding nanofiller was named TFC-blank.2.4 Characterization of GO and MAH-GO
The chemical structures of GO and MAH-GO were characterized by Fourier transform infrared spectroscopy (FT-IR, Bruker VERTXE 70, Switzerland). Their morphologies were observed with a scanning electron microscope (SEM, Hitachi SU-70, Japan) operated at 10 kV, and a transmission electron microscopy (TEM, TALOS F200, USA) operated at 200 kV. Their surface characteristics were analyzed by an atomic force microscope (AFM, Bruker Nanoscope Multimode 8, Switzerland) in tapping-mode. Their surface groups were determined by an X-ray photoelectron spectroscopy (XPS, Thermo K-Alpha, USA). The sp2/sp3 carbon ratio was confirmed by Raman spectroscopy (Thermo Renishaw, USA). Their zeta-potentials were evaluated by particle-size analyzer (Nano-Zetasizer 90, Malvern Instruments, UK).2.5 Characterization of composite NF membranes
The surface functional groups of the composite membranes were characterized by ATR-FTIR (Bruker VERTXE 70, Switzerland) and their surface compositions were characterized by XPS (Quantum 2000, Physical Instruments, USA).The surface hydrophilicities of composite membranes were evaluated using a contact angle goniometer (Beijing HARKE SPCAX3, China). At least five contact angles between water droplets and the top membrane surfaces were measured to minimize the experimental measurement error.
The cross-sectional morphologies of composite membranes were investigated with SEM (Zeiss Sigma, Germany) operated at 15 kV. The morphology and roughness were analyzed by AFM (MI5500, Agilent, USA) in tapping mode. The membrane surfaces were imaged at a scan size of 2 μm × 2 μm.
The membrane surface zeta potential was determined using SurPass Electrokinetic Analyser equipped with an adjustable cell (AntonPaar GmbH, Austria) based on the streaming potential method. All analysis was carried out with 1 mM KCl back ground solution at 25 °C and the solution pH value was maintained between 3.0 and 10.0 by automatic addition of 0.1 M HCl or 0.1 M KOH.
2.6 Performance of composite NF membrane
The membrane permselectivities were measured at 0.6 MPa and 25 °C using a lab-scale cross-flow membrane separation device (FlowMem-0021-HP, FMT, China). The composite membranes were pre-pressurized under a pressure of 0.6 MPa for 30 min to achieve a steady flux. Four different salt solutions (2000 ppm Na2SO4, MgSO4, MgCl2 or NaCl) were used for rejection test. The key parameters of relevant ions are listed in Table 2.36 The water flux and the rejection (R) were calculated using the eqn (1) and (2), respectively:
 | (1) |
 | (2) |
| Ions | z | D (10−3 mm2 s−1) | rs (nm) |
|---|---|---|---|
| a Note: z, D and rs refer to the charge number, diffusion coefficient and Stokes radius. | |||
| Na+ | 1 | 1.333 | 0.183 |
| Mg+ | 2 | 0.706 | 0.345 |
| Cl− | −1 | 2.032 | 0.120 |
| SO42− | −2 | 1.065 | 0.229 |
BSA was used as the model protein foulant in this study. The membrane fouling of the composite membranes were assessed according to the following procedure. First, the pure water flux was recorded for 60 min at a pressure of 0.6 MPa. Then 2000 ppm BSA solution was used to replace pure water and recycled continuously for another 60 min. Subsequently, the fouled membranes were rinsed with the pure water, followed by filtration process with the pure water again. The fouling and water filtration procedures were repeated two times.
The chlorine resistance of the composite membranes were evaluated in terms of water flux and salt rejection before and after chlorine treatment. In order to eliminate the effect of acidic or basic condition, 2000 ppm sodium hypochlorite solution with neutral pH was used to examine the long-term chlorine stability. The NF membranes were immersed in the sodium hypochlorite solution for different interval period (24 h, 48 h and 72 h). Before remeasuring membrane permselectivity, the chlorine-treated membranes were rinsed thoroughly and soaked in pure water for 1 h. The performance of chlorine-treated membrane was tested under the same aforementioned conditions.
3 Results and discussion
3.1 Characterization of GO and MAH-GO
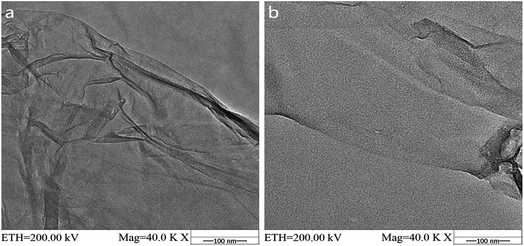
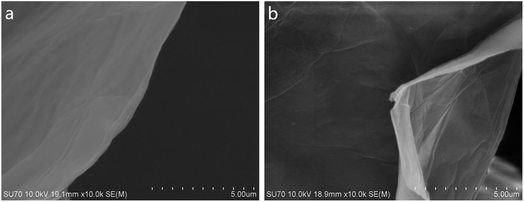
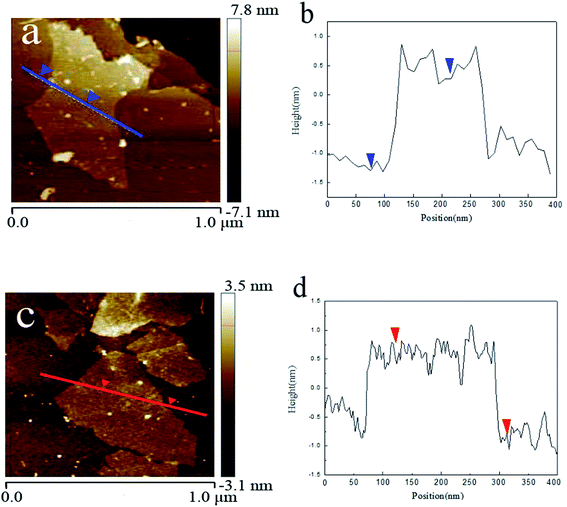
GO and MAH-GO present highly similar nanosheets structures with the wrinkled morphologies according to their TEM images (Fig. 2) and SEM images (Fig. 3). It is therefore shown that MAH modification didn't change the original nanosheets structure and morphology of GO.The lateral sizes and thicknesses of GO and MAH-GO nanosheets were observed by AFM. As shown in Fig. 4, most of GO and MAH-GO nanosheets displayed the lateral sizes ranging from 400 to 800 nm, and the average thicknesses of GO and MAH-GO was found to be 1.1 nm and 1.3 nm, respectively. The observed thickness of GO indicated that GO nanosheets were successfully exfoliated with a single layer, which was consistent with other literature.8,37 Furthermore, the thickness of MAH-GO was close to that of GO, further confirming that MAH functionalized GO didn't affect the nanosheets structure and morphology of GO.
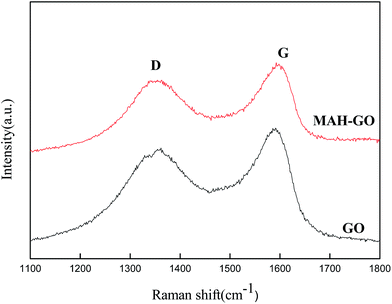
The Raman spectra of the GO and MAH-GO nanosheets (Fig. 5) show the positions and intensities of D peak and G peak. D broad band at 1350 cm−1 and G broad band at 1600 cm−1 denote sp3 and sp2 hybridized carbon atoms, corresponding to the disordered and ordered carbon structures of GO nanosheets, respectively. The Raman spectrum of MAH-GO was highly similar to that of GO, indicating that MAH-GO still kept the skeleton structure of GO. But the intensity ratio of D peak to G peak (ID/IG) slightly increased from 0.85 (GO) to 0.89 (MAH-GO). This result implied the introduction of sp3 defects after GO covalent functionalized with MAH.
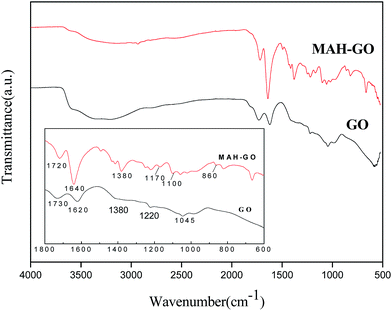
FTIR was used to investigate the presence of functional groups in GO and MAH-GO nanosheets. As shown in Fig. 6, the GO spectrum displayed several typical characteristic peaks located at 3360, 1730, 1620, 1220 and 1045 cm−1, assigned to the stretching vibrations of –OH, C![[double bond, length as m-dash]](https://www.rsc.org/images/entities/char_e001.gif) O, unoxidized sp2 aromatic C
O, unoxidized sp2 aromatic C![[double bond, length as m-dash]](https://www.rsc.org/images/entities/char_e001.gif) C, C–O in epoxy groups and C–O in alkoxy groups, respectively. This finding confirms that GO nanosheets had abundant oxygen-containing hydrophilic groups, consistent with the previous reports.8,38 After surface covalent modification with MAH, the peaks of –OH of the carboxyl group (1380 cm−1), C
C, C–O in epoxy groups and C–O in alkoxy groups, respectively. This finding confirms that GO nanosheets had abundant oxygen-containing hydrophilic groups, consistent with the previous reports.8,38 After surface covalent modification with MAH, the peaks of –OH of the carboxyl group (1380 cm−1), C![[double bond, length as m-dash]](https://www.rsc.org/images/entities/char_e001.gif) C (1640 cm−1) and C
C (1640 cm−1) and C![[double bond, length as m-dash]](https://www.rsc.org/images/entities/char_e001.gif) O (1720 cm−1) became stronger, but the broad band of –OH (3360 cm−1) became weaken. Furthermore, MAH-GO showed a new peak at 860 cm−1 assigned to the in-plane bending vibration of C–H of CH
O (1720 cm−1) became stronger, but the broad band of –OH (3360 cm−1) became weaken. Furthermore, MAH-GO showed a new peak at 860 cm−1 assigned to the in-plane bending vibration of C–H of CH![[double bond, length as m-dash]](https://www.rsc.org/images/entities/char_e001.gif) CH group. Two additional new peaks at 1100 and 1170 cm−1 were assigned to the stretching vibration of C–O of the ester group. All the above observations provided clear evidences that MAH successfully reacted with the electrophilic groups of the GO nanosheets and generated the new GO-MAH nanosheets.
CH group. Two additional new peaks at 1100 and 1170 cm−1 were assigned to the stretching vibration of C–O of the ester group. All the above observations provided clear evidences that MAH successfully reacted with the electrophilic groups of the GO nanosheets and generated the new GO-MAH nanosheets.
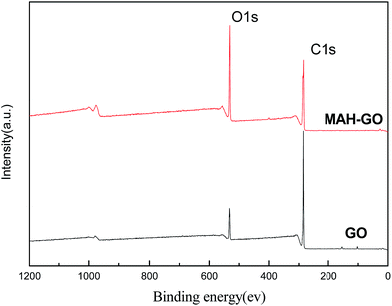
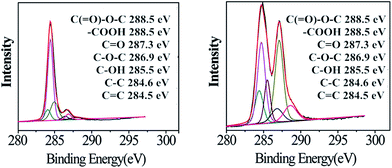
XPS was further adopted to investigate the chemical compositions of GO and MAH-GO nanosheets. As illustrated in Fig. 8, the C 1s spectra of GO and MAH-GO contain six peaks, corresponded to C![[double bond, length as m-dash]](https://www.rsc.org/images/entities/char_e001.gif) C (284.5 eV), C–C (284.6 eV), C–OH (285.5 eV), C–O–C (286.9 eV), C
C (284.5 eV), C–C (284.6 eV), C–OH (285.5 eV), C–O–C (286.9 eV), C![[double bond, length as m-dash]](https://www.rsc.org/images/entities/char_e001.gif) O (287.3 eV) and C(
O (287.3 eV) and C(![[double bond, length as m-dash]](https://www.rsc.org/images/entities/char_e001.gif) O)O (288.5 eV) groups, respectively. According to the Fig. 7 and Table 3, compared with that of GO, the oxygen atomic concentration of MAH-GO was remarkably higher due to the successful introduction of MAH molecules carrying substantial amounts of oxygen atoms. Furthermore, the peak area percentage of –C(
O)O (288.5 eV) groups, respectively. According to the Fig. 7 and Table 3, compared with that of GO, the oxygen atomic concentration of MAH-GO was remarkably higher due to the successful introduction of MAH molecules carrying substantial amounts of oxygen atoms. Furthermore, the peak area percentage of –C(![[double bond, length as m-dash]](https://www.rsc.org/images/entities/char_e001.gif) O)O and –C
O)O and –C![[double bond, length as m-dash]](https://www.rsc.org/images/entities/char_e001.gif) C– groups increased from 3.50% to 9.35% and 9.19% to 12.33%, respectively. Meanwhile, the peak area percentage of –C–OH groups decreased from 20.39% to 11.66%, which suggested that the C–OH groups acted as electrophilic groups and reacted with the MAH molecules (see Fig. 1). The outstanding change of these functional group concentrations implied successful carboxylation of GO, confirming the characterization results of FTIR analysis.
C– groups increased from 3.50% to 9.35% and 9.19% to 12.33%, respectively. Meanwhile, the peak area percentage of –C–OH groups decreased from 20.39% to 11.66%, which suggested that the C–OH groups acted as electrophilic groups and reacted with the MAH molecules (see Fig. 1). The outstanding change of these functional group concentrations implied successful carboxylation of GO, confirming the characterization results of FTIR analysis.
| Sample | Atomic concentration (%) | Chemical bonding peak area (%) | |||
|---|---|---|---|---|---|
| O 1s | C 1s | –C(![[double bond, length as m-dash]](https://www.rsc.org/images/entities/char_e001.gif) O)O O)O |
–C–OH | –C![[double bond, length as m-dash]](https://www.rsc.org/images/entities/char_e001.gif) C– C– |
|
| GO | 12.88 | 87.12 | 3.50 | 20.39 | 9.19 |
| MAH-GO | 25.95 | 74.05 | 9.35 | 11.66 | 12.33 |
3.2 Characterization of composite NF membranes
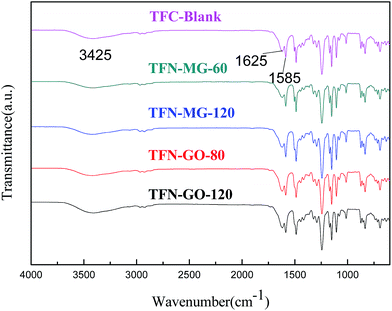
The surface chemical structures of composite and support membranes were analyzed by ATR-FTIR as shown in Fig. 9. The composite NF membranes demonstrated characteristic peaks at 1625, 1585 and 3425 cm−1 attributed to the carbonyl stretching vibration of amide-I, the couplings of in-plane N–H bending and C–N stretching vibrations of amide II band, and the hydroxyl stretching vibration, respectively.27,28 These results suggested the successful formation of PPA layer on PSf support membrane surface during the IP process. Nevertheless, TFN membranes embedded with a small amount of nanofillers didn't present detectable variation in comparison with the TFC-blank membrane. This may be because the concentration of MAH-GO or GO nanosheets incorporated in PPA layer was overly low for detection by ATR-FTIR.In order to verify that the selective layers of composite NF membranes were successfully modified with MAH-GO or GO, XPS analysis was further carried out to investigate the elemental compositions of four kinds of membranes. As shown by the full-scan spectra in Fig. 10(a), all the membranes demonstrated four peaks at binding energy of 167.2, 284.5, 399.2 and 530.8 eV, representing the S 2p, C 1s, N 1s and O 1s regions, which were consistent with the previous report.27 The corresponding atomic concentrations were listed in Table 4. Compared with the PSf substrate, the N atomic concentrations of composite NF membranes significantly increased, while their S atomic concentrations decreased. It suggested that an ultrathin PPA active skin layer was successfully formed on the PSf support membrane. Although the concentration of the added nanofiller in TFN-MG-60 was lower than TFN-GO-80, the skin layer of TFN-MG-60 still showed the higher oxygen content, probably due to the abundant oxygen element in MAH-GO nanosheets. Fig. 10(b–d) show the high resolution C 1s spectra. Compared with the TFC-blank membrane, TFN-MG-60 and TFN-GO-80 had the higher percentage of –C(![[double bond, length as m-dash]](https://www.rsc.org/images/entities/char_e001.gif) O)O, which suggested that the PPA active layer had been successfully modified by MAH-GO and GO nanosheets.
O)O, which suggested that the PPA active layer had been successfully modified by MAH-GO and GO nanosheets.
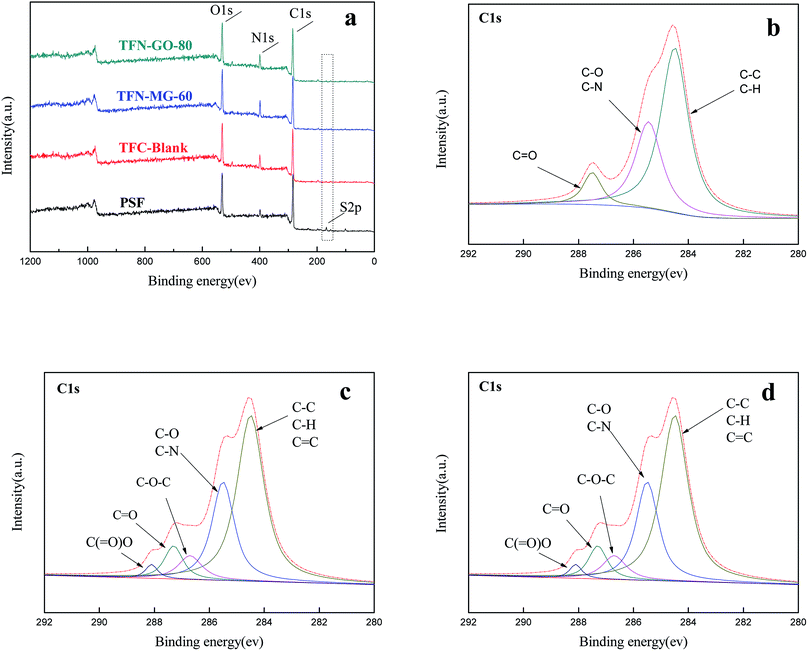 | ||
| Fig. 10 (a) XPS full-scan spectra of PSf substrate and composite NF membranes; high-resolution C 1s spectra of (b) TFC-blank, (c) TFN-MG-60 and (d) TFN-GO-80. | ||
| Membrane ID | C (%) | N (%) | O (%) | S (%) |
|---|---|---|---|---|
| TFC-blank | 72.52 | 10.02 | 17.32 | 0.14 |
| TFN-MG-60 | 70.63 | 10.05 | 19.04 | 0.28 |
| TFN-GO-80 | 70.86 | 10.93 | 17.94 | 0.27 |
| PSf support | 74.3 | 4.67 | 19.67 | 1.36 |
The effect of MAH-GO or GO concentrations on the surface hydrophilicities of composite NF membranes was shown in Fig. 11. The PSf substrate had a very high water contact angle (WCA) of 81.4° due to the inherently hydrophobic characteristic of PSf chemical structure. But WCA of the TFC-blank membrane was significantly reduced to 44.5°, which can be attributed to the presence of the amide bonds and carboxyl groups (generated from the partial hydrolysis of the acyl chloride group) of the top PPA selective layer.39 After incorporation of MAH-GO or GO into the PPA selective layers, the WCA of both TFN-MG and TFN-GO series membranes gradually decreased with the increase of MAH-GO and GO concentrations. The WCA of TFN-MG-120 and TFN-GO-120 was reduced to 22.3° and 30.2°, respectively. These results suggested that TFN membranes became more hydrophilic with increasing MAH-GO and GO contents in the active layer, which arose from the oxygen-containing hydrophilic groups in MAH-GO and GO nanosheets.28,39 Furthermore, it was noted that TFN-MG series membranes possessed considerably lower WCA than TFN-GO series membranes, because MAH-GO demonstrated stronger hydrophilic property than GO, which was expected to enhance water flux.28 It's widely acknowledged that the WCA is mainly affected by the intrinsic wettability of membrane material and the membrane surface roughness. Membrane surface with more hydrophilic groups and higher surface roughness leads to a smaller WCA value. As listed in Table 5, the surface roughness varied within 30 nm. Therefore, the WCA affected by surface roughness could be neglected compared with the hydrophilicity enhancement of membrane surface.
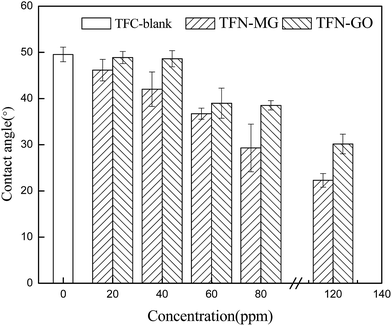 | ||
| Fig. 11 Contact angles of composite NF membranes as a function of nanofiller concentrations in the aqueous solution. | ||
| Membrane ID | Roughness (nm) | ||
|---|---|---|---|
| Ra | Rq | Rz | |
| TFC-blank | 22.9 | 29.2 | 83.2 |
| TFN-MG-60 | 5.43 | 7.57 | 10.9 |
| TFN-MG-120 | 9.64 | 12.6 | 45.6 |
| TFN-GO-80 | 21.3 | 16.3 | 64.1 |
| TFN-GO-120 | 15.4 | 19.6 | 43.9 |
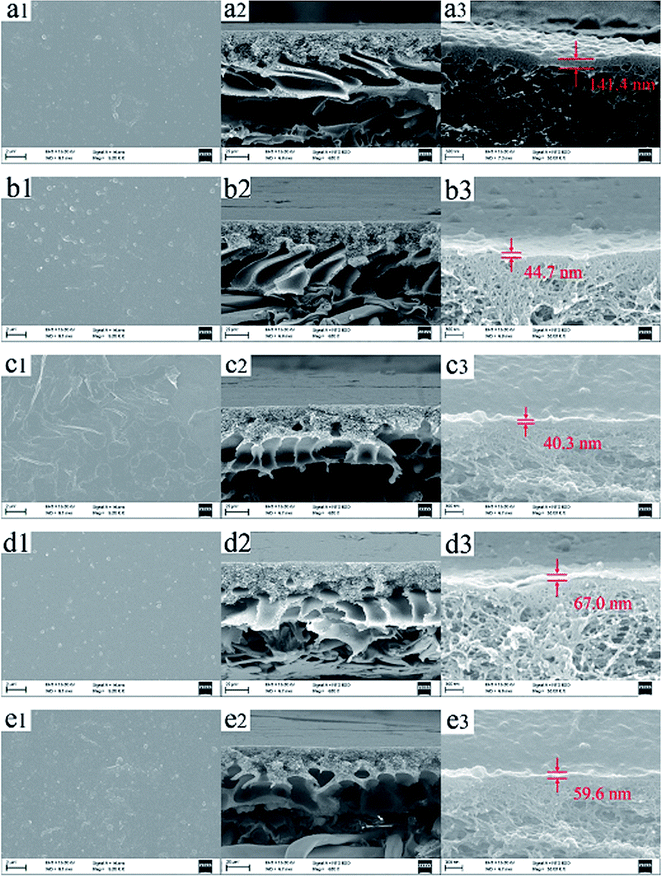
According to Fig. 12, both TFC-blank and TFN membranes demonstrated extremely dense and rough top surfaces and the typically composite structure consisting of a thin active skin layer and a finger-like porous transition layer. Moreover, aggregated clusters were observed on the top surfaces when the nanofiller concentration was 120 ppm, which mainly resulted from the aggregation of MAH-GO and GO at the high concentration. The thickness of PPA skin layer decreased with the increase of MAH-GO and GO concentration. The TFC-blank membrane had a PPA thin-film layer with a thickness of 141.4 nm, but the thickness of TFN-MG-120 and TFN-GO-120 were reduced to 40.3 and 59.6 nm, respectively. The decrease of thickness of PPA top skin layer can increase water permeability due to the decrease of the membrane resistance.
The surface roughness of composite membranes was observed by AFM (Fig. 13). Both TFN-MG and TFN-GO membranes possessed smaller Rq values compared with TFC-blank. However, the surface roughness at 120 ppm was higher than that at 60 ppm regardless of the TFN-MG and TFN-GO membranes, which resulted from the surface-located clusters formed due to the aggregation of MAH-GO and GO at 120 ppm.28 The decrease of the roughness and the thickness of the PPA skin layer was probably due to the retardation of PIP diffusion into the organic solvent by the MAH-GO and GO nanosheets.24 Generally, the membrane surfaces with higher hydrophilicity and lower roughness possess better antifouling property. Consequently, the TFN-MG and TFN-GO membranes were expected to exhibit better antifouling property than the TFC-blank membrane.
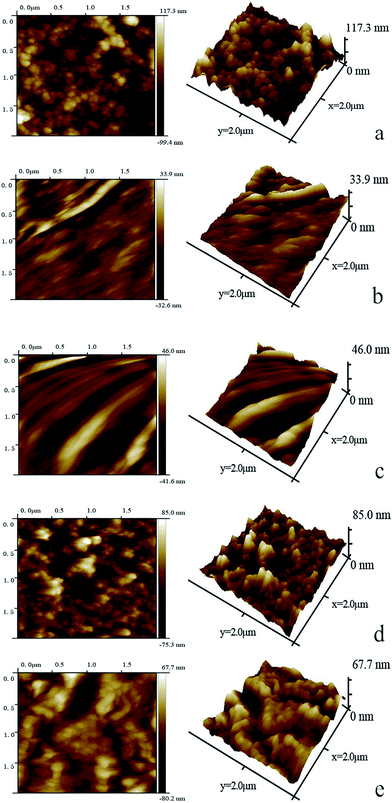 | ||
| Fig. 13 Two- and three-dimensional AFM surface topography of TFC-blank (a), TFN-MG-60 (b), TFN-MG-120 (c), TFN-GO-80 (d), TFN-GO-120 (e). | ||
3.3 Performance of composite NF membranes
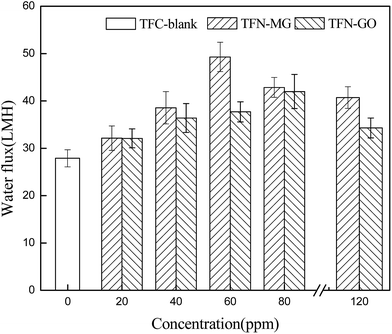
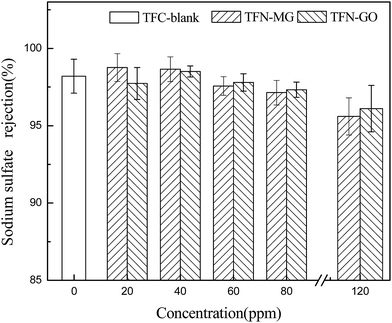
The effect of the nanofiller concentration on the membrane performance was evaluated in terms of water permeability (Fig. 14) and salt rejection (Fig. 15). At low nanofiller concentration, the pure water fluxes of both TFN-MG and TFN-GO series membranes increased significantly with the increasing MAH-GO and GO concentrations. TFN-MG-60 and TFN-GO-80 exhibited the largest water flux among TFN-MG and TFN-GO series membranes, respectively. The water fluxes of TFN-MG-60 and TFN-GO-80 reached 49.3 L m−2 h−1 and 42.0 L m−2 h−1, respectively, which corresponded to 176.7% and 150.5% of TFC-blank. Meanwhile, there was no obvious loss of Na2SO4 rejection at low nanofiller concentrations, which suggested that the increment of water flux wasn't caused by the membrane defect due to the addition of MAH-GO and GO nanosheets. The enhanced water flux could be a result from the following factors: (1) the stronger membrane hydrophilicity and the smoother membrane surface promoted an overall faster flow of water molecules on the hydrophilic membrane surfaces with less friction,35 (2) a relatively loose and thin PPA skin layer was formed because the introduction of MAH-GO or GO nanosheets hindered the diffusion of PIP molecules into the organic phase during the IP process, which reduced the membrane resistance and led to an increased water flux, (3) the introduction of MAH-GO/GO nanosheets probably affected the PPA connections and increased the free volume, and some gaps also inevitably appeared in the interfacial layer between PPA and MAH-GO/GO nanosheets, both the free volume and gaps acted as the molecular channel of water, and (4) more additional water channels were provided by MAH-GO or GO nanosheets, which facilitated water passage through the top skin layer.28When the nanofiller concentration varied from 20 to 80 ppm, the salt rejection remained relatively constant regardless of the nanofiller types and concentrations. However, there was an obvious decrease in the salt rejection when the concentration reached 120 ppm. This is because when excessive MAH-GO or GO was added into the aqueous phase, some voids were unavoidably introduced in the skin layer due to the limited compatibility between the nanofiller and the polymer matrix.18 Furthermore, excessive amount of MAH-GO or GO would aggregate and affect the formation of PPA skin layer by interfacial reaction between PIP and TMC.9,28,40 Therefore, the combined effects resulted in the reduction of salt rejection.
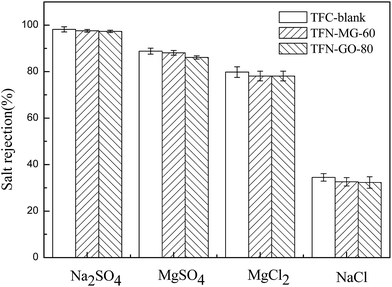
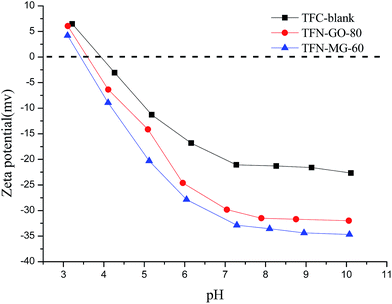
Four different salt solutions (2000 ppm of Na2SO4, MgSO4, MgCl2 and NaCl) were further used to evaluate the salt rejection characteristics of the TFC-blank and optimal TFN membranes (Fig. 16). It is well established that the salt rejection of NF membrane is closely associated with the size exclusion effect and Donnan exclusion effect. In this study, the three tested composite NF membranes all showed the same sequence of salt rejections: Na2SO4 > MgSO4 > MgCl2 > NaCl, which was consistent with the negatively charged NF membrane characteristics. As illustrated in Fig. 17, these three NF membranes were negatively charged once the pH value was greater than the isoelectric point (IEP), and thus offered a stronger repulsive force to divalent SO42− than to monovalent Cl−. Meanwhile, SO42− has a lower diffusion coefficient than Cl− due to its larger Stokes radius (Table 2). As a result, SO42− needed to overcome more resistance to penetrate the membrane, which led to higher rejection to SO42− than to Cl−. On the other hand, based on the Donnan electrostatic exclusion mechanism, the rejection towards the salts having the same anion mainly depends on the diffusion coefficient of cations. Therefore, the higher diffusivity of Na+ than that of Mg2+ resulted in the lower rejection to NaCl than to MgCl2.
It is also interesting to note that two opposite effects were present here for the salt rejection. As described above that the top selective layer of TFN membrane became loose after introducing MAH-GO and GO nanosheets, which decreased the salt rejection. However, TFN-MG-60 and TFN-GO-80 membranes possessed more negative charge attributed to the ionisable groups in MAH-GO and GO, greatly increasing the salt rejection due to the strong Donnan effect. Consequently, TFN-MG-60 and TFN-GO-80 membranes retained the high salt rejections comparable to that of TFC-blank. Between the two modified TFN membranes, TFN-MG-60 exhibited more negatively charged than TFN-GO-80 due to more –COOH in MAH-GO, which agreed well with the zeta potentials of their nanosheets (Table 6).
| Nanofiller | Concentration (ppm) | Zeta potentials (mV) |
|---|---|---|
| MAH-GO | 60 | −40.0 ± 1.4 |
| GO | 80 | −27.9 ± 0.2 |
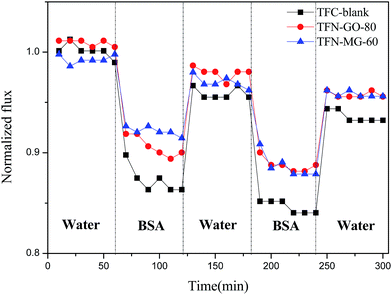
A two-cycle cross-flow filtration process was carried out using BSA as a model foulant to evaluate the antifouling properties of the TFC-blank and optimized TFN NF membranes at 0.6 MPa and 25 °C. As illustrated in Fig. 18, the BSA fluxes of all three NF membranes gradually declined as a result of the concentration polarization and membrane fouling. The pure water fluxes couldn't be completely recovered to the initial value after cleaning by fresh water, indicating the irreversible adsorption of some protein molecules on membrane surfaces or nanopores.41 Interestingly, both of the engineered TFN membranes showed higher normalized fluxes than TFC-blank membrane, which suggested that the antifouling property was significantly improved by incorporation of MAH-GO and GO nanosheets. Furthermore, the normalized flux of TFN-MG-60 was higher than that of TFN-GO-80. This indicated that TFN-MG-60 possessed the superior antifouling performance than TFN-GO-80. On one hand, the hydrophilic groups of MAH-GO and GO in PPA matrix may facilitate to form a regular hydration layer on the membrane surface via hydrogen bond, and the protein was excluded from the hydration layer to avoid the substantial entropy loss caused by the entrance of large protein molecules into the membrane surface.20 On the other hand, given that the model foulant (BSA) was negatively charged in this experiment, the BSA adsorption on the membrane surface with a more negatively charge was alleviated due to the charge repulsion effect. Therefore, the sequence of antifouling performance was TFN-MG-60 > TFN-GO-80 > TFC-blank. This result matched very well with their sequences of hydrophilicity and surface charge.
Compared with PPA NF membranes using GO in the aqueous phase42 or GO-COCl in the organic phase,37 the nanocomposite NF membrane using MAH-GO in this study exhibited the better performance.
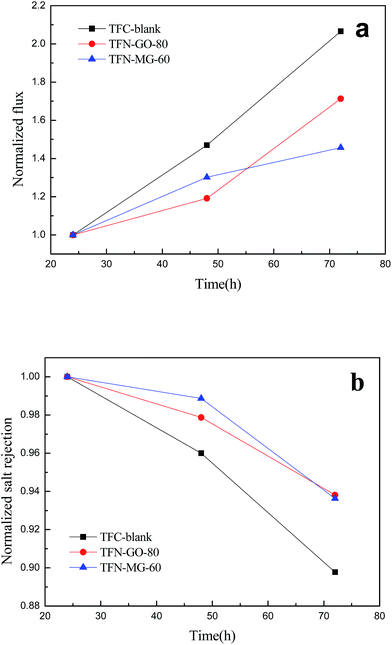
After a long exposure period (72 h) to a 2000 ppm chlorine solution, the chlorine resistances of the TFC-blank and optimal TFN membranes were evaluated based on the normalized water flux and salt rejection. As shown in Fig. 19, the three NF membranes exhibited an obvious increase in water flux and a slight decrease in salt rejection after chlorine treatment. It was noted that both TFN-MG-60 and TFN-GO-80 membrane showed higher stability under chlorine attack, compared with TFC-blank. This demonstrates that the chlorine resistance was effectively enhanced by incorporation of a small amount of MAH-GO and GO nanosheets in the PPA active layer. Chlorine is able to degrade polyamide macromolecules via a nucleophilic substitution reaction between chlorine and the hydrogen of the secondary amide group (–NH) in polyamide,43 and thus reduce the membrane performance. Notably, the secondary amines of PIP reacted with TMC will change into tertiary amines, which can tolerate the active chlorine attack. However, the other unreacted secondary amines would degrade after the active chlorine attack. The increased chlorine resistance of TFN-MG-60 and TFN-GO-80 can be mainly attributed to the hydrogen bonding between PPA and MAH-GO/GO that functioned as a protection mechanism against the chlorine attack.44 Moreover, the MAH-GO and GO nanosheets offered additional protection for the underlying PPA against the chlorine attack.45
4 Conclusions
With the aim of improving membrane performance, this study synthesized MAH-GO by combining MAH molecules with the GO nanosheets and introducing the resulting materials into the PPA skin layer via interfacial polymerization. The XPS analysis verified the successful incorporation of MAH-GO nanosheets in the PPA active layer of modified NF membrane. The effects of the concentrations of MAH-GO and GO nanosheets on the morphologies and performance of the resultant TFN NF membranes were systematically studied. The optimum concentrations of TFN-MG and TFN-GO series membranes were identified to be 60 and 80 ppm. Compared with the TFC-blank membrane, both TFN-MG-60 and TFN-GO-80 membranes demonstrated significantly enhanced performance without the reduction of salt rejection. Particularly, the pure water fluxes of TFN-MG-60 and TFN-GO-80 membranes were 76.7% and 50.5% higher than that of TFC-blank membrane. Between the two engineered membranes, TFN-MG-60 exhibited superior hydrophilicity, water permeability, antifouling capability and chlorine resistance over TFN-GO-80, largely due to enhanced hydrophilicity and charge density of MAH-GO nanosheets as a result of the increase in the number of carboxyl groups. Therefore, MAH-GO is considered as a promising nanomaterial for developing the high-performance TFN NF membrane to overcome the trade-off effect of conventional TFC membranes.Conflicts of interest
There are no conflicts to declare.Acknowledgements
We thank the financial supports from the Scientific Research Foundation of Third Institute of Oceanography, SOA (No. 2016036), the Science & Technology Planning Project of Xiamen City, China (No. 3502Z20172008), the National Natural Science Foundation of China (NSFC 21535007), the Fundamental Research Funds for the Central Universities (No. 20720170027) and the National Natural Science Foundation of China (No. 21736009).References
- W. J. Lau, A. F. Ismail, N. Misdan and M. A. Kassim, Desalination, 2012, 287, 190–199 CrossRef CAS.
- A. W. Mohammad, Y. H. Teow, W. L. Ang, Y. T. Chung, D. L. Oatley-Radcliffe and N. Hilal, Desalination, 2015, 356, 226–254 CrossRef CAS.
- Y. Y. Pan, R. P. Xu, Z. H. Lu, S. C. Yu, M. H. Liu and C. J. Gao, J. Membr. Sci., 2017, 523, 282–290 CrossRef CAS.
- Y. L. Ji, Q. F. An, Y. S. Guo, W. S. Hung, K. R. Lee and C. J. Gao, J. Mater. Chem. A, 2016, 4, 4224–4231 CAS.
- N. Misdan, A. F. Ismail and N. Hilal, Desalination, 2016, 380, 105–111 CrossRef CAS.
- Y. J. Tang, Z. L. Xu, S. M. Xue, Y. M. Wei and H. Yang, J. Membr. Sci., 2016, 498, 374–384 CrossRef CAS.
- X. Q. Cheng, Y. Y. Liu, Z. H. Guo and L. Shao, J. Membr. Sci., 2015, 493, 156–166 CrossRef CAS.
- G. S. Lai, W. J. Lau, P. S. Goh, A. F. Ismail, N. Yusof and Y. H. Tan, Desalination, 2016, 387, 14–24 CrossRef CAS.
- M. E. A. Ali, L. Y. Wang, X. Y. Wang and X. S. Feng, Desalination, 2016, 386, 67–76 CrossRef CAS.
- W. J. Lau, S. Gray, T. Matsuura, D. Emadzadeh, J. P. Chen and A. F. Ismail, Water Res., 2015, 80, 306–324 CrossRef CAS PubMed.
- A. F. Ismail, M. Padaki, N. Hilal, T. Matsuura and W. J. Lau, Desalination, 2015, 356, 140–148 CrossRef CAS.
- Q. Li, Y. H. Wang, J. Song, Y. P. Guan, H. Yu, X. H. Pan, F. Y. Wu and M. Zhang, Appl. Surf. Sci., 2015, 324, 757–764 CrossRef CAS.
- L. M. Jin, S. L. Yu, W. X. Shi, X. S. Yi, N. Sun, Y. L. Ge and C. Ma, Polymer, 2012, 53, 5295–5303 CrossRef CAS.
- L. M. Jin, W. X. Shi, S. L. Yu, X. S. Yi, N. Sun, C. Ma and Y. S. Liu, Desalination, 2012, 298, 34–41 CrossRef CAS.
- H. S. Lee, S. J. Im, J. H. Kim, H. J. Kim, J. P. Kim and B. R. Min, Desalination, 2008, 219, 48–56 CrossRef CAS.
- B. Rajaeian, A. Rahimpour, M. O. Tade and S. M. Liu, Desalination, 2013, 313, 176–188 CrossRef CAS.
- S. M. Xue, Z. L. Xu, Y. J. Tang and C. H. Ji, ACS Appl. Mater. Interfaces, 2016, 8, 19135–19144 CAS.
- N. Zarrabi, M. E. Yekavalangi, V. Vatanpour, A. Shockravi and M. Safarpour, Desalination, 2016, 394, 83–90 CrossRef.
- V. Vatanpour, S. S. Madaeni, R. Moradian, S. Zinadini and B. Astinchap, J. Membr. Sci., 2011, 375, 284–294 CrossRef CAS.
- L. Yu, Y. T. Zhang, B. Zhang, J. D. Liu, H. Q. Zhang and C. H. Song, J. Membr. Sci., 2013, 447, 452–462 CrossRef CAS.
- Q. Q. Zhao, J. W. Hou, J. N. Shen, J. D. Liu and Y. T. Zhang, J. Mater. Chem. A, 2015, 3, 18696–18705 CAS.
- J. Zhu, M. Tian, J. Hou, J. Wang, J. Lin, Y. Zhang, J. Liu and B. Van der Bruggen, J. Mater. Chem. A, 2016, 4, 1980–1990 CAS.
- J. I. Paredes, S. Villar-Rodil, A. Martinez-Alonso and J. M. Tascon, Langmuir, 2008, 24, 10560–10564 CrossRef CAS PubMed.
- H. R. Chae, J. Lee, C. H. Lee, I. C. Kim and P. K. Park, J. Membr. Sci., 2015, 483, 128–135 CrossRef CAS.
- L. He, L. F. Dumee, C. F. Feng, L. Velleman, R. Reis, F. H. She, W. M. Gao and L. X. Kong, Desalination, 2015, 365, 126–135 CrossRef CAS.
- J. Yin, G. C. Zhu and B. L. Deng, Desalination, 2016, 379, 93–101 CrossRef CAS.
- J. Wang, C. W. Zhao, T. Wang, Z. Wu, X. Li and J. S. Li, RSC Adv., 2016, 6, 82174–82185 RSC.
- S. Bano, A. Mahmood, S. J. Kim and K. H. Lee, J. Mater. Chem. A, 2015, 3, 2065–2071 CAS.
- S. J. Xia, L. J. Yao, Y. Zhao, N. N. Li and Y. Zheng, Chem. Eng. J., 2015, 280, 720–727 CrossRef CAS.
- L. Shao, X. Q. Cheng, Z. X. Wang, J. Ma and Z. H. Guo, J. Membr. Sci., 2014, 452, 82–89 CrossRef CAS.
- R. Ding, H. Q. Zhang, Y. F. Li, J. T. Wang, B. B. Shi, H. Mao, J. C. Dang and J. D. Liu, Chem. Eng. Sci., 2015, 138, 227–238 CrossRef CAS.
- F. Kim, L. J. Cote and J. Huang, Adv. Mater., 2010, 22, 1954–1958 CrossRef CAS PubMed.
- L. J. Cote, J. Kim, V. C. Tung, J. Y. Luo, F. Kim and J. X. Huang, Pure Appl. Chem., 2011, 83, 95–110 CAS.
- W. S. Hung, Q. F. An, M. De Guzman, H. Y. Lin, S. H. Huang, W. R. Liu, C. C. Hu, K. R. Lee and J. Y. Lai, Carbon, 2014, 68, 670–677 CrossRef CAS.
- Q. Xie, S. Zhang, Z. Xiao, X. Hu, Z. Hong, R. Yi, W. Shao and Q. Wang, RSC Adv., 2017, 7, 18755–18764 RSC.
- D. X. Wang, M. Su, Z. Y. Yu, X. L. Wang, M. Ando and T. Shintani, Desalination, 2005, 175, 219–225 CrossRef CAS.
- P. Wen, Y. B. Chen, X. Y. Hu, B. W. Cheng, D. Q. Liu, Y. F. Zhang and S. Nair, J. Membr. Sci., 2017, 535, 208–220 CrossRef CAS.
- H. B. Li, H. X. Zhang, X. H. Qin and W. Y. Shi, Appl. Surf. Sci., 2017, 407, 260–275 CrossRef CAS.
- J. Wang, C. Zhao, T. Wang, Z. Wu, X. Li and J. Li, RSC Adv., 2016, 6, 82174–82185 RSC.
- H. R. Chae, C. H. Lee, P. K. Park, I. C. Kim and J. H. Kim, J. Membr. Sci., 2017, 525, 99–106 CrossRef CAS.
- L.-L. Hwang, J.-C. Chen and M.-Y. Wey, Desalination, 2013, 313, 166–175 CrossRef CAS.
- M. Safarpour, V. Vatanpour, A. Khataee and M. Esmaeili, Sep. Purif. Technol., 2015, 154, 96–107 CrossRef CAS.
- J. Glater, S. K. Hong and M. Elimelech, Desalination, 1994, 95, 325–345 CrossRef CAS.
- F. Perreault, M. E. Tousley and M. Elimelech, Environ. Sci. Technol. Lett., 2014, 1, 71–76 CrossRef CAS.
- W. Choi, J. Choi, J. Bang and J. H. Lee, ACS Appl. Mater. Interfaces, 2013, 5, 12510–12519 CAS.
| This journal is © The Royal Society of Chemistry 2017 |

