 Open Access Article
Green preparation of nitrogen doped carbon quantum dot films as fluorescent probes
Yanfei Hea,
Lina Lianga,
Qinghao Liu *a,
Jinchun Guob,
Dong Lianga and
Hongyan Liuc
aSchool of Chemical Engineering and Technology, North University of China, Taiyuan 030051, Shanxi Province, People's Republic of China. E-mail: liuqinghao@nuc.edu.cn
bSchool of Environmental and Safety Engineering, North University of China, Taiyuan 030051, Shanxi Province, People's Republic of China
cInstitute of Plant Protection, Henan Academy of Agricultural Sciences, Zhengzhou 450002, Henan Province, People's Republic of China
First published on 12th December 2017
Abstract
To prepare nitrogen doped carbon dots (NCDs) with excellent luminescence efficiency, a facile hydrothermal method was developed using cabbage juice as the carbon source and poly ethylene polyamine (PP) as the nitrogen source. Then, as-prepared NCDs were grafted onto calcium alginate to produce calcium alginate film (CA-NCDs), and the CA-NCDs were used as a fluorescent probe. The significant quenching effect of Fe3+ was established. The ratio of fluorescence intensity (F/F0) of the CA-NCDs had a linear relationship with the concentration of Fe3+ within the range of 0 to 48 μM (R2 was 0.9947) and the detection limit was 1.4 nM. In addition, the recovery of spiked samples ranged from 98.6% to 103.1%. Most importantly, the amino-functionalized CA-NCD fluorescent probe can be successfully applied for the detection of trace Fe3+ in water samples.
The ferric ion (Fe3+) is one of the most essential metal ions in immune systems, playing a significant role in many pathological and physiological processes including oxidation reactions, cellular metabolism, electron transfer, as well as RNA and DNA synthesis.1–3 Therefore, it is significant to establish effective analytical methods for highly sensitive and selective detection of Fe3+ in aqueous solutions.4 Recently, a variety of detection methods, such as atomic absorption/emission spectroscopy, atomic fluorescence spectrometry (CV-AAS),5–7 and inductive coupled plasma atomic emission spectroscopy (ICP-MS),8–10 have been developed to measure the level of Fe3+. However, most of these methods usually suffered from expensive instrumentation, complicated operation and the use of toxic and expensive reagents, which limited their practical applications in the routine monitoring of Fe3+.11,12 It is necessary to develop an economical, simple, and green strategy to synthesize optical probes. Thanks to its ease of operation, fast response and high efficiency, the fluorescent probe has been one of the most feasible and promising methods to solve the aforementioned problems.13–15
Carbon quantum dots (CDs) have attracted much attention due to their unique properties,16–21 including high quantum yield,22 low cost, low toxicity, good biocompatibility,23 good dispersibility in aqueous solution,24 ease of functionalization,25 etc. Meanwhile, CDs have been applied in various fields such as bioimaging,26,27 medical diagnosis, analytical chemistry,28 etc. However, the fluorescence quantum yield of CDs is relatively low.29,30 But recently, some research reported that the fluorescence properties of CDs were improved by doping nitrogen into the carbon nanoparticles.31,32 The reason is probably that the large conjugated carbon structure of CDs is broken and the surface defects of CDs was passivated.33 Furthermore, CDs in aqueous solution are not easy to recycle.
Herein, green NCDs have been synthesized with cabbage juice as the carbon source and polyethylene polyamine as the nitrogen source. Moreover, the as-prepared NCDs were grafted onto calcium alginate and a calcium alginate thin film was obtained. Due to the fluorescence quenching effect of Fe3+ on CA-NCDs, CA-NCDs were used as a fluorescent probe and applied to the Fe3+ detection.
1 Experimental
1.1 Chemicals and instruments
Cabbage was purchased from the local market. Poly ethylene polyamine (PP), HgCl2, AlCl3, CuCl2, CaCl2, FeCl3, NaCl, MgCl2, AgCl, KNO3, MnSO4·H2O, Zn(NO3)2, Ba(NO3)2, Zn(NO3)2 and Ni(NO3)2 were purchased from Tianjin Chemical Reagent Co. All reagents were of analytic grade and used as received without any further purification. Doubly distilled water was used in all experiments. Tap water samples were collected from our laboratory, and lake water samples were obtained from the Fen River in Taiyuan City, Shanxi Province, China. All water samples were used without any further pretreatment.All fluorescence measurements were performed using a Cary Eclipse fluorescence spectrophotometer (Varian, American), Fourier transform infrared (FTIR) spectra were recorded on a Fourier-transform infrared spectrometer (8400S, Daojin, Japan). Absorption spectra were recorded using a UV-vis double-beam spectrometer (UV-2450, Purkinje Daojin, Japan).
1.2 Synthesis of NCDs
35 mL cabbage juice were transferred into a 100 mL stainless-steel teflon lined vessel and heated at 200 °C for 5 h. After the reaction, the reactor was cooled down to room temperature. Then, poly ethylene polyamine was added, and the solution was hydrothermally treated again at 200 °C for another 5 h. Transparent brown-yellow solution was gained after the reactors cooled down to room temperature. The product was centrifuged at a high speed (12![[thin space (1/6-em)]](https://www.rsc.org/images/entities/char_2009.gif) 000 rpm) for 10 min to remove the large particles, and then the solution was dialyzed in a dialysis bag for 3 d (Mw = 3000). Eventually, pure NCDs were obtained by rotary evaporation.
000 rpm) for 10 min to remove the large particles, and then the solution was dialyzed in a dialysis bag for 3 d (Mw = 3000). Eventually, pure NCDs were obtained by rotary evaporation.
1.3 Preparation of CA-NCDs
1.8 g calcium alginate was dissolved in 10 mL NCDs and 50 mL deionized water, the mixture solution was magnetic stirred for 4 h. Then, the solution was statically defoamed. The sodium alginate sol was poured into the culture dish by tape casting. A dense crosslinked calcium alginate film (CA-NCDs) was formed by spraying 1.5 mol L−1 CaCl2 solution to the surface of sodium alginate sol, and then vacuum dried at 50 °C to constant weight.1.4 Fluorescence detection of Fe3+ by CA-NCDs
CA-NCDs was added into 3 mL of Fe3+ solution, followed by adding Fe3+ ions solution with different concentrations (0, 4, 8, 12, 16, 20, 24, 28, 32, 36, 40, 44, 48 μM), then filtered and dried at 50 °C under vacuum. All samples were incubated for 30 min at room temperature and recorded the fluorescence spectra at the excitation wavelength of 350 nm. The used films were immersed in ethylenediaminetetraacetic acid (EDTA) solution for 5 min, rinsed repeatedly with deionized water, and vacuum dried to constant weight. They were used for repeated examinations of Fe3+ ions.2 Results and discussion
2.1 Optical properties of the CA-NCDs
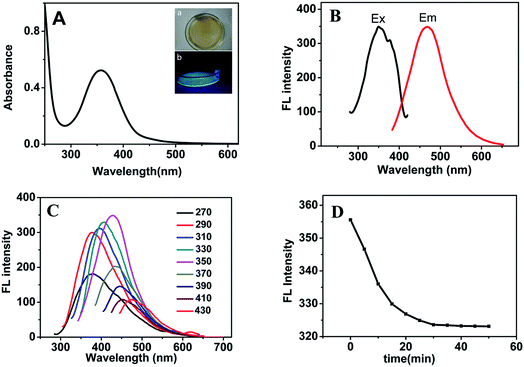
The UV-vis absorption and fluorescence spectra of CA-NCDs were studied and shown in Fig. 1. As shown in Fig. 1A, the UV-vis absorption spectrum of CA-NCDs show a broad absorption band with a strong peak at 350 nm, which could be ascribed to the n–π* transition of the C![[double bond, length as m-dash]](https://www.rsc.org/images/entities/char_e001.gif) O bond and π–π* transition of C
O bond and π–π* transition of C![[double bond, length as m-dash]](https://www.rsc.org/images/entities/char_e001.gif) C.34,35 The peak at 350 nm is due to the trapping of excited state energy on the CA-NCDs surfaces.36–38 The CA-NCDs are yellow color under daylight (Fig. 1A-a) and emits a bright blue fluorescence under the illumination of 365 nm UV light (Fig. 1A-b). The fluorescent quantum yield of CA-NCDs is about 53.3% using quinine sulfate (QY 54% in 0.1 mol L−1 H2SO4, λex = 360 nm) as the reference.
C.34,35 The peak at 350 nm is due to the trapping of excited state energy on the CA-NCDs surfaces.36–38 The CA-NCDs are yellow color under daylight (Fig. 1A-a) and emits a bright blue fluorescence under the illumination of 365 nm UV light (Fig. 1A-b). The fluorescent quantum yield of CA-NCDs is about 53.3% using quinine sulfate (QY 54% in 0.1 mol L−1 H2SO4, λex = 360 nm) as the reference.
As shown in Fig. 1B, the fluorescence spectra of CA-NCDs reveal that the maximum excitation wavelength is at 350 nm, and exhibit a narrow and symmetrical emission peak which appear at 469 nm. The significantly increase of fluorescence intensity of CA-NCDs might be attribute to the defects on CA-NCDs surface and the passivation of functional groups.36,38
As shown in Fig. 1C, the fluorescence intensity increases initially till 350 nm and then decreases gradually with increasing excitation wavelength, indicating an excitation-dependent emission. Such a behavior can be explained by the different sizes of CA-NCDs and the distribution of different surface states. The excitation wavelength is at 350 nm and the strongest emission is at 469 nm, which is consistent to most reports of CA-NCDs.39,40
Fig. 1D shows the fluorescence intensity of CA-NCDs varying with time. At a given time, the fluorescence intensity decreases constantly with time. However, when the incubation time is above 30 min, the decrease of the fluorescence intensity with time becomes insignificant. Also, the fluorescence intensity at 30 min is very close to that at 50 min. Therefore, 30 min was identified as the optimal incubation time.
2.2 Characterization of the CA-NCDs
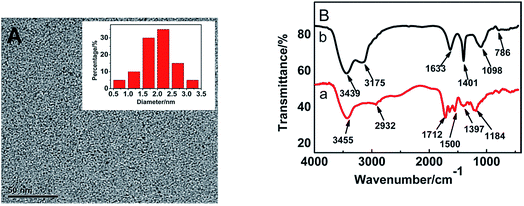
The morphology of CA-NCDs was characterized by transmission electron microscopy (TEM). As shown in Fig. 2A, these CA-NCDs are mostly spherical shape that are uniform, highly monodisperse and no aggregation emerged, with an average diameter of about 1.8 nm. | ||
| Fig. 2 (A) TEM image of the CA-NCDs. Inset shows the distribution of particle sizes (B) FTIR spectrum of NCDs (a) and CA-NCDs (b). | ||
Fig. 2B shows FTIR spectra of NCDs and CA-NCDs. For NCDs (Fig. 2B-a), the peak at 3455 cm−1 is correspond to the stretching vibrations of O–H and N–H, which reveals that the amino and hydroxy groups of NCDs, and demonstrate the good water-solubility of NCDs. The FTIR spectrum also exhibits stretching vibration absorption band of C–H at 2923 cm−1.41,42 Furthermore, peaks at 1712 cm−1, 1397 cm−1, 1184 cm−1 and 1500 cm−1 are originated from C![[double bond, length as m-dash]](https://www.rsc.org/images/entities/char_e001.gif) O, N–H, C–N and C–O, respectively suggesting that NCDs have been successfully obtained. For CA-NCDs (Fig. 2B-b), the absorption peak at 3439 cm−1 is similar to those of the carbon dots. In comparison with Fig. 2B-a, the peaks at 1098 cm−1 come from the stretching vibrations of C–O in calcium alginate molecule. The C–O–Ca–O–Ca group is formed due to the cross-linking of calcium ions, so the stretching vibration absorption of C–O is enhanced. The peaks around 1633 cm−1 and 1410 cm−1 are attributed to the symmetric stretching vibration and asymmetric stretching vibration of C–H, respectively. Peak at 786 cm−1 corresponds to the stretching vibration of C–C in calcium alginate molecule.
O, N–H, C–N and C–O, respectively suggesting that NCDs have been successfully obtained. For CA-NCDs (Fig. 2B-b), the absorption peak at 3439 cm−1 is similar to those of the carbon dots. In comparison with Fig. 2B-a, the peaks at 1098 cm−1 come from the stretching vibrations of C–O in calcium alginate molecule. The C–O–Ca–O–Ca group is formed due to the cross-linking of calcium ions, so the stretching vibration absorption of C–O is enhanced. The peaks around 1633 cm−1 and 1410 cm−1 are attributed to the symmetric stretching vibration and asymmetric stretching vibration of C–H, respectively. Peak at 786 cm−1 corresponds to the stretching vibration of C–C in calcium alginate molecule.
2.3 Selectivity of the CA-NCDs for Fe3+ detection
To evaluate the selectivity and specificity of CA-NCDs as a fluorescent probe for Fe3+ detection, the fluorescence responses of CA-NCDs were investigated in the presence of different metal ions under same concentrations, including Hg2+, Cu2+, Pb2+, Mg2+, Al3+, K+, Na+, Ni2+, Zn2+, Ba2+, Fe3+, Ca2+, Mn2+ and Ag+. As shown in Fig. 3A, a strong fluorescence quenching is observed in the presence of Fe3+, while other metal ions show only a slight quenching effect on the fluorescence of CA-NCDs. This may be because the formed CA-NCDs-Fe3+ complexes would facilitate non-radiative electron/hole recombination annihilation through an effective electron transfer process, leading to the distinguished fluorescence quenching effects.42,43 The results indicate that the obtained CA-NCDs possess excellent selectivity towards Fe3+ and can serve as fluorescence probe for Fe3+ detecting.Fig. 3B shows the interference tests, it is seen that the fluorescence intensity of CA-NCDs remains almost unchanged after mixing with any one of the interference metal ions. However, the significant fluorescence quench is observed on further addition of Fe3+ even in the presence of each interfering metal ion, while the other metal ions shows only a slight quenching effect. The results indicate that these metal ions do not interfere with the detection of Fe3+. Since Fe3+ ions have strong affinity toward hydroxyl, carboxyl and amino groups of CA-NCDs than the other metal ions to form stable chelate complexes, it is reasonable to observe the outstanding selectivity and specificity of CA-NCDs to Fe3+. This suggests that the obtained CA-NCDs have high selectivity towards Fe3+ ions.
2.4 Fluorescence detection of Fe3+ using CA-NCDs
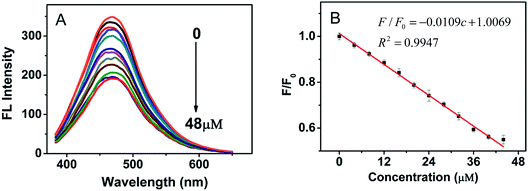
To further explore the interaction between Fe3+ and CA-NCDs. A series of Fe3+ ions solutions with the concentration range from 0 to 48 μM were added into the CA-NCDs with a fixed concentration. The fluorescence emission spectra was excited at the wavelength of 350 nm. As shown in Fig. 4A, the fluorescent intensity of CA-NCDs is gradually decreased with increasing the concentration of Fe3+. This is presumably due to the binding of Fe3+ on CA-NCDs surface accelerates the non-radiative recombination of the excitons through an effective electron transfer process,44 leading to a substantial decrease of the fluorescence of CA-NCDs.43 Fig. 4B clearly shows the linear relationship between fluorescence intensities and Fe3+ concentration, the calibration curve can be expressed as F/F0 = 1.0069 − 0.0109c with correlation coefficient (R2) of 0.9947 (F0 and F are the fluorescent intensities of the CA-NCDs without and with added Fe3+, respectively). The detection limit (3σ/s) for Fe3+ is 1.4 nM, where σ is the standard deviation of ten blank measurements, and s is the slope of the calibration curve, which is comparable or even better than those reported parameters in the literature.2.5 Repeatability study of Fe3+ detection
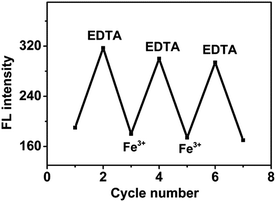
The fluorescence of CA-NCDs was quenched when Fe3+ was added, and recovered when the treated CA-NCDs were immersed in EDTA solution. As shown in Fig. 5, no. 1, 3, 5 and 7 are fluorescence intensity of CA-NCDs treated with Fe3+ ions solutions, and no. 2, 4 and 6 are that after recovered with EDTA solution. The results show that the fluorescence intensity of CA-NCDs changed regularly, leading to reproducible changes in fluorescence intensity over three cycles. Thus, the CA-NCDs could be serving as a reusable fluorescent probe for Fe3+ detection in water samples. | ||
| Fig. 5 Fluorescence intensity change for the hydrogel films after alternate treatment with an aqueous solution of Fe3+ (2 × 10⁻⁵ mol L−1) and EDTA (2 × 10⁻⁴ mol L−1). | ||
2.6 Fe3+ measurement in real water samples
To test the feasibility in real water samples, the CA-NCDs was further used to quantify the Fe3+ in mineral water, tap water and Fen River water by using UV-vis sensor. Fen River water was obtained from the Fen River water Taiyuan, Shanxi province, China. Wahaha mineral water was purchased from the local market. Tap water was obtained from the laboratory. The water samples were first filtered with medium speed filter paper, and then centrifuged at 12![[thin space (1/6-em)]](https://www.rsc.org/images/entities/char_2009.gif) 000 rpm for 10 min to remove the large suspended particles. The relative standard deviation values of Fe3+ and the recoveries were obtained. As shown in Table 1, the result demonstrated that the recovery is ranged from 98.6% to 103.1%. The results also show that the prepared CA-NCDs may be a potential sensing platform for the detection of Fe3+ in real water samples.
000 rpm for 10 min to remove the large suspended particles. The relative standard deviation values of Fe3+ and the recoveries were obtained. As shown in Table 1, the result demonstrated that the recovery is ranged from 98.6% to 103.1%. The results also show that the prepared CA-NCDs may be a potential sensing platform for the detection of Fe3+ in real water samples.
| Samples | Found (μM) | RSD (%) (n = 6) | Added (μM) | Total found (μM) | Recover (%) (n = 6) |
|---|---|---|---|---|---|
| Mineral water | 0.362 | 1.26 | 0.5 | 0.855 | 98.6% |
| Tap water | 0.380 | 1.98 | 0.5 | 0.886 | 101.2% |
| Fen River water | 0.573 | 2.03 | 0.7 | 1.295 | 103.1% |
3 Conclusions
In this work, a green, facile and low toxicity hydrothermal method has been developed and used for the preparation of water-soluble fluorescent N-doped carbon quantum dots. The obtained NCDs were grafted onto calcium alginate to form CA-NCDs. The CA-NCDs show a high fluorescence intensity and excitation-dependent emission behavior. Meanwhile, the CA-NCDs emitted strong blue fluorescence and their fluorescence can be quenched by Fe3+. There is a good linear relationship between the Fe3+ concentrations within 0–48 μM and the fluorescence quenching rates of CA-NCDs. Furthermore, the interaction of Fe3+ ions with CA-NCDs can be observed through the fluorescence quenching effect with EDTA. The CA-NCDs have good hydrophilic properties for ion detection in water and a higher recovery rate in practical water application.Conflicts of interest
There are no conflicts to declare.Acknowledgements
This work was supported by the National Natural Science Foundation of China (No. 21406211) and the Natural Science Foundation of Shanxi (No. 201701D221196).References
- R. L. Liu, D. Q. Wu, S. H. Liu, K. Koynov, W. Knoll and Q. Li, Angew. Chem., 2009, 48, 4598–4601 CrossRef CAS PubMed.
- G. Sivaraman, V. Sathiyaraja and D. Chellappa, J. Lumin., 2014, 145, 480–485 CrossRef CAS.
- E. M. Nolan and S. J. Lippard, J. Mater. Chem., 2005, 15, 2778–2783 RSC.
- Z. Yan, J. Shu, Y. Yu, Z. Zhang, Z. Liu and J. Chen, Luminescence, 2015, 30, 388–392 CrossRef CAS PubMed.
- X. J. Gong, W. J. Lu, M. C. Paau, Q. Hu, X. Wu, S. M. Shuang, C. Dong and M. M. Choi, Anal. Chim. Acta, 2015, 861, 74–84 CrossRef CAS PubMed.
- Z. Li, Y. Ni and S. Kokot, Biosens. Bioelectron., 2015, 74, 91–97 CrossRef CAS PubMed.
- M. Ghaedi, M. R. Fathi, A. Shokrollahi and F. Shajarat, Anal. Lett., 2006, 39, 1171–1185 CrossRef CAS.
- L. Fang, C. Zhao, Y. Chen, L. M. Sheng, K. An, L. M. Yu, W. Ren and X. L. Zhao, Carbon, 2015, 91, 408–415 CrossRef CAS.
- X. Y. Jia, Y. Han, X. L. Liu, T. C. Duan and H. T. Chen, Spectrochim. Acta, Part B, 2011, 66, 88–92 CrossRef.
- Y. J. Gong, X. B. Zhang, Z. Chen, Y. Yuan, Z. Jin, L. Mei, J. Zhang, W. Tan, G. L. Shen and R. Q. Yu, Analyst, 2012, 137, 932–938 RSC.
- L. Cao, X. Wang, M. J. Meziani, F. S. Lu, H. F. Wang, P. G. Luo, Y. Lin, B. A. Harruff, L. M. Veca, D. Murray, S.-Y. Xie and Y.-P. Sun, J. Am. Chem. Soc., 2007, 129, 11318–11319 CrossRef CAS PubMed.
- V. Roy, M. Amyot and R. Carignan, Environ. Sci. Technol., 2009, 43, 5605–5611 CrossRef CAS PubMed.
- F. X. Wang, Z. Y. Gu, W. Lei, W. J. Wang, X. F. Xia and Q. L. Hao, Sens. Actuators, B, 2014, 190, 516–522 CrossRef CAS.
- J. H. Kim, S. H. Han and B. H. Chung, Biosens. Bioelectron., 2011, 26, 2125–2129 CrossRef CAS PubMed.
- J. Ju and W. Chen, Biosens. Bioelectron., 2014, 58, 219 CrossRef CAS PubMed.
- R. Zhang and W. Chen, Biosens. Bioelectron., 2014, 55, 83 CrossRef CAS PubMed.
- X. H. Gao, Y. Z. Lu, R. Z. Zhang, S. J. He, J. Ju, M. M. Liu, L. Li and W. Chen, J. Mater. Chem. C, 2015, 3, 2302 RSC.
- W. Chen and A. Chem, Anal. Chem., 2015, 87, 1903 CrossRef PubMed.
- J. Ju, R. Zhang and W. Chen, Sens. Actuators, B, 2016, 228, 66–73 CrossRef CAS.
- J. Ju, R. Z. Zhang, S. J. He and W. Chen, RSC Adv., 2014, 4, 52583–52589 RSC.
- X. H. Gao, C. Du, Z. H. Zhuang and W. Chen, J. Mater. Chem. C, 2016, 4, 6927 RSC.
- S. N. Baker and G. A. Baker, Angew. Chem., Int. Ed. Engl., 2010, 49, 6726–6744 CrossRef CAS PubMed.
- Y. Xu, M. Wu, Y. Liu, X. Z. Feng, X. B. Yin, X. W. He and Y. K. Zhang, Chem.–Eur. J., 2013, 7, 2276–2283 CrossRef PubMed.
- J. J. Huang, Z. F. Zhong, M. Z. Rong, X. Zhou, X. D. Chen and M. Q. Zhang, Carbon, 2014, 70, 190–198 CrossRef CAS.
- F. Y. Yan, Y. Zou, M. Wang, X. L. Mu, N. Yang and L. Chen, Sens. Actuators, B, 2014, 192, 488–495 CrossRef CAS.
- J. Y. Hou, J. Dong, H. S. Zhu, X. Teng, S. Y. Ai and M. L. Mang, Biosens. Bioelectron., 2015, 68, 20–26 CrossRef CAS PubMed.
- Y. Zou, F. Y. Yan, T. C. Zheng, D. C. Shi, F. Z. Sun, N. Yang and L. Chen, Talanta, 2015, 135, 145–148 CrossRef CAS PubMed.
- G. Q. Xiang, L. L. Li, X. M. Jiang, L. J. He and L. Fan, Anal. Lett., 2013, 4, 706–716 CrossRef.
- T. Ueno and T. Nagano, Nat. Methods, 2011, 8, 642–645 CrossRef CAS PubMed.
- Y. S. Xia and C. Q. Zhu, Talanta, 2008, 1, 215–221 Search PubMed.
- S. Y. Lim, W. Shen and Z. Gao, Chem. Soc. Rev., 2015, 44, 362–381 RSC.
- S. Barman and M. Sadhukhan, J. Mater. Chem., 2012, 22, 21832–21837 RSC.
- C. Zhu, J. Zhai and S. Dong, Chem. Commun., 2012, 48, 9367–9369 RSC.
- J. I. Paredes, S. Villar-Rodil, A. Martínez-Alonso and J. M. D. Tascón, Langmuir, 2008, 24, 10560 CrossRef CAS PubMed.
- S. L. Hu, K. Y. Niu, J. Sun, J. Yang, N. Q. Zhao and X. W. Du, J. Mater. Chem., 2009, 19, 484–488 RSC.
- P. Anilkumar, X. Wang, L. Cao, S. Sahu, J. H. Liu, P. Wang, K. Korch, K. N. Tackett, A. Parenzan and Y. P. Sun, Nanoscale, 2011, 5, 2023–2027 RSC.
- X. Wang, L. Cao, S. T. Yang, F. S. Lu, M. J. Meziani, L. L. Tian, K. W. Sun, M. A. Bloodgood and Y. P. Sun, Angew. Chem., Int. Ed., 2010, 31, 5310–5314 CrossRef PubMed.
- Z. Z. Zhang, W. H. Sun and P. Y. Wu, ACS Sustainable Chem. Eng., 2015, 3, 1412–1418 CrossRef CAS.
- S. Zhu, Q. Meng, L. Wang, J. Zhang, Y. Song, H. Jin, K. Zhang, H. Sun, H. Wang and B. Yang, Angew. Chem., Int. Ed. Engl., 2013, 52, 3953–3957 CrossRef CAS PubMed.
- C. X. Wang, Z. Z. Xu, H. Cheng, H. H. Lin, M. G. Humphrey and C. Zhang, Carbon, 2015, 82, 87–95 CrossRef CAS.
- J. Y. Hou, J. L. Li, J. C. Sun, S. Y. Ai and M. L. Wang, RSC Adv., 2014, 70, 37342–37348 RSC.
- H. Huang, J. J. Lv, D. L. Zhou, N. Bao, Y. Xu, A. J. Wang and J. J. Feng, RSC Adv., 2013, 44, 21691–21696 RSC.
- L. Zhou, Y. H. Lin, Z. Z. Huang, J. S. Ren and X. G. Qu, Chem. Commun., 2012, 48, 1147–1149 RSC.
- Y. Hou, Q. Lu, J. Deng, H. Li and Y. Zhang, Anal. Chim. Acta, 2015, 866, 69–74 CrossRef CAS PubMed.
| This journal is © The Royal Society of Chemistry 2017 |


