
 Open Access Article
 This Open Access Article is licensed under a Creative Commons Attribution-Non Commercial 3.0 Unported Licence
Study on the cleavage of alkyl-O-aryl bonds by in situ generated hydroxyl radicals on an ORR cathode
Lei Wang ab,
Yongmei Chen*ab,
Shuangyan Liuab,
Haomin Jiangab,
Linan Wangab,
Yanzhi Sunab and
Pingyu Wan*ab
ab,
Yongmei Chen*ab,
Shuangyan Liuab,
Haomin Jiangab,
Linan Wangab,
Yanzhi Sunab and
Pingyu Wan*ab
aNational Fundamental Research Laboratory of New Hazardous Chemicals Assessment & Accident Analysis, Beijing University of Chemical Technology, Chaoyang District, No. 15, North 3rd Ring Road East, 100029 Beijing, P. R. China. E-mail: chenym@mail.buct.edu.cn; pywan@mail.buct.edu.cn; Tel: +86-13683294397 Tel: +86-13601227797
bInstitute of Applied Electrochemistry, Beijing University of Chemical Technology, Chaoyang District, No. 15, North 3rd Ring Road East, 100029 Beijing, P. R. China
First published on 6th November 2017
Abstract
Hydroxyl radicals (˙OH) generated by oxygen reduction reaction (ORR) were believed to be responsible for the electrochemical depolymerization of lignin in our previous study. However, the mechanism research was hard to carry out due to the recalcitrant nature of lignin. In this paper, 4-benzyloxyl phenol (PBP) and benzyl phenyl ether (BPE) were employed as lignin model compounds (LMCs). Based on the qualitative and quantitative analysis of the degradation products, a mechanism was put forward, which is that the in situ generated ˙OH selectively attacked the active site opposite to the phenolic hydroxyl group and induced the cleavage of the alkyl-O-aryl ether bond. The proposed mechanism was further verified by the electrochemical degradation of PBP under controlled conditions, which showed a positive correlation between the degradation efficiency of PBP and the concentration of in situ generated ˙OH radicals.
Introduction
Lignin is the second most abundant biomass in nature, and it is the only renewable resource which possesses aromatic structures.1 It is considered to be the most promising alternative for fossil fuels to provide platform chemicals for industrial application.2 However, less than 5% of lignin has been reported to be utilized nowadays due to its large molecular weight and irregular structure.3 In order to achieve low molecular weight (LMW) aromatic chemicals, researchers are trying to breakdown the linkages between the C9 units in lignin molecules. Fortunately, more than 2/3 of these linkages are ether bonds,4 which could be broken through various methods including pyrolysis, hydrogenolysis and chemical oxidation.5–10 Particularly, the oxidation process usually operates under mild temperature and pressure, which is favorable for large-scale industrial production. Reagents with mild oxidation capability, such as Co, V, Mn oxides and their complexes catalyzed O2 or organic oxidants (DDQ, TEMPO, ABTS and so on), have been used to depolymerize lignin.11–21 However, the recovery of these catalysts and the high cost of organic oxidants hinder the large-scale application.22–24Reactive oxygen species (ROS), mainly H2O2, ˙OH, and ˙O2−, could attack the active site on the benzene ring, leading to the breaking of benzene ring from its side chain.25 ROS could be continuously produced through the oxygen reduction reaction (ORR) on cathode thus avoiding extra expensive reagents. Previous study of our group has shown that 59.2% of lignin was depolymerized into LMW aromatic compounds for 1 h electrolysis under atmospheric pressure at 80 °C, but more than 20 kinds of products were found.26 During the research, we also found that the hydroxyl radicals might have played an important role in the cleavage of ether bonds in lignin molecules. However, systematic mechanism study based on product analysis is difficult to carry out because of the complexity of lignin degradation products, which hinders the improvement of the yield and reaction selectivity through further optimization of reaction conditions.
In this paper, two kinds of compounds containing alkyl-O-aryl bond, PBP (benzyl-O-phenolic) and BPE (benzyl-O-phenyl), were employed as lignin model compounds (LMCs). The cleavage mechanism of alkyl-O-aryl bond by ˙OH was proposed based on the qualitative and quantitative analysis of the degradation products, and the investigation of degradation rate under various ˙OH concentrations was conducted to verify the mechanism. Finally, this study will lay the foundation for large-scale application of the electrochemical depolymerization of lignin.
Experimental section
Materials and reagents
PBP (≥99%) was purchased from J&K Scientific (Beijing, China) and BPE (≥97%) was from Alfa Aesar a Johnson Matthey Company (Tianjin, China). The structures of the two LMCs were given in Fig. 1. Sodium bromocresol green (BG) was provided by Shanghai Macklin Biochemical Technology Co., Ltd (Shanghai, China). Water used in this study was deionized water (18 MΩ cm) and other chemicals were of analytical grade and commercially available, including diethyl ether, sodium hydroxide, hydrochloric acid (HCl, 37.5%) and isopropyl alcohol (IPA).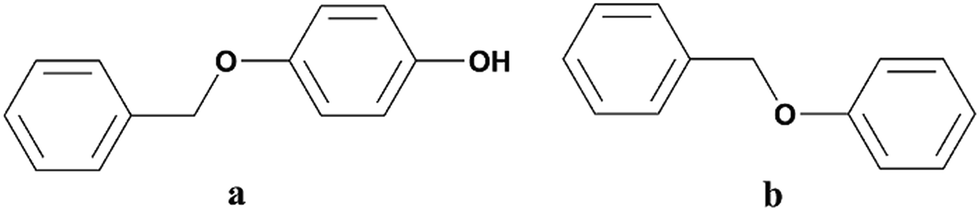 | ||
| Fig. 1 Structures of the two LMCs. (a) PBP, (b) BPE. | ||
Electrolysis and electrochemical test
The electrolysis was conducted on CT2001B LANHE electrochemical testing system (Wuhan, China). A plate-frame divided electrolytic cell was used for electrolysis, which possessed a RuO2–IrO2/Ti mesh (25 mm × 35 mm) anode provided by Northwest Institute For Non-ferrous Metals Research (Xi'an, China), and a self-made porous C-PTFE gas diffusion oxygen cathode (25 mm × 35 mm) according to literature.27 A piece of cation exchange membrane (25 mm × 35 mm) was placed in the middle to separate the anode chamber and cathode chamber. Electrolyte in the cathode chamber was 1 mol L−1 NaOH solution (40 mL), and the concentration of LMC was 0.0125 mol L−1, while electrolyte in the anode chamber was 40 mL 1 mol L−1 NaOH solution with no addition of LMC. The uniformity of solution and stability of temperatures were guaranteed by external circulation of the electrolyte, and the influence of different temperatures (20–80 °C), the amount of quenchers (0–0.04 g) and electrolysis times (1–4 h) were also investigated.The linear sweep voltammetry (LSV) test was carried out on the CHI660E electrochemical workstation (CH Instruments Ins. USA). Prior to the test, the electrolyte was purged with O2 or N2 bubble for 30 min. The three-electrode system was consisted of the above C-PTFE gas diffusion electrode as working electrode, the RuO2–IrO2/Ti mesh electrode as counter electrode, and a saturated calomel electrode (SCE, in saturated KCl solution) as reference electrode. And the test was conducted in 40 mL 1 mol L−1 NaOH solution at a sweep rate of 20 mV s−1.
Analysis of the degradation rate and products
The weight of LMC was accurately measured as w0 before the electrolysis. 10% hydrochloric acid was used to adjust the electrolyte to pH 2.0 after degradation, and precipitate (undegraded LMC) was produced. The precipitate was then filtered, washed with dilute hydrochloric acid (pH 2.0), dried in vacuum under 60 °C for 24 h, and weighed as the undegraded LMC (w1). On the other hand, the filtrate was extracted with diethyl ether for three times, and the extract liquids were mixed together. Then the obtained diethyl ether phase was concentrated by nitrogen purging, dried in vacuum, and weighed as ether phase product w2. The bottom aqueous phase was treated by rotary-evaporation, followed by the addition of ethanol to dissolve the products and centrifugation to remove the salt. Then the upper supernatant was dried in vacuum, and the white powders (aqueous phase products) were produced and weighed as w3. The total weight of the three parts was equal to the initial weight of LMC (the margin of error was 3%). The degradation rate and the yield of LMW products were calculated using eqn (1)–(3) as follows:
 | (1) |
 | (2) |
 | (3) |
The ether phase products were re-dissolved in 10 mL diethyl ether, and 1 mL was used for GC-MS analysis. The component of the ether phase products were determined by GC-MS (Shimadzu QP 2010 Plus) equipped with a DB-5 MS capillary column (30 m × 0.25 mm × 0.25 mm). 1 μL of the sample was injected and helium was used as carrier gas at a column flow rate of 1.74 mL min−1. The temperature program was conducted as follows: initial temperature was set at 45 °C for 5 min, then increased to 110 °C at 12 °C min−1, and maintained at 110 °C for 1 min. After that, the temperature was increased to 280 °C at the rate of 8 °C min−1 and maintained for 1 min. Mass spectra in the range of 35–700 (m/z) was recorded in full-scan mode with electron ionization (EI). The detected compounds were identified based on NIST database and the relative content of the products was quantified through relative peak areas.
Determination of hydroxyl radicals
The concentration of ˙OH was determined by the BG method.28 The electrolyte in cathode chamber was 40 mL 1 mol L−1 NaOH solution and the concentration of BG was 1 × 10⁻⁴ mol L−1. After electrolysis for 1 h, 5 mL of the electrolyte was transferred to a 25 mL volumetric flask and 10 mL deionized water was added. And then, sulfuric acid was added gradually until the solution turned yellow, followed by the addition of 5 mL NaAc-HAc (pH 3.6) buffer solution. Finally, deionized water was used to dilute the solution to the calibration mark. The absorbance of the above solution at 442 nm (Ai) and the blank BG solution without electrolysis (A0) were determined by UV-vis spectrophotometer (SHIMADZU UV-2550).Results and discussion
Hydroxyl radicals generated by ORR cathode
Fig. 2 shows the cathodic LSV curve in 1 mol L−1 NaOH solution under O2 atmosphere. Compared to that under N2 atmosphere, a reduction peak appeared around −0.75 V under O2 atmosphere, which is assigned to the 2-electron-reduction process of oxygen gas providing H2O2 in situ.29,30 As shown in eqn (4)–(9), the generated H2O2 could decompose into other ROS (including ˙OH) via ionization, reduction and restructuring in electrochemical system.31| H2O2 = H+ + HO2− | (4) |
| H2O2 + HO2− = ˙OH + ˙O2− + H2O | (5) |
| H2O2 + 2OH− = ˙O2− + 2H2O + e− | (6) |
| ˙O2− + ˙OH = O2 + OH− | (7) |
| 2˙O2− + H2O = 1O2 + HO2− + OH− | (8) |
| 1O2 + ˙O2− = O2 + ˙O2− | (9) |
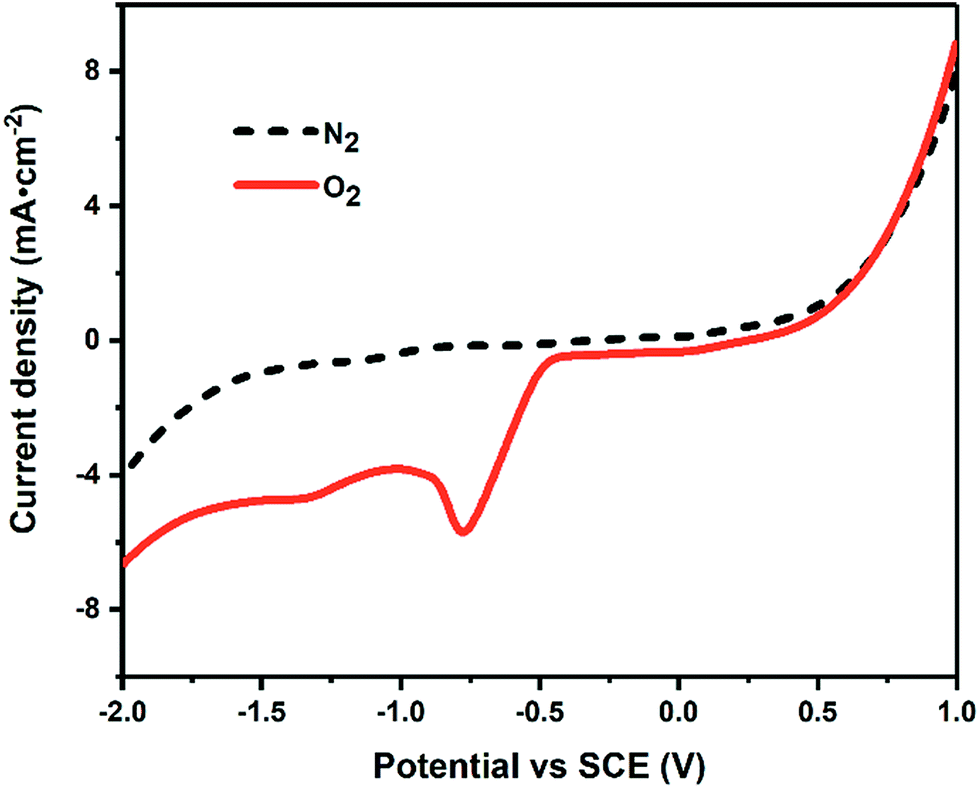 | ||
| Fig. 2 The cathodic LSV curve in 1.0 M NaOH under O2 (the solid line) and N2 (the dotted line) atmosphere at a scan rate of 20 mV s−1. | ||
Speculation of the bond-cleavage mechanism via product analysis
Previous studies have shown that ROS and some metal-catalyzed oxidation reagents usually involve with electrophilic attack of the active site on benzene ring,25,32 while alkali or acid catalyzed lignin depolymerization process is more prone to involve nucleophilic attack of Cα and Cβ.4 Based on the chemical properties of ˙OH radicals, it is concluded that the ˙OH radicals tend to attack the rich-electron sites on benzene ring as electrophilic reagents and act as a kind of strong oxidant as well.The degradation products of PBP through electrochemical degradation were analyzed by GC-MS. Five major products were listed in Table 1, namely 1,4-benzoquinone (P1), benzaldehyde (P2), benzyl alcohol (P3), benzoic acid (P4), and hydroquinone (P5).
| Product | P1 | P2 | P3 | P4 | P5 |
| Name | 1,4-Benzoquinone | Benzaldehyde | Benzyl alcohol | Benzoic acid | Hydroquinone |
| Formula | 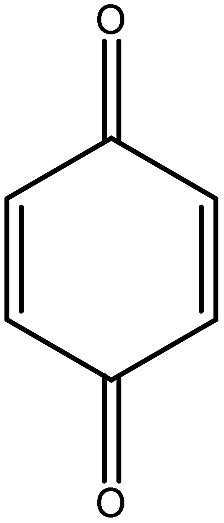 |
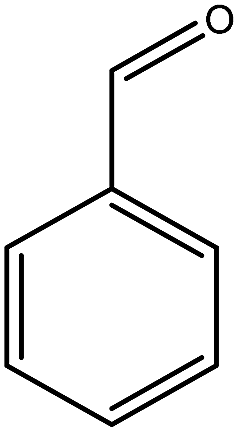 |
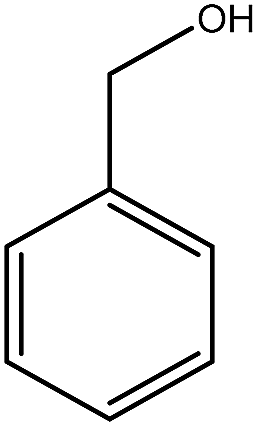 |
 |
 |
BPE, which has similar structure with PBP but no phenolic hydroxyl groups, was employed in electrochemical degradation under identical conditions as contrast. The main degradation products of BPE were phenol and benzyl alcohol. As shown in Table 2, the degradation rate of BPE was far less than that of PBP. BPE was barely degraded at either 20 °C or 80 °C with a degradation rate of no more than 2%, while the degradation rate of PBP was 40.5% and 65.1% at 20 °C and 80 °C, respectively. This phenomenon implies that the existence of phenolic hydroxyl groups provide the opportunity for ˙OH radicals to electrophilically attack the alkyl-O-aryl ether bonds.
Based on the analysis of the degradation products, the mechanism that the in situ generated ˙OH selectively attacks the active site on the opposite of phenolic hydroxyl group and induces the cleavage of alkyl-O-aryl bond was proposed. The reaction scheme was given in Fig. 3. PBP exists in the formation of phenol hydroxyl anion due to alkaline medium, and then being oxidized by ˙OH radical to form phenoxy radical. After that, the phenoxy radical transforms to their resonant quinone structure, causing the C atom on the opposite of phenolic hydroxyl group to become an activated site for electrophilic attack. Finally, another ˙OH radical attacks the active site as electrophilic reagents, which leads to the cleavage of ether bond and degradation of the compound.
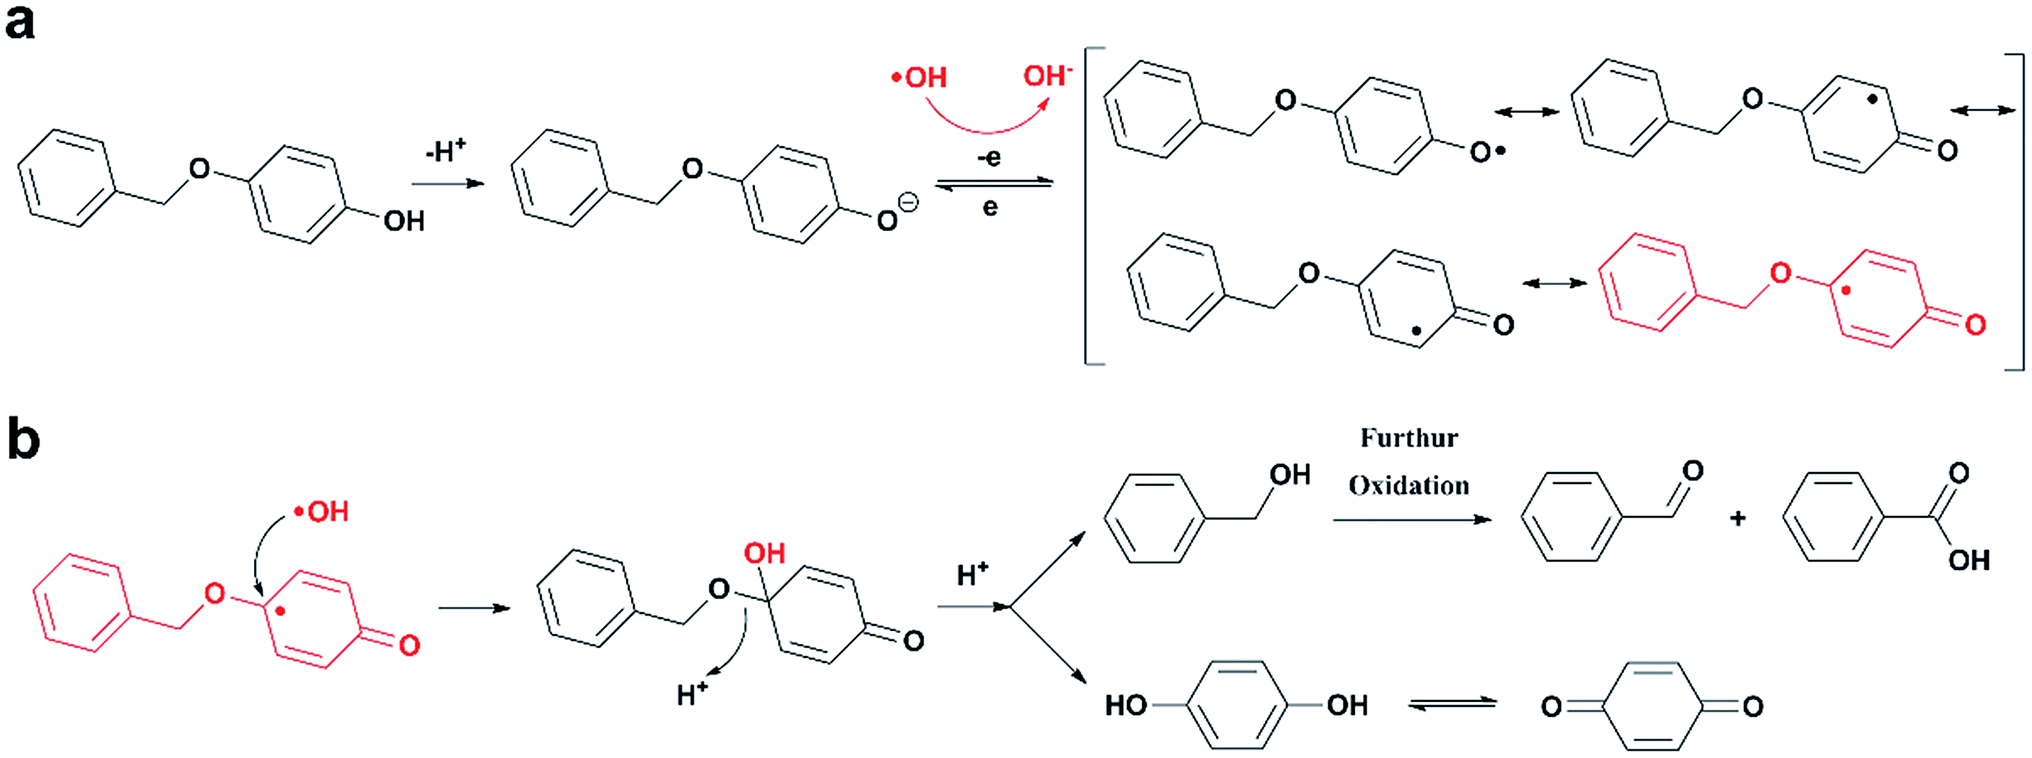 | ||
| Fig. 3 Scheme of PBP oxidative bond-cleavage. | ||
The regulation of ˙OH concentration
The concentration of H2O2 produced by ORR could be easily controlled by different electrolytic conditions including current density, O2 concentration etc. More interestingly, the concentration of ˙OH radicals could be further controlled by adjusting the decomposition rate of H2O2 (for example, changing the temperature) or adding radical quenchers like isopropyl alcohol (IPA).As is known, the oxidation capacity of ˙OH (Eθ = 2.8 V vs. NHE) is much stronger than those of H2O2 (E = 0.867 V, pH = 14) and ˙O2− (E = 0.20 V, pH = 14). Parimala L.'s group reported that the decolorization rate of BG was only 5% after 24 h when H2O2 (2 wt%) was present, whereas obvious decolorization was observed in 6 h when Cu nanoparticles were added as catalyst for H2O2 decomposition to generate ˙OH radicals.33 This indicates that ˙OH is the only one in ROS that is capable to degrade BG. Further studies have shown that ˙OH degrade BG by attacking the π–π conjugate bond, and the amount of the attacked BG molecules is proportional to the concentration of ˙OH radicals.34 That is, the decrement in the absorbance of BG at 442 nm (ΔA) is in direct proportion to the concentration of ˙OH radicals. Therefore, the BG method was applied in this work to measure and regulate the amount of the in situ generated ˙OH radicals.
The UV-vis spectrum of BG solution in cathode chamber at different temperatures for 1 h were given in Fig. 4a. The decrement in BG absorbance (ΔA) increased as the temperature increased, which confirmed the amount of generated ˙OH radicals in the cathode chamber increased along with rising temperature. Fig. 4b shows the UV-vis spectrum of BG solution in cathode chamber in the presence of different amount of IPA at 20 °C for 1 h. It was shown that the value of ΔA decreased as the amount of IPA increased, and the increasing amount of IPA would consequently reduce the concentration of ˙OH if the amount of IPA was not sufficient to quench the entire ˙OH radicals.
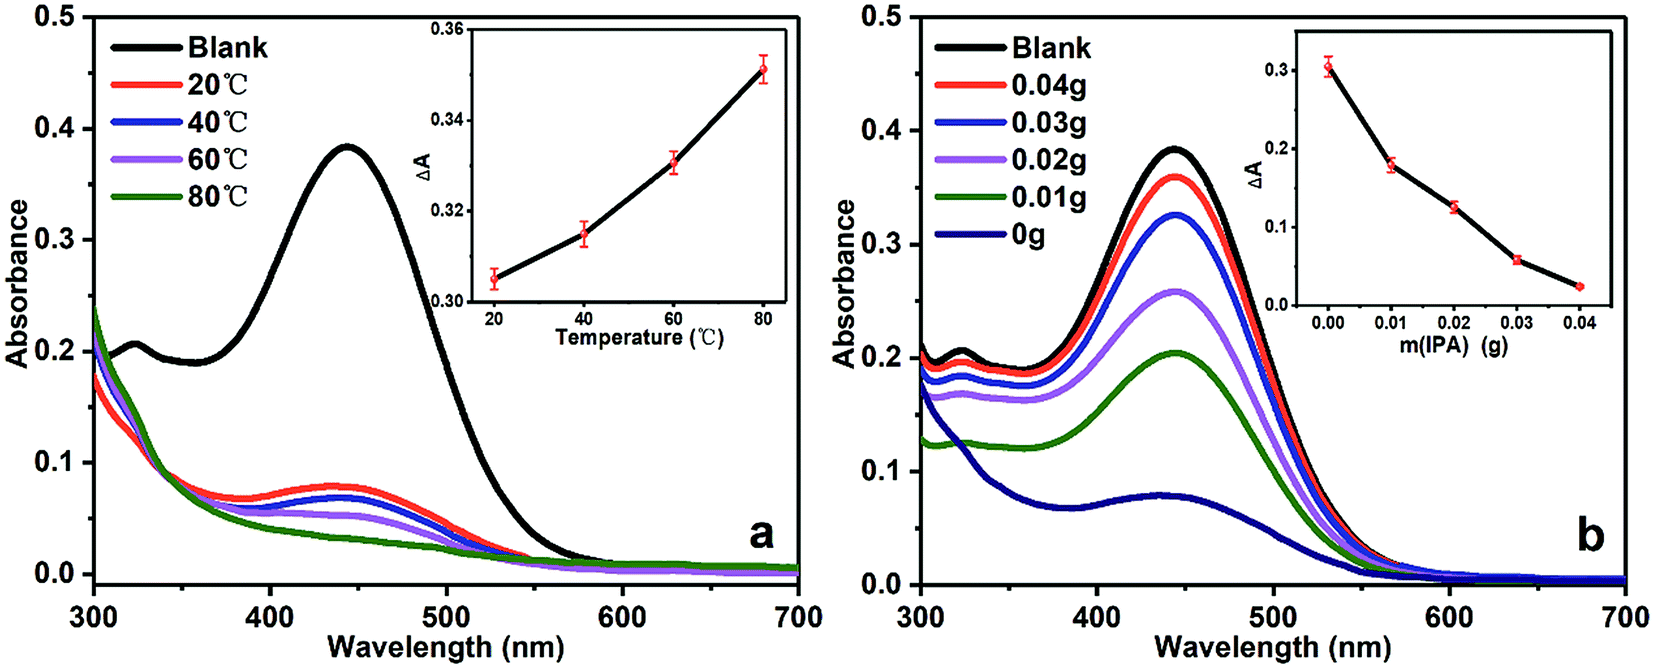 | ||
| Fig. 4 The UV-vis spectrum of BG solution degraded under different conditions. (a) Different temperatures, (b) different amount of IPA. | ||
The above results confirm that the concentration of in situ generated ˙OH radicals could be regulated carefully, which is of great help for mechanism study.
The degradation rate and product distribution of PBP with changing ˙OH concentrations
Our group has published the results on electrochemical degradation in undivided cells,26 and this study focuses on the effect of cathodic reaction. It was confirmed that the cation exchange membrane could prevent H2O2 or other ROS, LMCs and the degradation products from diffusing to anodic chamber, so the disturbance from anodic reaction could be avoided. In the following study, the effects of elevated temperatures and addition of different amount of radical quenchers on the degradation rate and product distribution of PBP were investigated.In previous studies, we monitored the effect of temperatures on the concentration of generated H2O2 in electrolytic cell under the same electrolytic conditions, and found that the concentration of H2O2 decreased at the elevated temperature (80 °C) and gave better depolymerization rate of lignin.28 It is explained that the decomposition of H2O2 to ˙OH radicals is accelerated by elevating temperatures. Moreover, the decomposition of H2O2 was similar to the first-order kinetic reaction, and the decomposition rate constants at 40 °C and 60 °C were 0.0396 min−1 and 0.0965 min−1, respectively.
As shown in Fig. 5a, the degradation rate of PBP in the cathodic chamber increased as the temperature raised. The degradation rate at 20 °C was 40.5%, while it reached 65.1% at 80 °C.
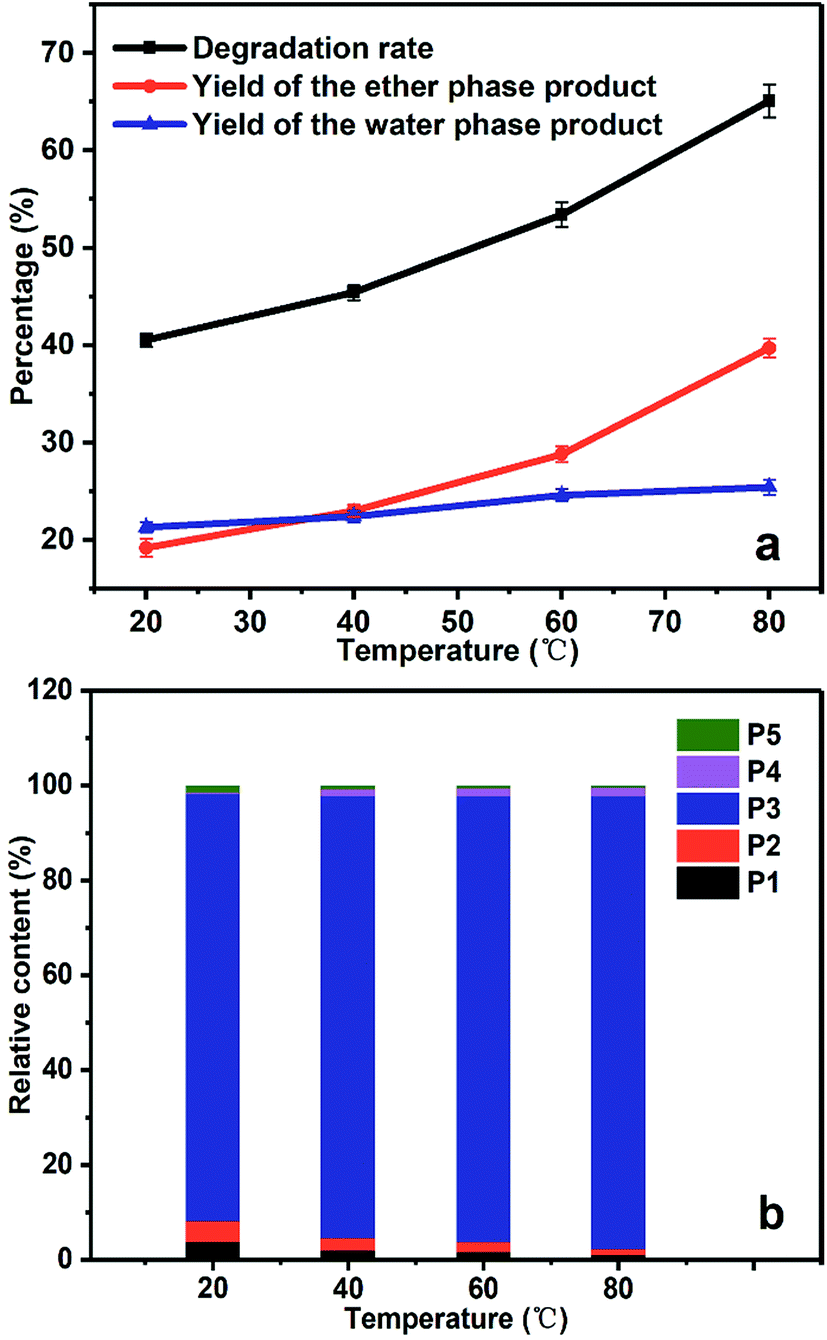 | ||
| Fig. 5 The degradation rate and product distribution of PBP at different temperatures. (a) The yield of the degradation products and the degradation rate, (b) the relative content of the ether phase products. | ||
The relative content of the ether phase products at different temperatures shows steady growth in the content of benzyl alcohol (P3), since P3 is the main product of PBP degradation (see Fig. 5b). It is noticeable that the relative content of hydroquinone (P5) was much lower than that of P3, which can be explained that P5 cannot be extracted to ether phase completely because of its good solubility in water. In addition, the relative content of benzoic acid (P4) increased at elevated temperatures (about 0.4% and 2% at 20 °C and 80 °C, respectively), which was caused by further oxidation of benzyl alcohol since too much amount of ˙OH radicals present at the elevated temperature.
Fig. 6a gives the degradation rate and product yields of PBP in the presence of different amount of IPA. When 0.01 g IPA was added, the degradation rate decreased by 38% because part of the generated ˙OH radicals was quenched by IPA. With the further addition of IPA, the degradation rate decreased continually, suggesting that the decrease of ˙OH concentration controlled by IPA was the reason for the decreased degradation rate and ˙OH was responsible for the ether bond cleavage in PBP molecules. The product distribution in Fig. 6b shows that the content of benzoic acid (P4) was 0.4% without the addition of IPA, but it was not found as the amount of IPA increased. This could be explained that the presence of IPA decreased the amount of ˙OH radicals and avoided the over-oxidation of the degradation products.
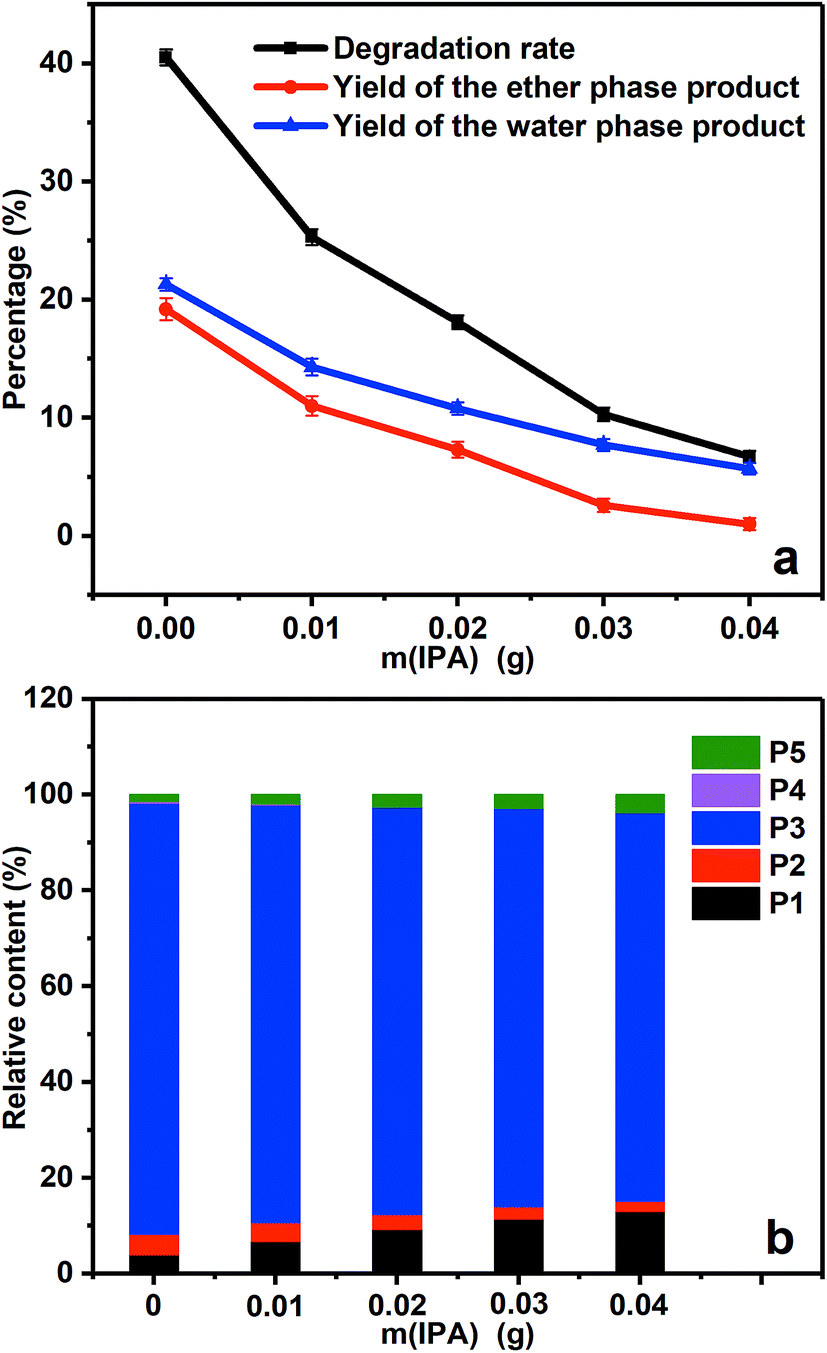 | ||
| Fig. 6 The degradation rate and product distribution of PBP in the presence of different amount of IPA. (a) The yield of the degradation products and the degradation rate, (b) the relative content of the ether phase products. | ||
Evaluation and prospect of electrochemical oxidative degradation
As shown in Fig. 7a, the yields of the ether phase products and the aqueous phase products gradually increased with the prolongation of electrolysis time, and the total degradation rate increased steadily as well. As the dynamic balance of ˙OH generation and consumption was reached under steady electrolysis, the electrolysis time determined the total amount of generated ˙OH, which in turn affected the final degradation yield. In the quantitative analysis of degradation products in Fig. 7b, the relative content of benzoic acid (P4) increased with prolonged electrolysis time, suggesting the over-oxidation of benzyl alcohol due to the accumulation of ˙OH in the system.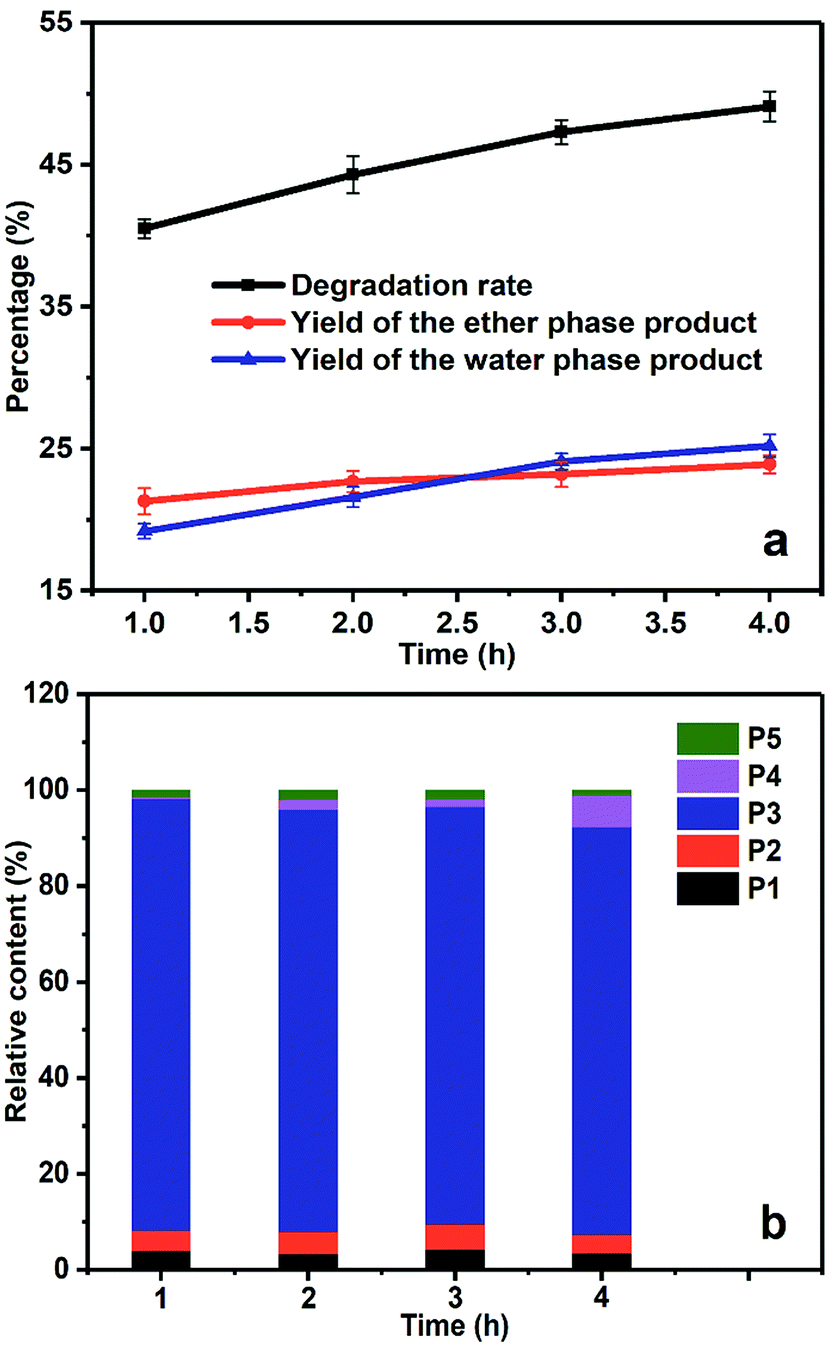 | ||
| Fig. 7 The degradation rate and product distribution of PBP with different electrolysis times. (a) The yield of the degradation products and the degradation rate, (b) the relative content of the ether phase products. | ||
The total degradation yield of PBP by electrochemical method was 40.5% at 1 h, and reached 49.1% at 4 h. The degradation yield was no longer effectively increased because some sort of repolymerization of the degradation products occurred. As the electrolysis time was prolonged, over-oxidation of the products was observed as well, suggesting that ˙OH could only conduct selective attack at relatively low concentration due to the cage effect of the solvents. When the concentration of ˙OH rised to a high level, the ˙OH radicals would rip extra electrons from the benzene ring without selectivity and lead to ring-open reaction, which was unexpected in our study.
More interestingly, in the above bond-cleavage mechanism, the phenolic hydroxyl group on the benzene ring plays a key role in the formation of quinone structures and the formation of active sites for electrophilic attack. This is very similar to the process of industrial production of phenol and acetone by cumene process, in which ROS was used for oxidizing cumene to form cumene radicals, and obtained a phenolic hydroxyl group on the benzene ring.35 In view of this, similar methods can be used in the depolymerization of lignin to introduce phenolic hydroxyl groups on the benzene ring and further utilize the introduced phenolic hydroxyl groups to form active sites, trigger the chain-break of the linkages among the structural units, and achieve the final depolymerization of lignin.
Conclusions
The ˙OH radical involved alkyl-O-aryl ether bond-cleavage mechanism was proposed by analyzing the degradation products of PBP. The comparative study of BPE degradation indicated that the presence of phenolic hydroxyl groups favored the formation of active sites for the selective attack of ˙OH and eventually triggered the cleavage of alkyl-O-aryl bonds. Besides, the degradation rate of PBP and the degradation products at different temperatures and in presence of radical quenchers were observed. It is found that the concentration of in situ generated ˙OH radicals was in positive correlation with the efficiency of bond cleavage. When the concentration of ˙OH maintained at relative low level, it exhibited selective attack of the active sites, whereas it led to over-oxidation of the products without selectivity at high concentrations. Finally, it is expected that the local hydroxylation of the benzene ring is beneficial for the formation of active sites in the electrochemical depolymerization of lignin, which further leads to the chain-break of lignin structural units and realizes the depolymerization of lignin. This is undoubtedly instructive for the depolymerization of lignin.Conflicts of interest
There are no conflicts of interest to declare.Acknowledgements
The authors greatly appreciate the support from the National Natural Science Foundation of China (No. 51374016, 21706004, 21506010) and the Fundamental Research Funds for the Central Universities of China (No. JD1701, JD1712).References
- S. Gillet, M. Aguedo, L. Petitjean, A. R. C. Morais, A. M. D. Lopes, R. M. Lukasik and P. T. Anastas, Green Chem., 2017, 19, 4200–4233 RSC.
- C. S. Lancefield, I. Panovic, P. J. Deuss, K. Barta and N. J. Westwood, Green Chem., 2017, 19, 202–214 RSC.
- L. H. Hu, H. Pan, Y. H. Zhou and M. Zhang, BioResources, 2011, 6, 3515–3525 CAS.
- C. Li, X. Zhao, A. Wang, G. W. Huber and T. Zhang, Chem. Rev., 2015, 115, 11559–11624 CrossRef CAS PubMed.
- R. Shu, Y. Xu, P. Chen, L. Ma, Q. Zhang, L. Zhou and C. Wang, Energy Fuels, 2017, 31, 7208–7213 CrossRef CAS.
- R. Y. Shu, Y. Xu, L. L. Ma, Q. Zhang, T. J. Wang, P. R. Chen and Q. Y. Wu, RSC Adv., 2016, 6, 88788–88796 RSC.
- H. Cheng, S. B. Wu and X. H. Li, RSC Adv., 2015, 5, 79532–79537 RSC.
- Y. Huang, Y. L. Hu, F. H. Ye and Y. M. Fang, Energy Fuels, 2017, 31, 8356–8362 CrossRef CAS.
- J. H. Dai, A. F. Patti, L. Longe, G. Garnier and K. Saito, ChemCatChem, 2017, 9, 2684–2690 CrossRef CAS.
- S. Dabral, J. G. Hernández, P. C. J. Kamer and C. Bolm, ChemSusChem, 2017, 10, 2707–2713 CrossRef CAS PubMed.
- V. O. Sippola and A. O. I. Krause, J. Mol. Catal. A: Chem., 2003, 194, 89–97 CrossRef CAS.
- C. Zhu, W. Ding, T. Shen, C. Tang, C. Sun, S. Xu, Y. Chen, J. Wu and H. Ying, ChemSusChem, 2015, 8, 1768–1778 CrossRef CAS PubMed.
- J. Piera and J. E. Backvall, Angew. Chem., Int. Ed., 2008, 47, 3506–3523 CrossRef CAS PubMed.
- S. Barroso, G. Blay, I. Fernández, J. R. Pedro, R. Ruiz-García, E. Pardo, F. Lloret and M. C. Muñoz, J. Mol. Catal. A: Chem., 2006, 243, 214–220 CrossRef CAS.
- S. Riano, D. Fernandez and L. Fadini, Catal. Commun., 2008, 9, 1282–1285 CrossRef CAS.
- B. Biannic, J. J. Bozell and T. Elder, Green Chem., 2014, 16, 3635–3642 RSC.
- C. S. Lancefield, O. S. Ojo, F. Tran and N. J. Westwood, Angew. Chem., Int. Ed., 2015, 54, 258–262 CrossRef CAS PubMed.
- F. Tran, C. S. Lancefield, P. C. J. Kamer, T. Lebl and N. J. Westwood, Green Chem., 2015, 17, 244–249 RSC.
- B. Sedai, C. Díaz-Urrutia, R. T. Baker, R. Wu, L. A. P. Silks and S. K. Hanson, ACS Catal., 2011, 1, 794–804 CrossRef CAS.
- M. Wang, J. Lu, X. Zhang, L. Li, H. Li, N. Luo and F. Wang, ACS Catal., 2016, 6, 6086–6090 CrossRef CAS.
- V. Brissos, D. Tavares, A. C. Sousa, M. P. Robalo and L. O. Martins, ACS Catal., 2017, 7, 3454–3465 CrossRef CAS.
- C. Diaz-Urrutia, B. Sedai, K. C. Leckett, R. T. Baker and S. K. Hanson, ACS Sustainable Chem. Eng., 2016, 4, 6244–6251 CrossRef CAS.
- C. Diaz-Urrutia, B. B. Hurisso, P. M. P. Gauthier, B. Sedai, R. D. Singer and R. T. Baker, J. Mol. Catal. A: Chem., 2016, 423, 414–422 CrossRef CAS.
- W. H. Gong, Z. Y. Xiang, F. Y. Ye and G. H. Zhao, Ind. Crops Prod., 2016, 91, 340–349 CrossRef CAS.
- Y. M. Zhang, Y. Peng, X. L. Yin, Z. H. Liu and G. Li, J. Chem. Technol. Biotechnol., 2014, 89, 1954–1960 CrossRef CAS.
- H. B. Zhu, Y. M. Chen, T. F. Qin, L. Wang, Y. Tang, Y. Z. Sun and P. Y. Wan, RSC Adv., 2014, 4, 6232–6238 RSC.
- X. C. Dong, H. Xu, X. W. Wang, Y. X. Huang, M. B. Chan-Park, H. Zhang, L. H. Wang, W. Huang and P. Chen, ACS Nano, 2012, 6, 3206–3213 CrossRef CAS PubMed.
- H. B. Zhu, L. Wang, Y. M. Chen, G. Y. Li, H. Li, Y. Tang and P. Y. Wan, RSC Adv., 2014, 4, 29917–29924 RSC.
- J. Y. Chen, N. Li and L. Zhao, J. Power Sources, 2014, 254, 316–322 CrossRef CAS.
- Z. Chen, H. Dong, H. B. Yu and H. Yu, Chem. Eng. J., 2017, 307, 553–561 CrossRef CAS.
- R. Agnemo, Acta Chem. Scand., 1979, 33, 337–342 CrossRef.
- A. W. Pelzer and L. J. Broadbelt, J. Phys. Chem. C, 2017, 121, 7603–7614 Search PubMed.
- L. Parimala and J. Santhanalakshmi, React. Kinet., Mech. Catal., 2013, 109, 393–403 CrossRef CAS.
- S. Fassi, K. Djebbar, I. Bousnoubra, H. Chenini and T. Sehili, Desalin. Water Treat., 2014, 52, 4982–4989 CrossRef CAS.
- A. Malekafzali, K. Malinovska and F. W. Patureau, New J. Chem., 2017, 41, 6981–6985 RSC.
| This journal is © The Royal Society of Chemistry 2017 |