 Open Access Article
Creative Commons Attribution 3.0 Unported Licence
Recycling and reuse of waste artificial turf via solid-state shear milling technology
Qing Liu a,
Pan He
 a,
Shuangqiao Yang
 a,
Shibing Bai
 *a and
Wenfeng Duan
 b
b
aState Key Laboratory of Polymer Materials Engineering, Polymer Research Institute of Sichuan University, Chengdu 610065, China. E-mail: baishibing@scu.edu.cn; Tel: +86-028-85463909
bState Key Laboratory of Special Functional Waterproof Materials, Beijing Oriental Yuhong Waterproof Technology Co., Ltd, Beijing 100000, China
First published on 24th November 2017
Abstract
Nowadays, the amount of the artificial turf waste is very huge, as it has been applied widely. However, it is a great challenge to recycle and reuse waste artificial turf (WAT) because its components are complex and hard to separate. In this study, solid-state shear milling (S3M) technology was introduced to recycle WAT into composite powder with valuable properties through ultrafine milling of WAT at room temperature. The results showed that the WAT included 46.7 wt% PE, 8.7 wt% PP, 2.4 wt% PET, 16.1 wt% polyacrylate and 26.1 wt% inorganic infill. The results of SEM and ultra-depth three-dimensional (3D) microscopy indicated that the domain size of the recycled material became smaller with the increase of milling cycles. The domain size and the performance of the recycled material could be controlled by the particle size and the size distribution of the composite powder in the solid state. The dynamic mechanical analysis (DMA) and X-ray diffraction (XRD) patterns demonstrated that the S3M technology improved the compatibility between the components and effectively decreased the crystallite size of PE in WAT. The melt flow index and the high capillary rheology test indicated that the thermal processability of the recycling material became better through S3M milling. The tensile strength and the elongation at break of the recycling material reached 12.6 MPa and 96.3%, respectively. What's more, low-price wood–plastic products with good performance and appearance could be manufactured using the recycled materials.
1. Introduction
Recently, artificial turf (AT) has been successfully used as a replacement for natural grass and is increasingly applied on athletics fields,1 residential turfs and landscaping2 (Fordyce, 2011). Up to now, the global usage of AT has reached 200 million square meters, with an increase by 20–25% per year. However, the life time of artificial turf is only 5–10 years,3 and thus a large amount of waste artificial turf (WAT) are produced.The artificial turf mainly consists of three parts:3 artificial grass fibers (polyethylene, PE), carpet backing (polypropylene and poly(ethylene terephthalate), PP and PET) and adhesive (crosslinking polyacrylate and inorganic filler). Although the components of the artificial grass fibers and carpet backing are all thermal plastics, they are incompatible due to the big difference in their melt points (PE, ∼126 °C; PP, ∼165 °C; PET, ∼240 °C) and their viscosities don't match each other. On the other hand, the adhesive is the infusible and insoluble crosslinking polyacrylate, which cannot be thermally processed. In addition, WAT also includes some infills, a mixture of sand and crumb rubber to support the fiber blades and provide cushion.
Currently, the main disposal ways1,3 for WAT include landfill, incineration and respectively recycling after complete separating the ingredients. Both landfilling and incineration are the most unwelcome method, because landfilling occupies a large land space and contaminates groundwater3–7 and incinerating WAT releases a substantial number of poisonous gases. Separating the WATs' ingredients and recycling the parts is a common method,3 but this disposal way presented ultra-low recycling efficiency owing to WATs' complex and difficult-to-separate constituents. Cheng3 suggested that the WAT could be shredded, repalletized and converted into usable materials for new artificial turf or other extruded plastic products. However, the products have poor mechanical properties and only use for lower grade applications,1 limiting its wide application. Thus, it is vital to develop new methods for recycling WAT and turning the wasters into usable products.
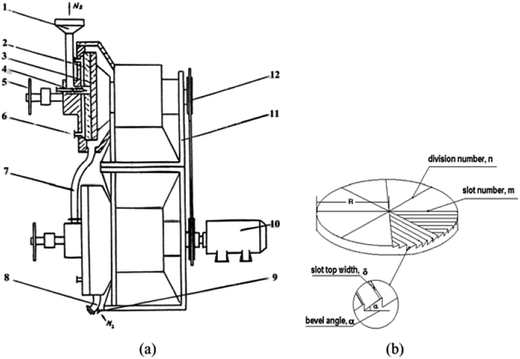
The solid-state shear milling equipment was invented in our laboratory,8–12 whose schematic diagrams of the solid state shear milling reactor and the inlaid pan-milling are shown in Fig. 1 as following. The main structural parameters of the pan-mill are: radius R, division number n, slot number in each m, bevel angle α and slot top with δ. Theoretical analysis demonstrates that this equipment has excellent pulverizing and dispersing effects on polymeric materials owing to the ingenious design derived from the traditional Chinese stone-mill. The key part of this innovation equipment is the inlaid pan, whose surface is divided into equal sectors by several bevels; the ridges of the bevels were parallel with the dividing lines, as shown in Fig. 1b. Functioning like a pair of three-dimensional scissors provides very strong shear forces for pulverization, dispersion, mixing and activation. Previous studies showed that state shear milling (S3M) technology can be used in producing ultrafine polymer powders,8,10,11 tire rubbers decrosslinking,13 carbon nano-tube nanoscale cutting,14 montmorillonite nano-scale exfoliation15 and graphene nanoscale dispersion.9 Recently, it was found that S3M technology may show a potential application for recycling waste polymers with immiscible and complex components into value-added products without sorting by types or color.10,11 As compared with other technologies, etc., landfill, incineration and other recycling methods, the new recycling method doesn't need not to require efforts to handle and separate WATs' ingredients. The solid state shear milling reactor adopted its three-dimensional shear to ultrafine mill WAT at room temperature, only by ultrafine milling WAT at room temperature, the domain size and the performance of the material were controlled by the particle sizes and its distribution of the composite powder at the solid state.
In this study, the S3M technology was used to recycle WAT to develop a new recycling method for WAT. The morphology, compatibility, crystalline structure, processabilities and mechanical properties of the recycled WAT were investigated. What's more, the WAT fine powder was used to replace polyethylene materials to prepare wood–plastics products.
2. Experimental
2.1 Materials
The WAT, which were used, were provided by Nanjing Jufeng Advanced Materials Co., Ltd. The high-density polyethylene (HDPE) is a commercially available material from SINOPEC Maoming Company, Guangdong, China (production code 1410190642 2C TR480M), MI = 0.5 g/10 min (210 °C, 2.16 kg), density = 0.944 g cm−3 (23 °C). The wood powders (WPs) (average size 47 mm) used in this study were purchased from Jiangsu biomass material Co., Ltd. China.2.2 Preparation of WAT recycling material and wood–plastics composites
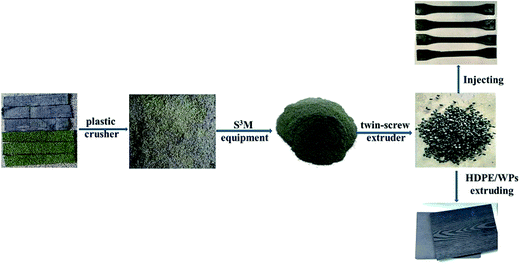
WAT was disposed directly (without cleaning) and integrally in accordance with the following process. The WAT fragments were firstly smashed by plastic crusher (PC400, Jinshi Plastic Machinery of Chao'an, China) and then fed into the pan-mill through the hopper in the center of the milling pan at a rotation speed of 20 rpm. The milled materials were discharged from the brim of the pan, and the discharged powder was collected for the next milling cycle. The heat was removed by the circulating water. Sampling 500 g powder milled 5 cycles, 10 cycles, 15 cycles, 20 cycles, successively and respectively. And contrastively, 500 g unmilled WAT fragment were sampled.The prepared powders (and fragments) were extruded into threads with a twin-screw extruder (SHJ-20, Φ = 25 mm, L/D = 33, Nanjing Giant Machinery Co. Ltd., China), the temperatures of barrels were 170 °C, 190 °C, 190 °C, 190 °C, and 185 °C and the screw was maintained at a speed of 120 rpm. Eventually the standard test specimens were obtained by means of the injection-molding machine (MA1200/370, Haitian Plastic Machinery Co. Ltd., China) under the conditions of 190 °C. Signing the products prepared by WAT fine powders as r-WAT.
The samples which were used for WAT components analysis were cut into bulk sample with the shape of 45 mm × 55 mm, then separating the sample to get the components: the artificial grass fibers, the carpet backing and the adhesive, weighing 1.99 g, 1.80 g, 0.47 g, respectively.
The HDPE/WAT/WPs (20/20/60) composites and HDPE/WPs (40/60) composites were prepared by extrusion molding, and then cut into test specimens with the dimensions of 80 mm × 10 mm × 4 mm (L × W × T) for testing.
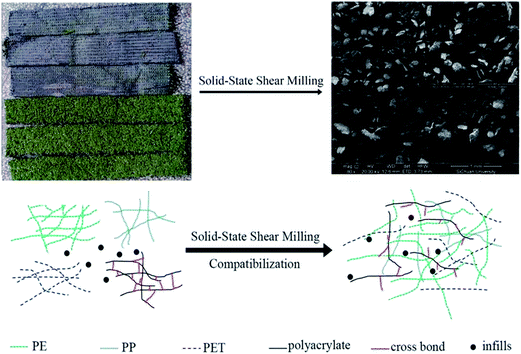
The scheme describing the full procedure was showed in Fig. 2.
2.3 Analytical methods
![[thin space (1/6-em)]](https://www.rsc.org/images/entities/char_2009.gif) δ) was determined at a frequency of 1 Hz and a heating rate of 3 °C min−1 as a function of temperature in the range of −100 °C to 170 °C.
δ) was determined at a frequency of 1 Hz and a heating rate of 3 °C min−1 as a function of temperature in the range of −100 °C to 170 °C.3. Results and discussion
3.1 Analysis of WAT components
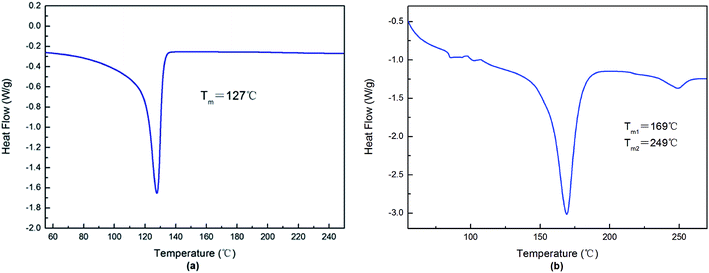
Fig. 3a showed the infrared absorption peak of the artificial grass fibers of WAT. The peaks at 2917 cm−1 and 2850 cm−1 are corresponded to the stretch vibration of methylene, the peak at 1467 cm−1 was assigned to the bending vibration of methylene and the bands at 719 cm−1 was due to the bending vibration of –(CH2)n–, totally matching with spectrogram of polyethylene (PE).16 Fig. 4a depicted the DSC melting curve of the artificial grass fibers, which shows Tm of artificial grass fibers is 127 °C, and for neat HDPE, the typical Tm value is 130 °C.17 Thereby, the characterization indicated that the element of the artificial grass fibers was polyethylene.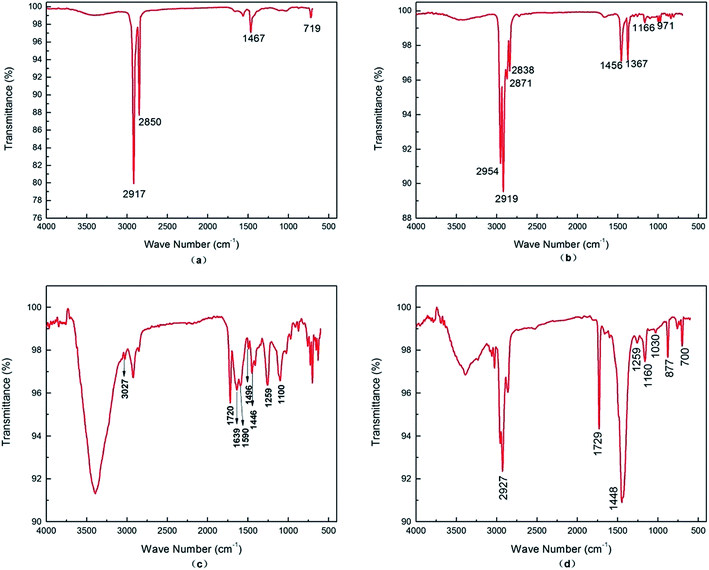 | ||
| Fig. 3 FT-IR absorption spectrograms of WATC: (a) the artificial grass fibers; (b) the backing non-woven fabrics; (c) the backing felt; (d) the artificial grass adhesive. | ||
The carpet backing consists of the backing non-woven fabrics, adhering to the artificial grass fibers, and the backing felt which adhered to the adhesive. Fig. 3b showed the infrared absorption peak of the backing non-woven fabrics. The peaks at 2954 cm−1 and 2871 cm−1 are stretching vibration of methyl, the peaks at 1367 cm−1, 1166 cm−1 and 971 cm−1 are bending vibration of methyl and the peaks at 2919 cm−1 and 2838 cm−1 is stretching vibration of methylene, the peaks at 1456 cm−1 is bending vibration of methylene matched with spectrogram of polypropylene (PP).18 Fig. 3c showed the infrared absorption peak of the backing felt. The absorption peaks at 1639 cm−1, 1590 cm−1, 1496 cm−1 and 1446 cm−1 are corresponding to the stretching vibration of C![[double bond, length as m-dash]](https://www.rsc.org/images/entities/char_e001.gif) C in the benzene rings and the stretching vibration of C–H in the benzene rings confirmed the existence of benzene which was show at 3027 cm−1. And the band at 1720 cm−1, 1259 cm−1 and 1100 cm−1 were assigned to the stretch vibration of C
C in the benzene rings and the stretching vibration of C–H in the benzene rings confirmed the existence of benzene which was show at 3027 cm−1. And the band at 1720 cm−1, 1259 cm−1 and 1100 cm−1 were assigned to the stretch vibration of C![[double bond, length as m-dash]](https://www.rsc.org/images/entities/char_e001.gif) O and the stretch vibration of C–O–C, respectively, confirming that this component is a kind of polyester. Moreover, the absorption peak fitly matching with spectrogram of polyethylene terephthalate (PET).19
O and the stretch vibration of C–O–C, respectively, confirming that this component is a kind of polyester. Moreover, the absorption peak fitly matching with spectrogram of polyethylene terephthalate (PET).19
Fig. 4b depicted the DSC melting curve of the carpet backing, from this plot, double melting peaks were detected. The lower Tm is 169 °C, which is melting temperature of PP20 and the higher Tm is 249 °C, which is melting temperature of PET.19 Thereby, it is indicated that the artificial grass fibers includes polypropylene and poly(ethylene terephthalate). Besides, we weighed the backing non-woven fabrics and the backing felt respectively, noting the value 0.37 g and 0.10 g. Thus, the proportion of the backing non-woven fabrics is 94.44% and the backing felt is 5.56% in the carpet backing.
Fig. 3d showed the infrared absorption peak of the artificial grass adhesive. The absorption peak at 1729 cm−1 belonged to the stretch vibration of C![[double bond, length as m-dash]](https://www.rsc.org/images/entities/char_e001.gif) O, the peaks at 1259 cm−1, 1160 cm−1 and 1030 cm−1 belonged to the stretch vibration of C–O–C, and the peak at 1448 cm−1 belonged to the bending vibration of methylene, which were characteristic absorption of polyacrylate. Besides, the absorption peak curve fitly matching with spectrogram of polyacrylate.21
O, the peaks at 1259 cm−1, 1160 cm−1 and 1030 cm−1 belonged to the stretch vibration of C–O–C, and the peak at 1448 cm−1 belonged to the bending vibration of methylene, which were characteristic absorption of polyacrylate. Besides, the absorption peak curve fitly matching with spectrogram of polyacrylate.21
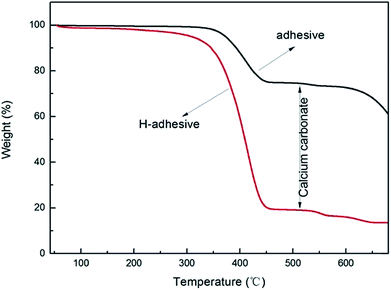
Thermal gravimetric analysis curves of the artificial grass adhesive were depicted in Fig. 5, which showed a big falling platform proved to be the disappearance of calcium carbonate. In this work, for preparation of test samples, the adhesive was immersed and disposed using hydrochloric acid, then washed and dried sample, noting as H-adhesive.
The weight of the sample before and after treating were 0.1225 g and 0.0467 g, respectively. Thereby, it is indicated that the major components of the artificial grass adhesive are thermoset material polyacrylate and calcium carbonate inorganic infills.
To sum up, the components of WAT is 46.7% PE, 8.7% PP, 2.4% PET, 16.1% polyacrylate and 26.1% inorganic infills.
3.2 Morphology and compatibility
According to the above analysis, the main ingredient of r-WAT materials prepared by indiscriminate fine WAT powders was PE and other components phases dispersed in PE phases. Morphology control of the dispersed phase is extremely important to achieve good properties for the multicomponent.Fig. 6 clearly showed that the size of cavities existing in continuous phase gets smaller and the distribution are better-proportioned with the increasing milling cycles. The component analysis, mentioned above, told us that there are 26.1% calcium carbonate infills in WAT. In this section, the liquid-nitrogen-cryofractured surface of r-WAT specimens have been etched by hydrochloric acid before being sputter-coated with gold. The r-WAT specimens firstly fractured in the condition of liquid nitrogen, and then etched away calcium carbonate from the fracture surface using hydrochloric acid. Therefore, the cavities shown in Fig. 6 represented calcium carbonate infills, in other words, Fig. 6 clearly depicted the dispersion of calcium carbonate infills in matrix, which indicated that the infill phase uniformly disperse in PE matrix processed by S3M pan-milling equipment.
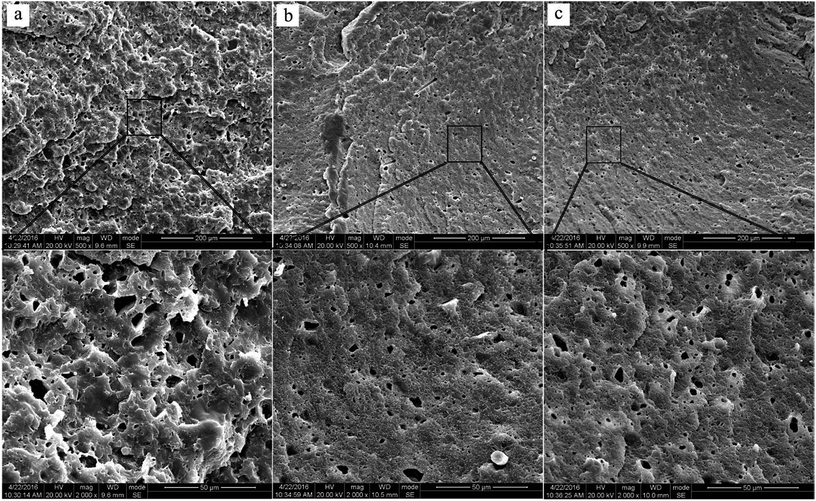 | ||
| Fig. 6 SEM of the liquid-nitrogen-cryofractured surface of r-WATC via different cycles of S3M: (a) 0 cycle; (b) 10 cycles; (c) 20 cycles. | ||
Fig. 7 showed three optical images taken by ultra-depth three-dimensional microscope. Looked the samples in high magnification under the glare, the components morphology could be clearly observed on account of different components have different reflectivity. The images indicated that the size of dispersed phases turned smaller and the dispersibilities of dispersed phases turned better with the increasing of S3M cycles. The reasons was attributed to pan-milling mechanochemistry equipment providing very strong 3-dimentional shear forces for pulverizing and milling thermoplastic artificial grass fibers and carpet backing, thermoset adhesive and inorganic infills integrally into fine powders, in the period of milling, the size of components turned smaller and various kinds of powders mixed together.
 | ||
| Fig. 7 Optical images of r-WATC via different cycles of S3M by ultra-depth three-dimensional microscope: (a) 0 cycle; (b) 10 cycles; (c) 20 cycles. | ||
Noticeably, phase morphology, as a determining factor for properties of multicomponent polymer systems, is controlled by the interfacial interactions and compatibility of the blends' components. Dynamic mechanical analysis (DMA) is widely and generally used to characterize compatibility of multicomponent polymer, and the value of tan![[thin space (1/6-em)]](https://www.rsc.org/images/entities/char_2009.gif) δ is closely related to the motion segment which is the most appropriate verdict on the compatibility. It should be underlined that tan
δ is closely related to the motion segment which is the most appropriate verdict on the compatibility. It should be underlined that tan![[thin space (1/6-em)]](https://www.rsc.org/images/entities/char_2009.gif) δ could characterize the compatibility though the following two methods: judging from the relations between α relaxation peaks of constituents which are corresponded with their own glass transition temperature (Tg) and the changes of peak values, peak intensity and peak width of tan
δ could characterize the compatibility though the following two methods: judging from the relations between α relaxation peaks of constituents which are corresponded with their own glass transition temperature (Tg) and the changes of peak values, peak intensity and peak width of tan![[thin space (1/6-em)]](https://www.rsc.org/images/entities/char_2009.gif) δ.22
δ.22
Fig. 8 showed the tan![[thin space (1/6-em)]](https://www.rsc.org/images/entities/char_2009.gif) δ versus temperature curves of r-WAT via different milling cycles, all five curves have similar profiles, two visible relaxation peaks can be seen at around T = 25 °C and T = 90 °C through the temperature monitored. As mentioned above, the main components of WAT are PE and PP. PET is rarely exist in the WAT. Although the Tg of PP and PET are 25 °C (ref. 23) and 85 °C,24 respectively, the two visible relaxation peaks in Fig. 8 were mainly contributed to the motion segment of PE crystalline region, and the relaxation peak at lower temperature is β-relaxation which has been concluded that this transition results from the relaxation of chain units which are located in the interfacial region, and that at higher temperature is α-relaxation which have clearly been verified25,26 that it is due to motions of chain units which lie within the crystalline portion of the polymer.
δ versus temperature curves of r-WAT via different milling cycles, all five curves have similar profiles, two visible relaxation peaks can be seen at around T = 25 °C and T = 90 °C through the temperature monitored. As mentioned above, the main components of WAT are PE and PP. PET is rarely exist in the WAT. Although the Tg of PP and PET are 25 °C (ref. 23) and 85 °C,24 respectively, the two visible relaxation peaks in Fig. 8 were mainly contributed to the motion segment of PE crystalline region, and the relaxation peak at lower temperature is β-relaxation which has been concluded that this transition results from the relaxation of chain units which are located in the interfacial region, and that at higher temperature is α-relaxation which have clearly been verified25,26 that it is due to motions of chain units which lie within the crystalline portion of the polymer.
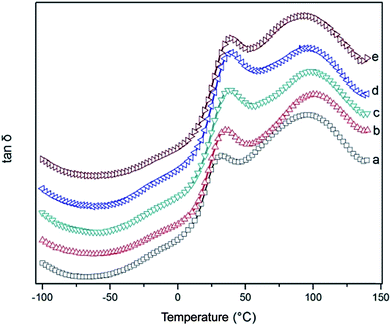 | ||
| Fig. 8 Loss tangent versus temperature of r-WATC via different S3M cycles: (a) 0 cycle; (b) 5 cycles; (c) 10 cycles; (d) 15 cycles; (e) 20 cycles. | ||
It can be observed from Fig. 8, peak values increased substantially with increasing milling cycles, raising from 32 °C to 40 °C, and additionally half peak width widened apparently which showed that the motion of molecular lying in crystalline portion of PE motion is blocked, the reason of this result may be attributed to the molecular migration of other phases into interfacial region of PE crystalline portion, astricting molecular motion. Moreover, the peak intensity was increased with the milling cycles increased, indicating that the amount of migratory molecular grows in number, which can be explained that the more intensive of the peak intensity, the higher internal friction of polymer segment motion will be.
For those results, it was concluded that the S3M technology could improve the compatibility of this multicomponent blends, WAT.
3.3 X-ray diffraction analysis
X-ray diffraction is widely used to study the structure, orientation, and size of the crystallite and crystallinity.Fig. 9 showed the X-ray diffraction curves of r-WAT milled 0 cycle, 5 cycles, 10 cycles, 15 cycles, 20 cycles, respectively. All five curves have similar profiles, a visible crystal diffraction peak can be seen at around 2θ = 21.5°, and a broad crystal diffraction peak can be seen at around 2θ = 23.5°. Besides, as it shown in Fig. 9, the diffraction peaks of pure PE were observed at 2θ Bragg's angles of 21.6° and 24.0° which correspond to diffraction planes of 110 and 200, generally in accordance with the curves of r-WAT. While the diffraction peaks of pure PP appeared at 2θ of 14.0°, 16.8°, 18.4°, 21.0°, and 21.7° which correspond to diffraction planes of the 110, 044, 130, 131, and 111, respectively, in marked contrast to the curves of r-WAT. So the two crystal diffraction peaks of r-WAT were contributed to the PE crystalline phase. Also, a scattering peak appearing at around 2θ = 19.5° stands for the amorphous portion.
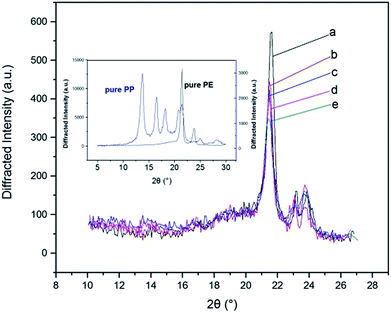 | ||
| Fig. 9 X-ray diffraction patterns of pure PP, pure PE and r-WATC via different S3M cycles: (a) 0 cycle; (b) 5 cycles; (c) 10 cycles; (d) 15 cycles; (e) 20 cycles. | ||
It was clearly noted from the Fig. 9 that the peak intensity of diffraction curves of r-WAT turned weak with the increase of milling cycles, indicating that milling and grinding hugely affect the crystalline ability of PE. And quantificationally, the values of the crystallite size27 and the crystallinity could be calculated by the following eqn (1) and (2), respectively.
 | (1) |
 | (2) |
The crystallite parameters were list in Table 1, in which it was clearly observed that by increasing milling cycles, the crystallite size decreased, more specifically, the crystallite size of 110 crystal plane dropping from 25.65 nm to 23.30 nm and 200 crystal plane dropping from 26.08 nm to 14.74 nm. Also, it was noted that the crystallite size increased slightly after milling 10 cycles and 15 cycles. The reasons of this behavior may be attributed to agglomeration of powders in the period of milling. Generally, the S3M could minished the crystallite size. The pan-milling equipment can act as 3-dimentional scissors, providing very strong shear forces for pulverizing, dispersing and mixing WAL blends, making other polymer segmers migrate into PE phase, which broke the regularity of PE segmers. The destruction of segmers regularity made the crystallite size of sphaero crystal decrease. Besides, the S3M decreased the size of calcium carbonate inorganic infills, the fine calcium carbonate powders played as a role of nucleating agent, promoting the segmers forming microcrystal.
| S3M cycles | 2θ/° | β/° | Lhkl/nm | Area | Wc,x/% |
|---|---|---|---|---|---|
| 0 cycle | 21.610 | 0.613 | 25.65 | 2419 | 57.11 |
| 23.92 | 0.603 | 26.08 | 360 | ||
| 19.53 | — | — | 2087 | ||
| 5 cycles | 21.59 | 0.621 | 25.32 | 2306 | 64.92 |
| 23.92 | 0.648 | 24.27 | 363 | ||
| 19.71 | — | — | 2283 | ||
| 10 cycles | 21.50 | 0.677 | 23.23 | 1644 | 58.37 |
| 23.84 | 1.087 | 14.47 | 710 | ||
| 19.25 | — | — | 1722 | ||
| 15 cycles | 21.47 | 0.627 | 25.08 | 1510 | |
| 23.83 | 1.190 | 13.22 | 991 | 59.77 | |
| 19.12 | — | — | 1683 | ||
| 20 cycles | 21.34 | 0.675 | 23.30 | 2500 | |
| 23.70 | 1.067 | 1405 | 1405 | 51.35 | |
| 19.28 | — | — | 3699 |
The behavior of other polymer segmers migrated into PE phase hindered segmers motion in different extent, affecting the rate of segments regularly diffused, migrated and arranged during crystallization. That accounted for the reducing of degree of crystallinity, shown in Table 1.
In general, the S3M technology made the crystallite size decrease, and the smaller crystallite size could effectively improve the mechanical properties. Besides, the reducing of crystallinity supported the DMA conclusion that the molecular migration of other phases into PE crystalline portion after milling, and the compatibilities were improved.
Fig. 10 described the schematic illustration of S3M technology milling WAT, the strong 3-dimensional shear forces of S3M technology ultrafine milled WAT at the room temperature, making its structure be totally destroyed and all ingredients turn into indiscriminate ultrafine powder and randomly disperse, in which the domain size and the compatibility of the material were controlled by the particle size and its distribution of the composite powder at the solid state.
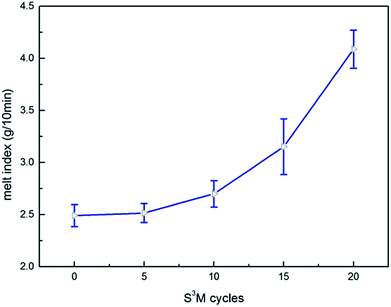
Fig. 11 showed the effect of milling cycles on the MFI. From this figure it was distinctly noticed that when beginning milling, the MFI was slightly higher than that of without milling, besides as the milling cycles continued to increase, the MFI increased substantially, jumping from 2.491 g/10 min to 4.0875 g/10 min, which illustrated that S3M technology could effectively improve flowability.
Fig. 12 depicted that the curves of shear viscosity of r-WAT milled 0 cycle, 10 cycles, 20 cycles, respectively, versus shear rate. Obviously, the WAT melts behaved as pseudoplastic, which was typical non-Newtonian fluids, in other words, the apparent viscosity of r-WAT reduced with the sequentially increase of shear rate. From the Fig. 12, it was also noticed that the apparent viscosity of r-WAT disposed by S3M was lower than that of without milling in the same shear rate. It is indicated that the S3M could reduce the apparent viscosity of this multicomponent blends to a certain extent.
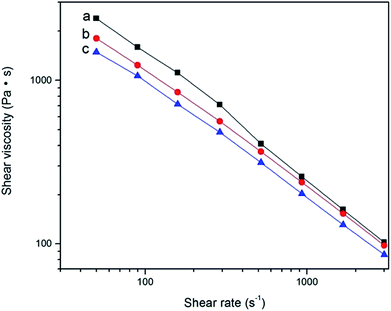 | ||
| Fig. 12 The curves of apparent viscosity of r-WATC via S3M versus shear rate: (a) 0 cycle; (b) 10 cycles; (c) 20 cycles. | ||
So it is concluded from rheological analysis that the S3M technology could effectively improve the flowability and reduced the apparent viscosity of WAT melts.
It should be noticed that the apparent viscosity of WAT without milling reduced faster than that disposed by S3M with the shear rate sequentially increased from Fig. 12, it could be reasonably infer from this tendency that the apparent viscosity of WAT without milling would be lower than that disposed by S3M in higher shear rate which would lead to unsteady-state flow of WAT melts, arising the phenomena of melt fracture.
Fig. 13 depicted the surface appearance of the extrudater without milling which looked rough and uneven, displaying the phenomena of melt fracture, on the contrary, extrudate with 10 cycles milling looked smooth and glossy, and the surface appearance of extrudater milled 20 cycles got more smooth and glossier.
 | ||
| Fig. 13 SEM of r-WATC extrudate via different cycles of S3M: (a) 0 cycle; (b) 10 cycles; (c) 20 cycles. | ||
The reason for displaying the phenomena of melt fracture is that the melts flowing in the tube slipped and the spring back in melts. In the period of the melts flowed in the tube, the shear rate near tube was fastest and the distribution was uneven, making the distribution of elastic energy in the melts along the radial direction existed differences, this uneven distribution of elastic energy would generate elastic stress in the directions roughly paralleling to the velocity gradient. Once the elastic stress rose to the value of viscous flow resistance, the balance of the elastic stress in the melts would be broke, consequently the spring back happened. The uneven distribution of the complex components in PE matrix would undoubtedly result in uneven distribution of elastic energy. S3M could efficaciously improve the distribution, consequently the surface appearance of extrudater disposed by S3M looked smooth, and yet the surface appearance of extrudater without milling looked rough.
From those above results, it was concluded that S3M technology could efficaciously recycle waste artificial turf and improve and ameliorate processability. The reason of this behavior was attributed to that S3M technology could control the composite powder particle size and particle size distribution, and make the incompatible and complex components blend even and interpenetrating.
3.4 Application and economic evaluation
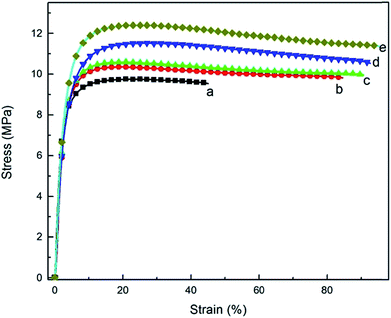
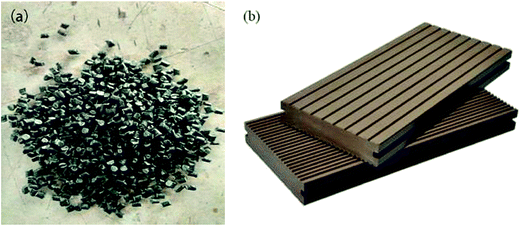
The WAT fine powders have been successfully obtained from WAT fragments by S3M technology, and it has been used to prepare WAT pellets, shown in Fig. 15a, with 12.64 MPa in tensile strength and 96.29% in elongation at break. These WAT pellets can be used to produce value-added products such as wood/plastics products, geomembranes, bellows and geogrids, showed in Fig. 15b.In this work, WAT pellets have been successfully used to replace part of polyethylene materials to prepare wood/plastics products. HDPE blended with WAT pellets and WPs to prepare wood/plastics composites whose properties were recorded in table. From Table 2, it can be found that the properties of these products mingling with WAT pellets were basically equivalent to those of the pure material and generally meet the national standard, GB/T 24137-2009.
| HDPE/WAT/WPs | HDPE/WPs | National standard | |
|---|---|---|---|
| Flexural strength (MPa) | 18.8 | 20.38 | ≥16.0 |
| Flexural modulus (MPa) | 2040 | 1496 | ≥1800 |
| Shore hardness (HD) | 69 | 66 | ≥55 |
| Cost (¥ per t) | 2900 | 4600 | — |
4. Conclusions
The S3M technique milled WAT into indiscriminate ultrafine powder at room temperature successfully and effectively, and the domain size and the performance of the material were controlled by the particle size and its distribution of the composite powder at the solid state. The domain size of the material became smaller with the increase of milling circle. The S3M technology improved the compatibility between the components and effectively decreased crystallite size of PE in WAT, and thermal processability of the recycling material turned better after S3M milling. The tensile strength and the elongation at break of the recycling material can reach 12.6 MPa and 96.3%, respectively. Moreover, the wood–plastics products made from WAT fine powders can be produced with considerable economic benefits and social effects. Thus, solid-state shear milling can act as a new method for the high-value recycling of WAT.Conflicts of interest
There are no conflicts to declare.Acknowledgements
This project was supported by the National Natural Science Foundation of China (51421061) and the Program of Innovative Research Team for Young Scientists of Sichuan Province (2016TD0010).References
- Eunomia Research & Consulting Ltd, https://football-technology.fifa.com/media/1230/artificial_turf_recycling.pdf, 2007.
- B. Fordyce, http://www.landscapeonline.com/research/article.php/14635, 2011.
- H. Cheng, Y. Hu and M. Reinhard, Environ. Sci. Technol., 2014, 48, 2114–2129 CrossRef CAS PubMed.
- O. Eriksson, M. Carlsson Reich, B. Frostell, A. Björklund, G. Assefa, J. O. Sundqvist, J. Granath, A. Baky and L. Thyselius, J. Cleaner Prod., 2005, 13, 241–252 CrossRef.
- B. Gworek, W. Dmuchowski, E. Koda, M. Marecka, A. Baczewska, P. Brągoszewska, A. Sieczka and P. Osiński, Water, 2016, 8, 470 CrossRef.
- S. Kaoser, S. Barrington and M. Elektorowicz, J. Soil Contam., 2010, 9, 503–522 CrossRef.
- P. Usapein and O. Chavalparit, J. Mater. Cycles Waste Manage., 2013, 16, 373–383 CrossRef.
- P. He, S. Bai and Q. Wang, Composites, Part B, 2016, 99, 373–380 CrossRef CAS.
- P. Wei and S. Bai, RSC Adv., 2015, 5, 93697–93705 RSC.
- S. Yang, S. Bai and Q. Wang, Waste Manage., 2016, 57, 168 CrossRef CAS PubMed.
- S. Yang, S. Bai and Q. Wang, J. Appl. Polym. Sci., 2015, 132, 3225–3232 Search PubMed.
- Q. Wang, J. Cao, J. Huang and X. Xu, Polym. Eng. Sci., 1997, 37, 1091–1101 CAS.
- J. Zhu, X. Zhang, M. Liang and C. Lu, J. Polym. Res., 2010, 18, 533–539 CrossRef.
- W. Shao, Q. Wang, F. Wang and Y. Chen, Carbon, 2006, 44, 2708–2714 CrossRef CAS.
- G. Wang, Y. Chen and Q. Wang, J. Polym. Sci., Part B: Polym. Phys., 2008, 46, 807–817 CrossRef CAS.
- B. Zhu, D. Ma, H. Li, Z. Sun and J. Wang, J. Macromol. Sci., Part B: Phys., 2016, 55, 188–200 CrossRef CAS.
- M. Poletto, M. Zeni and A. J. Zattera, J. Thermoplast. Compos. Mater., 2011, 25, 821–833 CrossRef.
- J. Tian, W. Yu and C. Zhou, Polymer, 2006, 47, 7962–7969 CrossRef CAS.
- M. Parvinzadeh, S. Moradian, A. Rashidi and M.-E. Yazdanshenas, Appl. Surf. Sci., 2010, 256, 2792–2802 CrossRef CAS.
- Y. Zhu, C. Liang, Y. Bo and S. Xu, J. Polym. Res., 2015, 22, 35 CrossRef.
- S. L. Chai, M. M. Jin and H. M. Tan, Eur. Polym. J., 2008, 44, 3306–3313 CrossRef CAS.
- Q. Wu, N. Chen and Q. Wang, J. Polym. Res., 2010, 17, 903–909 CrossRef CAS.
- P. K. Mandal and D. Chakraborty, J. Appl. Polym. Sci., 2009, 111, 2345–2352 CrossRef CAS.
- Y. Zhang, H. Zhang, Y. Yu, W. Guo and C. Wu, J. Appl. Polym. Sci., 2009, 114, 1187–1194 CrossRef CAS.
- G. Karine, P. Vinicius and S. L. Cristine, J. Appl. Polym. Sci., 2016, 133, 42887–42892 Search PubMed.
- R. Popli, M. Glotin and L. Mandelkern, J. Polym. Sci., Polym. Phys. Ed., 1984, 22, 407–449 CrossRef CAS.
- A. L. Patterson, Phys. Rev., 1939, 56, 978–982 CrossRef CAS.
| This journal is © The Royal Society of Chemistry 2017 |

