 Open Access Article
H2O2-microwave treated graphite stabilized stearic acid as a composite phase change material for thermal energy storage†
Chuanchang Li *ab,
Baoshan Xiea,
Jian Chena,
Zhongsheng Chenb,
Xiaoqin Suna and
Stuart W. Gibbac
aSchool of Energy and Power Engineering, Changsha University of Science and Technology, Changsha 410114, China. E-mail: chuanchangli@csust.edu.cn; Fax: +86-0731-85258409; Tel: +86-0731-85258409
bState Key Laboratory Breeding Base of Nuclear Resources and Environment, East China Institute of Technology, Nanchang 330013, Jiangxi, China
cCentre for Energy and Environment, Environmental Research Institute, North Highland College, University of the Highlands and Islands, Thurso, Caithness, KW14 7JD, Scotland, UK
First published on 13th November 2017
Abstract
Flake graphite (FG) was treated by microwave radiation in hydrogen peroxide solution and used to support stearic acid (SA) to synthesize SA/FG composites for thermal energy storage. The thermostability of the SA/FG was measured via TG-DSC, revealing they have good thermal stability up to 230 °C. The thermal properties of the composites were changed by varying the radiation time, and the SA/FG3 composite with the longest FG treatment time showed a higher latent heat value (61.05 J g−1 for melting and 61.00 J g−1 for freezing), and greater crystallinity (Fc, 98.34%) than other samples according to the analysis of DSC. The SA/FG3 composite had a good thermal reliability after thermal cycling tests. The thermal conductivity of SA/FG3 (3.18 W m−1 k−1) was 12.2 times higher than that of pure SA. Furthermore, the mechanism of the enhanced performance of SA/FG3 was further revealed by monitoring functional groups of the surface of FG and demonstrated on the atomic-scale. Infrared imaging showed SA/FG3 possessed superior thermal-regulated properties. Therefore, all these thermal properties indicate SA/FG3 has potential for application in thermal energy storage systems.
1. Introduction
Nowadays, energy and environmental issues are two major challenges of society, and improving energy utilization efficiency and protecting the environment have received widespread attention.1–4 Thermal energy storage (TES) is a crucial technology for enhancing energy efficiency and matching energy supply and demand in time or space.2 TES has been widely used in reducing building energy consumption, utilizing solar energy, recovering industrial waste heat, peak load shifting strategies, homothermal textiles, and cooling systems.5–10 TES materials can absorb heat when thermal energy is abundant and release it again when thermal energy is insufficient.11 The potential utility of these materials has meant that fabrication of new TES materials has attracted growing attention.12,13 Phase change materials (PCMs) can store and discharge latent heat during liquidation and solidification, and have particular attraction in TES applications.14–16 Because of their excellent chemical stability, large thermal storage capacity, defined melting points for convenient application, and abundance in nature, organic solid–liquid PCMs have been researched extensively and then used in a range of applications.17–19 However, PCMs suffer from a number of deficiencies which have limited their application including thermal conductivity20,21 and inferior thermal durability22 which can confine efficient energy conversion and lead to leakage during the phase change process.23To address these inherent shortcomings in PCMs, a number of approaches have been adopted including mixing PCMs with polymers, incorporating PCMs into porous supports, or encapsulating PCMs in shells, etc.24–28 Combining PCMs with support matrixes has been testified to be an effective method among these.29 Graphite-based materials have been used as support due to their porous structure and high thermal conductivities in the range of 10–70 W m−1 K−1.30 Cabeza's group31,32 successfully embed the paraffin into the graphite and made experimental set-up to evaluate its thermal energy storage performance. Liu and Yang33 skillfully used carbon nanotube and expanded graphite to synergistically improved the thermal conductivity of the composite PCMs. Liu and Rao34 combined the exfoliated graphite and graphene with the paraffin to prepare composite PCMs, which can greatly enhance the thermal conductivity of pure paraffin. Kim's group35,36 successfully incorporated the paraffin and fatty acid ester into the exfoliated graphite nanoplatelets to achieve high-performance composite PCMs. Furthermore, there are some researches on modifying graphite-based materials to increase the PCM loadage in composites or to improve properties of form-stable PCMs. Wei et al.37 intercalated reagent ions into the interlayer of graphite and then heat samples above 1000 K to get the flexible expanded graphite with a larger layer spacing and higher thermal diffusivity. Kitaoka et al.38 used the superheated steam treatment method to increase the thermal diffusivity of flexible graphite sheets. Zhang et al.39 used graphite powder with an expandable rate of 300 ml g−1 to fabricate expanded graphite (EG) at 800 W irradiation power for 10 s to prepare the paraffin/EG composite PCM. Sarı and Karaipekli40 chosen expanded graphite as support material to obtain composite PCMs, which can greatly enhance the mass fraction of PCM. Yuan's group41–45 had a series of research works on expanded graphite composite PCMs with high thermal energy storage performance. Li et al.16 used graphite powder to produce graphene oxide and then skillfully stabilized stearic acid to prepare composite PCMs with adjustable thermal properties. The above approaches have all been shown to produce stable composite PCMs with high thermal storage capacity and thermo-stability.
Much effort has been directed to expanding the layer spacing of natural graphite, and then to support the phase change materials, relative works on modifying the surface of that are not sufficient. And the simplicity of preparation, availability of materials, environmental ‘friendliness’, and economic efficiency have not been considered together. In this paper, present a facile route to synthesize the shape-stabilized PCMs from the natural graphite. We firstly decorated the surface of natural FG by hydrogen peroxide, a mild oxidizing agent, in conjunction with microwave radiation, which is simpler and more economical in synthesis of supporting matrix. Then SA was absorbed into the FG to fabricate SA/FG composites. Moreover, the obtained composite PCMs show large thermal conductivity, high thermal stability, and superior thermal-regulated property.
2. Experimental
2.1. Materials
Raw flake graphite (FGr) with a mean size range of 0.5–1.0 mm and thickness 0.02–0.05 mm were supplied by Qindao Tengshengda Carbon Co., Ltd., China. Stearic acid (CH3(CH2)16COOH, SA) with a phase change temperature range of 56–69.9 °C was provided by Tianjin Hengxing Chemical Reagent Co., Ltd., China. H2O2 (30 wt%) was provided by Xilong Chemical Co., Ltd., China.2.2. Decorating the surface of FGr
The FGr was pre-treated by H2O2 solution in conjunction with microwave radiation as follows: FGr (8.0 g) was soaked with H2O2 (100 g, 30%) solution. The mixtures was placed inside a beaker with plastic wrap, and irradiated at 700 W for 1, 5, and 9 min in microwave oven, respectively. After vacuum suction filtration, and drying at 60 °C for 24 h. Materials obtained by radiation times of 1, 5, and 9 min were designated as FG1, FG2, and FG3, respectively, and non-treated raw flake graphite was FGr.2.3. Preparation of the SA/FG composites
The SA/FG composites were synthesized via vacuum impregnation, following the fabricating process as follows: 8.0 g SA (an excess) and 5.0 g modified FG were put into an erlenmeyer flask, which was concatenated to a suction pump by using a unit of preventing of backward suction. The erlenmeyer flask was created a vacuum at −0.1 MPa for 5 min, and then maintained its temperature at 95 °C for 30 min via a constant temperature bath. The vacuum was released and the flask heated at 80 °C for 5 min in an ultrasonic bath before cooling to room temperature. The resulting mixture was filtered at 80 °C to produce the final stearic acid/flake graphite (SA/FG) composites. The composites were labeled as SA/FGr, SA/FG1, SA/FG2, and SA/FG3, respectively.2.4. Characterization
The thermal storage properties of SA/FG composites and SA were determined by differential scanning calorimetry (DSC; TA Instruments Q2000; ±0.01 °C for phase-transition temperatures and ±0.05% for latent heat values) at a heating/cooling rate was 5 °C min−1 from 20 to 80 °C under N2 atmosphere. The thermal stability of the SA/FG composites and SA were carried out using thermogravimetry-differential scanning calorimetry (TG-DSC; ±1% for enthalpy values) at a heating rate of 10 °C min−1 from room temperature to 600 °C in a N2 atmosphere, using α-Al2O3 crucibles in NETZSCH STA 449F3. The crystalline phase of FG and SA/FG composites were tested by an X-ray diffraction (XRD) using a Rigaku D/max-rA analyzer (Cu-Kα, λ = 1.54 Å) at a current of 40 mA, voltage of 40 kV, scan range from 5–80° and step size of 0.02°. The thermal conductivity of pure SA, FG, and SA/FG composites were obtained from a DRX-II-RW thermal conductivity test instrument (±3% for thermal conductivities) through a steady-heat flow method.46 The morphologies of FGr, FG3, and their corresponding SA/FG composites were characterized using scanning electron microscopy (SEM; JEOL JSM-6360LV). The change of surface chemical groups on FGr and FG3 were analyzed by X-ray photoelectron spectroscopy (XPS; K-Alpha 1063 instrument; 30–400 μm analytic area, 0.5 eV resolution) with focused monochromatized Al Ka radiation. Fourier transform infrared spectroscopy (FT-IR) of all samples was performed in the range of 4000–400 cm−1 at room temperature (Thermo Electron Corporation Nicolet 6700 FTIR spectrometer) and was operated at condition that the content of sample in KBr was around 1%. The thermal storage/release performances of SA and SA/FG3 composite were investigated by an experimental set-up (Fig. S1†) in which the accuracy of thermal couple is ± 0.1 °C, and the thermal-regulated properties were measured through a thermal infrared imager (FLIR T62101; ±2 °C). Nitrogen gas adsorption–desorption isotherms for the FG were measured by an ASAP 2020 surface area and porosimetry system, and the FG samples were outgassed prior to the measurement at 523.15 K and 10−4 mbar for 12 h.3. Results and discussion
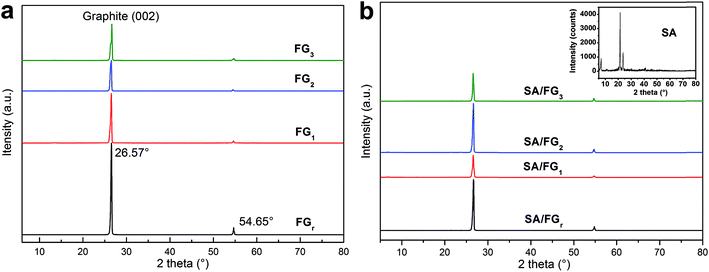
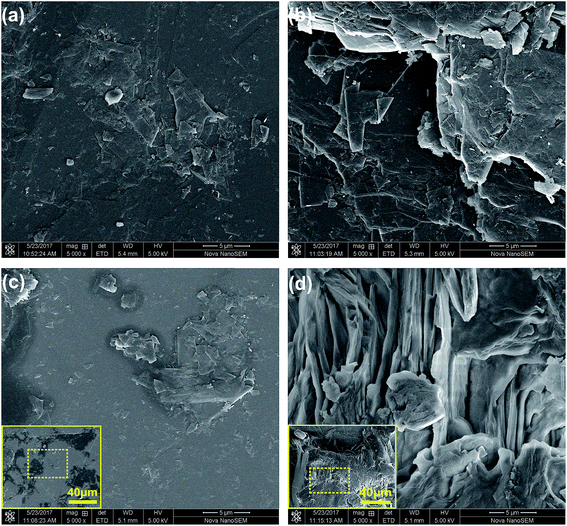
The XRD patterns of the SA and SA/FG composites are shown in Fig. 1. The non-H2O2-microwave treated FGr and other three materials of FG1, FG2, and FG3 all displayed a strong diffraction peak at 2θ = 26.57° due to the regular crystallization of (002) planes of graphite layers,47,48 and a weak one centered at 2θ = 54.65° (Fig. 1a). This means that the FG did not change its physical properties after being treated by H2O2 solution and microwave irradiation. The XRD peaks of SA also appeared in the SA/FG composites (Fig. 1a). There were no additional diffraction peaks observed, indicating that FG matrixes had physical integration but no chemical reaction with SA. Moreover, it could be seen that the intensity of SA diffraction peaks in SA/FG composites were all weaker than that of pure SA. This is because SA was absorbed into the FG so tightly that caused a decreasing of diffraction peak intensity of the SA.49Fig. 2 displays the SEM images of FGr, FG3, and their corresponding SA/FG composites. As shown in Fig. 2a, FGr had a smooth surface without cracks. The whole structure of FGr was compacted, which inhibited incorporation of the melted SA into the FGr during impregnation. In Fig. 2b, cracks are evident on the surface or in the inner of the FG3, and the layer structure of FG3 appear to have been significantly damaged due to 9 min microwave irradiation in hydrogen peroxide solution. It can be concluded that combined H2O2-microwave treatment can increase the surface roughness of treated flake graphite. After impregnation, the sizes of two composites were all increased by supporting the melted SA (Fig. 2c and d). In comparing the loading capacities of these two composites, SA was less adsorbed into the FGr (18.36%) but abundantly incorporated into the FG3 (32.40%). Furthermore, the melted SA was rarely loaded on the surface of the FGr but while attached abundantly onto the surface of FG3.
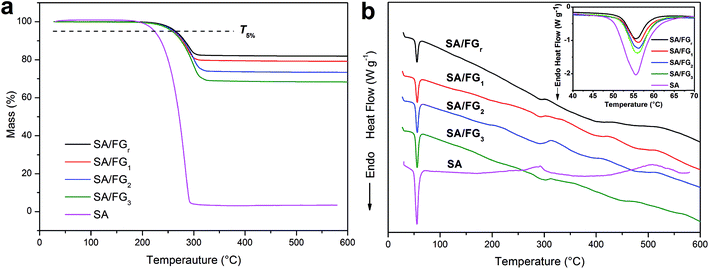
The thermostability of the SA and SA/FG composites were characterized by TG-DSC (Fig. 3). As shown in Fig. 3a, only one single decomposition process existed in the tested temperature range, which due to the degradation of SA. Meanwhile, FG decomposed little in the range 25 °C to 600 °C. The 5% mass loss temperature (T5%) and the complete decomposition temperature were used to evaluate the thermal stability. The pure SA started to degrade at approximately 200 °C and had totally decomposed and evaporated at a temperature of 290 °C, while the SA/FG composites started to decompose at about 230 °C and evaporated completely at above 300 °C. The T5% of pure SA (around 223 °C) was comparatively lower than the T5% of the SA/FG composites (around 262 °C) indicating the SA/FG composites had a greater thermal stability than pure SA. Furthermore, the initial decomposition temperature of SA/FG composites were significantly higher than their own phase change temperature, namely, the SA/FG composites had excellent thermal stability during the phase change process and in a higher temperature range (up to 230 °C). As can be seen in Fig. 3a, the maximum mass fractions of SA in SA/FGr, SA/FG1, SA/FG2, and SA/FG3 were 18.36%, 21.47%, 27.33%, and 32.40%, respectively, and the complete decomposition temperatures (Tmax) for SA/FGr, SA/FG1, SA/FG2 and SA/FG3 were 313, 320, 330, and 340 °C, respectively. This suggests that the SA/FG composites produced by longer microwave irradiation times had higher thermostability. From thermal degradation analysis, the DSC curves of SA and SA/FG composites were similar in form (Fig. 3b), and the corresponding endothermic peaks of solid–liquid phase change all centered in the range 50–58 °C (inset Fig. 3b). Moreover, it was found that the endothermic enthalpies of SA/FG composites increased with increasing SA mass fraction in the composites. In the SA curve, an endothermic peak at above 290 °C suggested a decomposition of pure SA and endothermic peaks in the curves of SA/FG composites indicated that the SA incorporated in SA/FG composites also decomposed at this temperature.
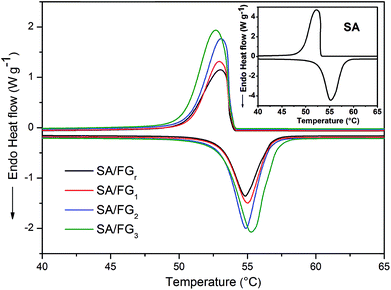
Fig. 4 shows DSC curve of the SA and SA/FG composites from 20 to 80 °C under a N2 atmosphere. The corresponding thermal characteristic data of the SA and SA/FG composites are presented in Table 1. The pure SA had two phase change peaks for melting and solidification, and each of them had one phase change temperature: the melting temperature (Tm) was 52.09 °C in the endothermic curve, and the freezing temperature (Tf) 53.10 °C in the exothermic curve. The DSC curves of SA/FG composites illustrated the melting temperature range to be 50–58 °C, and the solidification temperature range 48–54 °C. The phase change characteristics of the SA/FG composites were similar to that of pure SA, which reflected that there was no chemical reaction between pure SA and FG during the impregnation process. Furthermore, the melting and solidification points increased with the increasing of SA loading in composites (Table 1).
| Samples | Loadage (β, %) | Melting temperature (Tm, °C) | Freezing temperature (Tf, °C) | Latent heat of melting (ΔHm, J g−1) | Latent heat of freezing (ΔHf, J g−1) | Theoretic values of ΔHm (ΔHth, J g−1) | Crystallinity of SA (Fc, %) | Efficient energy per unit mass of SA (Eef, J g−1) |
|---|---|---|---|---|---|---|---|---|
| a Note: ΔHth = ΔHpure × β; Eef = ΔHpure × Fc. | ||||||||
| SA | 100 | 52.90 | 53.10 | 191.6 | 190.0 | — | 100 | — |
| SA/FGr | 18.36 | 53.10 | 53.64 | 34.10 | 34.09 | 34.18 | 99.76 | 191.1 |
| SA/FG1 | 21.47 | 53.13 | 53.69 | 38.60 | 38.17 | 41.13 | 93.85 | 179.8 |
| SA/FG2 | 27.33 | 53.16 | 53.70 | 50.34 | 50.20 | 52.36 | 96.14 | 184.2 |
| SA/FG3 | 32.40 | 53.24 | 53.73 | 61.05 | 61.00 | 62.08 | 98.34 | 188.4 |
Thermal storage capacity (which in effect is the latent heat value) is an important reference index for quantifying the thermal storage performance of composite PCMs. The melting (ΔHm) and freezing (ΔHf) latent heats of pure SA were 191.6 J g−1 and 190.0 J g−1, respectively, in comparison, 34.10 J g−1 and 34.09 J g−1 for SA/FGr; 38.60 J g−1 and 38.17 J g−1 for SA/FG1; 50.34 J g−1 and 50.20 J g−1 for SA/FG2 and 61.05 J g−1 and 61.00 J g−1 for SA/FG3, respectively. Each of these values were slightly lower than the theoretical values (Table 1). Except for the lower fraction of SA within the composites, the decreases of melting and freezing latent heats are also attributed to parts of the long-chain alkanes, limited in the narrow space of the supports, could not melt completely and crystallize. Based the previous reports,13,17,20,50,51 the crystallinity (Fc) was used to represent the interactions between the SA and the supports, which would cut down the latent heats of the composites:
 | (1) |
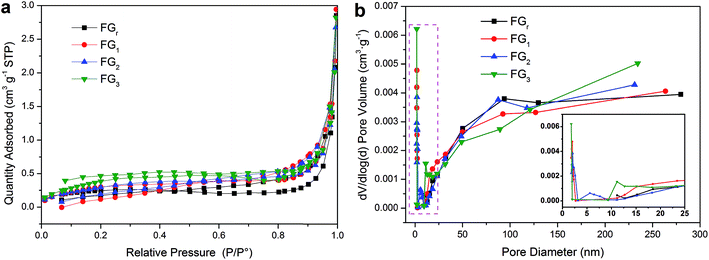 | ||
| Fig. 5 (a) Nitrogen adsorption–desorption isotherms of the FG and (b) BJH pore size distribution for pore volume. | ||
Thermal conductivity is a fundamental factor for composite PCMs. The thermal conductivity values were 5.47, 4.81, 4.47, and 4.35 W m−1 K−1 for FGr, FG1, FG2, and FG3, respectively (Table S2†). It indicates that the thermal conductivities of FG decreased with increasing radiation times due to more cracks and grain boundaries in the treated FG which reduce the ability of thermal conduction.55 After introducing the SA (λ is 0.26 W m−1 K−1) into the FG, the thermal conductivities of the composites reached 4.08, 3.83, 3.66, and 3.18 W m−1 K−1 for SA/FGr, SA/FG1, SA/FG2, and SA/FG3, respectively (Table S2†). For SA/FG composites, the thermal conductivities decreased not only as the H2O2-microwave treatment time increased, but also as the contents of SA increased. Moreover, the thermal conductivity values of SA/FG3 composite was 3.18 W m−1 K−1 compared to pure SA of 0.26 W m−1 K−1 (i.e. 12.2 times higher). It was thus concluded that flake graphite can dramatically enhance the thermal conductivity of pure SA.
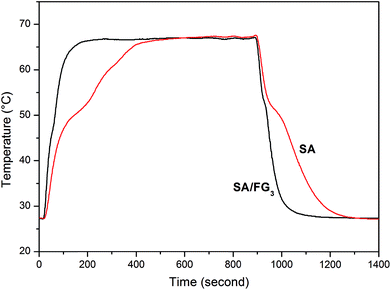
The direct thermal storage and release properties of the SA/FG3 composite was investigated by comparison with that of pure SA using the experimental set-up shown in Fig. S1.† Fig. 6 shows the temperature–time curves for melting and freezing process in the range 27–70 °C. During the heating process, it took 185 s for SA to reach melting temperature. This compared to only 55 s for the SA/FG3 composite, indicating a substantially higher thermal storage rate than that of pure SA. The SA/FG3 took 191 s to reach the balance temperature (about 66.5 °C), whereas pure SA took 489 s to reach the same temperature. During the cooling process, it took 65 s and 410 s for SA to reach its freezing temperature and initial temperature respectively, but only 40 and 277 s for the SA/FG3 composite, indicating the thermal release rate of SA/FG3 was clearly higher than that of pure SA. SA/FG3 reached the temperature plateaus (phase change points) in a shorter time than pure SA, manifesting that thermal storage/release rates were enhanced by incorporating FG.
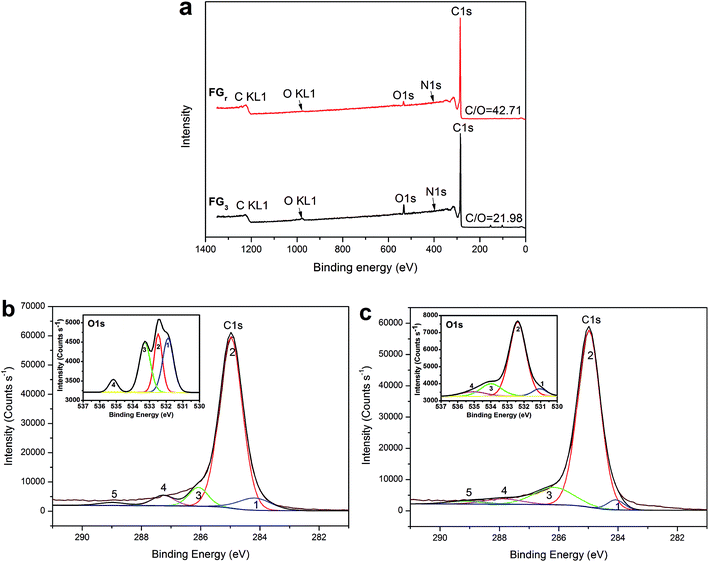
Furthermore, in order to reveal the enhancement-mechanism resulting from H2O2-microwave treatment of graphite in SA/FG3, the change of function groups on the flake graphite surface was studied using XPS. The full XPS spectra of the FGr and FG3 are presented in Fig. 7a and the ratio of carbon to oxygen (C/O) on the surfaces listed in Table 2. These data show that the surface of flake graphite was basically composed of carbon, oxygen and nitrogen. The element contents of carbon and oxygen were 97.37% and 2.28% for the FGr, respectively, 94.96% and 4.32% for FG3, respectively. The C/O ratio of treated flake graphite (FG3) was significantly lower than that of the untreated material (FGr) (21.98 compared to 42.71) as a result of the surface oxidation of carbon of flake graphite. Comparing spectra of the FG3 with that of FGr, it was observed that intensity of C1s peak was reduced after H2O2-microwave treatment, while that of the O1s peak of FG3 was enhanced (Fig. 7a). This supports earlier results that H2O2 oxidation occurred on the surface of FG. A computer simulation (Thermo Avantage) was used to analyze the intensity contribution of main functional component peak (Fig. 7b and c). As it shown, typical XPS spectra of the C1s and O1s peak regions were located at 284.98 eV and 531.88 eV respectively.56 It was found that the C1s peaks with binding energy at 284.18, 284.98, 286.08, 287.26, and 288.98 eV could be suited into a line shapes.57,58 The function groups of the C1s peak region containing 7.98% C![[double bond, length as m-dash]](https://www.rsc.org/images/entities/char_e001.gif) C (sp2), 78.36% C–C (sp3), 7.34% C–O, 4.62% C
C (sp2), 78.36% C–C (sp3), 7.34% C–O, 4.62% C![[double bond, length as m-dash]](https://www.rsc.org/images/entities/char_e001.gif) O, and 1.17% COOH for FGr, 3.20% C
O, and 1.17% COOH for FGr, 3.20% C![[double bond, length as m-dash]](https://www.rsc.org/images/entities/char_e001.gif) C (sp2), 77.60% C–C (sp3), 13.21% C–O, 3.89% C
C (sp2), 77.60% C–C (sp3), 13.21% C–O, 3.89% C![[double bond, length as m-dash]](https://www.rsc.org/images/entities/char_e001.gif) O, and 2.11% COOH for FG3 are summarized in Table 3. Compared to FGr, surface content of C–O and COOH functional groups on the FG3 surface were all increased, while the C
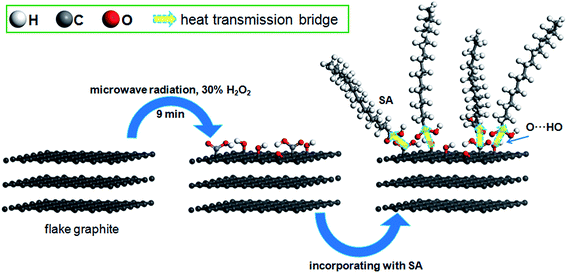
O, and 2.11% COOH for FG3 are summarized in Table 3. Compared to FGr, surface content of C–O and COOH functional groups on the FG3 surface were all increased, while the C![[double bond, length as m-dash]](https://www.rsc.org/images/entities/char_e001.gif) C (sp2) and C–C (sp3) functional groups were decreased. That is to say, flake graphite surface was oxidized by hydrogen peroxide in conjunction with microwave radiation and became more polarized. And the polar melted SA be easy to interact with surfaces graphite due to polarity effect during impregnation. So, the more SA were supported by FG3. It was described in atomic-scale in Fig. 8. Furthermore, according to the thermal-cycling tests, the latent heat of SA/FG3 composite after 100 cycles was 99.98% compared with non-cycling test composite. It means that the SA supported in decorated FG showed great thermal-cycling performances, and the reason for no SA leakage was because of the interfacial interaction between decorated FG and pure SA. Also, the FTIR of SA, FG3, and SA/FG3 were studied (Fig. S3†), a hydrogen bonding was formed between the band at 918 cm−1 of FG3 (hydroxyl) and at 933 cm−1 of SA (OH functional group).52,59 The hydrogen bonding can be serve as heat transmission bridge (Fig. 8). Moreover, as the graphite had a high thermal conductivity it can dramatically enhance the thermal conductivity of pure SA in the SA/FG3 composite.
C (sp2) and C–C (sp3) functional groups were decreased. That is to say, flake graphite surface was oxidized by hydrogen peroxide in conjunction with microwave radiation and became more polarized. And the polar melted SA be easy to interact with surfaces graphite due to polarity effect during impregnation. So, the more SA were supported by FG3. It was described in atomic-scale in Fig. 8. Furthermore, according to the thermal-cycling tests, the latent heat of SA/FG3 composite after 100 cycles was 99.98% compared with non-cycling test composite. It means that the SA supported in decorated FG showed great thermal-cycling performances, and the reason for no SA leakage was because of the interfacial interaction between decorated FG and pure SA. Also, the FTIR of SA, FG3, and SA/FG3 were studied (Fig. S3†), a hydrogen bonding was formed between the band at 918 cm−1 of FG3 (hydroxyl) and at 933 cm−1 of SA (OH functional group).52,59 The hydrogen bonding can be serve as heat transmission bridge (Fig. 8). Moreover, as the graphite had a high thermal conductivity it can dramatically enhance the thermal conductivity of pure SA in the SA/FG3 composite.
| Samples | Element content (%) | C/O | ||
|---|---|---|---|---|
| C | O | N | ||
| FGr | 97.37 | 2.28 | 0.35 | 42.71 |
| FG3 | 94.96 | 4.32 | 0.72 | 21.98 |
| Samples | Function group of C1s (%) | Function group of O1s (%) | |||||||
|---|---|---|---|---|---|---|---|---|---|
Peak 1 C![[double bond, length as m-dash]](https://www.rsc.org/images/entities/char_e001.gif) C (sp2) C (sp2) |
Peak 2 C–C (sp3) | Peak 3 C–O | Peak 4 C![[double bond, length as m-dash]](https://www.rsc.org/images/entities/char_e001.gif) O O |
Peak 5 COOH | Peak1 C![[double bond, length as m-dash]](https://www.rsc.org/images/entities/char_e001.gif) O O |
Peak 2 C–O; Ar-OH | Peak 3 C–O–C | Peak 4 COOH | |
| 284.18 eV | 284.98 eV | 286.08 eV | 287.26 eV | 288.98 eV | 531.88 eV | 532.48 eV | 533.28 eV | 535.18 eV | |
| FGr | 7.98 | 78.36 | 7.34 | 4.62 | 1.71 | 34.17 | 27.62 | 31.72 | 6.49 |
| FG3 | 3.20 | 77.60 | 13.21 | 3.89 | 2.11 | 5.98 | 72.14 | 15.24 | 6.63 |
The temperature-regulated property was measured by using the thermal infrared imager to record different temperature area (Fig. 9). The SA/FG3 (SP1) and pure SA (SP2) tabletting rounds were first maintained at a room temperature (27 °C) and then exposed to a thermostatic board with a temperature of 65 °C simultaneously. Thermal images illustrated that two samples absorbed heat and then reached points around their phase change temperature (Fig. 9a–c). After that, the pure SA increased its temperature to the highest point sustainably (Fig. 9d). The thermoregulatory effect was observed from the variation process that the SA and SA/FG3 had a temperature change about 3.1 °C and 2.1 °C respectively from 60 to 300 s (Fig. 9b & c), while about 10.6 °C and 5.9 °C respectively from 300 to 720 s (Fig. 9c & d). It seems that the SA/FG3 composite possessed superior temperature-regulated properties, and can storage and discharge amounts of heat during phase change process within a small temperature range. In addition, after heating for about 300 s (Fig. 9c) the solid SA began to melt and after 720 s was entirely in the liquid phase (Fig. 9d), while the SA/FG3 composite kept its shape under the whole heating process. It suggested that the obtained composite material had an excellent non-leakage capacity.60
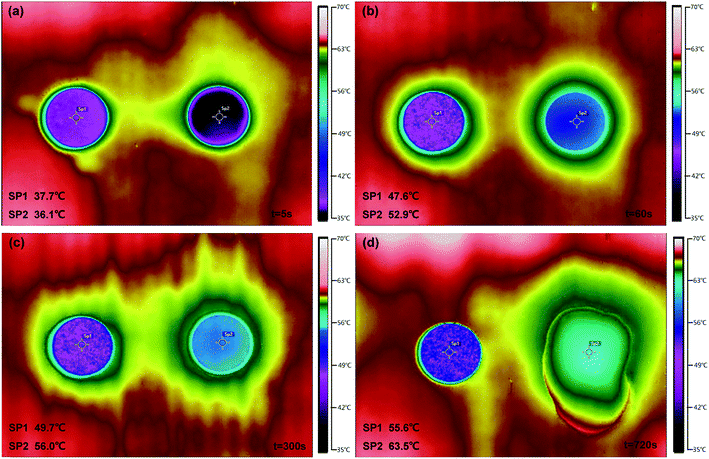 | ||
| Fig. 9 Thermal images of SA/FG3 (SP1) and pure SA (SP2) tabletting rounds heated at different times: (a) t = 5 s; (b) t = 60 s; (c) t = 300 s; (d) t = 720 s. | ||
4. Conclusion
SA/FG composites were synthesized by absorbing SA into the FG which under H2O2-microwave treatment, and the maximum content of SA reached to 32.4% in the SA/FG3 composite while the microwave time of 9 min. As a result, it was found that there was no chemical interactions between SA and FG from XRD results. The SEM confirmed that the H2O2-microwave treatment increased the surface roughness of treated flake graphite and loosen the compacted structure. From the DSC, the SA/FG3 composite had 61.05 J g−1 and 61.00 J g−1of latent heat for melting and freezing, respectively, a good thermal reliability after 100 thermal cycling tests, and an excellent thermal stability within 230 °C. The thermal conductivity of SA/FG3 was 3.18 W m−1 k−1, and the thermal storage/release test of SA/FG3 composite indicated that the thermal release rate of SA/FG3 was clearly higher than that of pure SA. According to the XPS analysis, the oxygen-containing functional groups in the surface of the FG3 were increased after microwave radiation in H2O2. The enhancement-mechanism resulting from H2O2-microwave treatment of graphite in SA/FG3 was demonstrated in atomic-scale. Infrared imager showed the SA/FG3 possessed superior temperature-regulated properties. In conclusion, the SA/FG3 has been demonstrated to have potential for application in thermal energy storage system.Conflicts of interest
There are no conflicts to declare.Acknowledgements
This work was supported by the National Natural Science Foundation of China (51504041, 51362002); the Natural Science Foundation of Hunan Province (2016JJ3009); the Scientific Research Fund of Hunan Provincial Education Department (15K007); the Key Research and Development Program of Jiangxi Province (20171BBH80021); the State Key Laboratory Breeding Base of Nuclear Resources and Environment (NRE1403); the Key Laboratory of Renewable Energy Electric-Technology of Hunan Province (2017ZNDL009) and the Hunan Province 2011 Collaborative Innovation Center of Clean Energy and Smart Grid.Notes and references
- H. Sun and S. Wang, Energy Fuels, 2014, 28, 22–36 CrossRef CAS.
- Y. Yuan, N. Zhang, W. Tao, X. Cao and Y. He, Renewable Sustainable Energy Rev., 2014, 29, 482–498 CrossRef CAS.
- L. Zhou, H. Zhang, H. Sun, S. Liu, M. O. Tade, S. Wang and W. Jin, Catal. Sci. Technol., 2016, 6, 7002–7023 CAS.
- Z. He, Y. Jiang, J. Zhu, Y. Li, Z. Jiang, H. Zhou, W. Meng, L. Wang and L. Dai, J. Alloys Compd., 2018, 731, 32–38 CrossRef CAS.
- A. de Gracia and L. F. Cabeza, Renewable Sustainable Energy Rev., 2017, 69, 1055–1063 CrossRef.
- M. Pomianowski, P. Heiselberg and Y. Zhang, Energ. Build., 2013, 67, 56–69 CrossRef.
- S. Kuravi, J. Trahan, D. Y. Goswami, M. M. Rahman and E. K. Stefanakos, Prog. Energy Combust. Sci., 2013, 39, 285–319 CrossRef.
- H. Mehling and L. F. Cabeza, Heat and cold storage with PCM, Springer, Berlin Heidelberg, 2008 Search PubMed.
- B. Li, T. Liu, L. Hu, Y. Wang and L. Gao, ACS Sustainable Chem. Eng., 2013, 1, 374–380 CrossRef CAS.
- X. Gao, Y. Yuan, X. Cao, H. Wu and X. Zhao, Process Saf. Environ. Prot., 2017, 107, 438–453 CrossRef CAS.
- H. Zhang, J. Baeyens, G. Cáceres, J. Degrève and Y. Lv, Prog. Energy Combust. Sci., 2016, 53, 1–40 CrossRef.
- Y. Yuan, X. Gao, H. Wu, Z. Zhang, X. Cao, L. Sun and N. Yu, Energy, 2017, 119, 817–833 CrossRef.
- C. Li, B. Xie and J. Chen, RSC Adv., 2017, 7, 30142–30151 RSC.
- A. Sharma, V. V. Tyagi, C. R. Chen and D. Buddhi, Renewable Sustainable Energy Rev., 2009, 13, 318–345 CrossRef CAS.
- J. Gasia, M. Martin, A. Solé, C. Barreneche and L. Cabeza, Appl. Sci., 2017, 7, 722 CrossRef.
- B. Li, T. Liu, L. Hu, Y. Wang and S. Nie, Chem. Eng. J., 2013, 215–216, 819–826 CrossRef CAS.
- Q. Zhang, H. Wang, Z. Ling, X. Fang and Z. Zhang, Sol. Energy Mater. Sol. Cells, 2015, 140, 158–166 CrossRef CAS.
- A. Sarı, A. Biçer and A. Karaipekli, Mater. Lett., 2009, 63, 1213–1216 CrossRef.
- S. Ye, Q. Zhang, D. Hu and J. Feng, J. Mater. Chem. A, 2015, 3, 4018–4025 CAS.
- C. Wang, L. Feng, W. Li, J. Zheng, W. Tian and X. Li, Sol. Energy Mater. Sol. Cells, 2012, 105, 21–26 CrossRef CAS.
- B. Li, S. Nie, Y. Hao, T. Liu, J. Zhu and S. Yan, Energy Convers. Manage., 2015, 98, 314–321 CrossRef CAS.
- J. Yong, E. Ding and G. Li, Polymer, 2002, 43, 117–122 CrossRef.
- F. Tang, L. Liu, G. Alva, Y. Jia and G. Fang, Sol. Energy Mater. Sol. Cells, 2017, 160, 1–6 CrossRef CAS.
- M. Li and Z. Wu, Renewable Sustainable Energy Rev., 2012, 16, 2094–2101 CrossRef CAS.
- M. Silakhori, H. S. C. Metselaar, T. M. I. Mahlia, H. Fauzi, S. Baradaran and M. S. Naghavi, Energy Convers. Manage., 2014, 80, 491–497 CrossRef CAS.
- J. Giro-Paloma, C. Alkan, J. Chimenos and A. Fernández, Appl. Sci., 2017, 7, 723 CrossRef.
- J. Giro-Paloma, M. Martínez, L. F. Cabeza and A. I. Fernández, Renewable Sustainable Energy Rev., 2016, 53, 1059–1075 CrossRef CAS.
- Y. Hao, X. Shao, T. Liu, B. Li and S. Nie, Thermochim. Acta, 2015, 604, 45–51 CrossRef CAS.
- Y. Yuan, T. Li, N. Zhang, X. Cao and X. Yang, J. Therm. Anal. Calorim., 2016, 124, 881–888 CrossRef CAS.
- A. Mills, M. Farid, J. R. Selman and S. Al-Hallaj, Appl. Therm. Eng., 2006, 26, 1652–1661 CrossRef CAS.
- L. F. Cabeza, B. Zalba, J. M. Marín and H. Mehling, Presented in part at the 9th International Conference on Thermal Energy Storage, Warsaw, Poland, 2003 Search PubMed.
- J. M. Marín, B. Zalba, L. F. Cabeza and H. Mehling, Int. J. Heat Mass Transfer, 2005, 48, 2561–2570 CrossRef.
- Z.-P. Liu and R. Yang, Appl. Sci., 2017, 7, 574 CrossRef.
- X. Liu and Z. Rao, Thermochim. Acta, 2017, 647, 15–21 CrossRef CAS.
- S. Kim and L. T. Drzal, Sol. Energy Mater. Sol. Cells, 2009, 93, 136–142 CrossRef CAS.
- S. Wi, J. Seo, S. G. Jeong, S. J. Chang, Y. Kang and S. Kim, Sol. Energy Mater. Sol. Cells, 2015, 143, 168–173 CrossRef CAS.
- X. H. Wei, L. Liu, J. X. Zhang, J. L. Shi and Q. G. Guo, J. Mater. Sci., 2010, 45, 2449–2455 CrossRef CAS.
- S. Kitaoka, M. Wada, T. Nagai, N. Osa and T. Konno, J. Mater. Sci., 2011, 46, 1132–1135 CrossRef CAS.
- Z. Zhang, N. Zhang, J. Peng, X. Fang, X. Gao and Y. Fang, Appl. Energy, 2012, 91, 426–431 CrossRef CAS.
- A. Sari and A. Karaipekli, Sol. Energy Mater. Sol. Cells, 2009, 93, 571–576 CrossRef CAS.
- Y. Yuan, N. Zhang, T. Li, X. Cao and W. Long, Energy, 2016, 97, 488–497 CrossRef CAS.
- N. Zhang, Y. Yuan, Y. Du, X. Cao and Y. Yuan, Energy, 2014, 78, 950–956 CrossRef CAS.
- C. Liu, Y. Yuan, N. Zhang, X. Cao and X. Yang, Mater. Lett., 2014, 120, 43–46 CrossRef CAS.
- N. Zhang, Y. Yuan, X. Wang, X. Cao, X. Yang and S. Hu, Chem. Eng. J., 2013, 231, 214–219 CrossRef CAS.
- X. Yang, Y. Yuan, N. Zhang, X. Cao and C. Liu, Sol. Energy, 2014, 99, 259–266 CrossRef CAS.
- J.-L. Zeng, S.-H. Zheng, S.-B. Yu, F.-R. Zhu, J. Gan, L. Zhu, Z.-L. Xiao, X.-Y. Zhu, Z. Zhu, L.-X. Sun and Z. Cao, Appl. Energy, 2014, 115, 603–609 CrossRef CAS.
- H. Sun, S. Liu, G. Zhou, H. M. Ang, M. O. Tadé and S. Wang, ACS Appl. Mater. Interfaces, 2012, 4, 5466–5471 CAS.
- X. Fang, Q. Ding, L. Y. Li, K. S. Moon, C. P. Wong and Z. T. Yu, Energy Convers. Manage., 2015, 103, 251–258 CrossRef CAS.
- G. Fang, H. Li, Z. Chen and X. Liu, Energy, 2010, 35, 4622–4626 CrossRef CAS.
- C. Wang, L. Feng, H. Yang, G. Xin, W. Li, J. Zheng, W. Tian and X. Li, Phys. Chem. Chem. Phys., 2012, 14, 13233–13238 RSC.
- Q. Cao and P. Liu, Eur. Polym. J., 2006, 42, 2931–2939 CrossRef CAS.
- C. Li, L. Fu, J. Ouyang and H. Yang, Sci. Rep., 2013, 3, 1908 CrossRef PubMed.
- M. Rezaveisi, S. Ayatollahi and B. Rostami, J. Pet. Sci. Eng., 2012, 86–87, 165–171 CrossRef CAS.
- M. J. Golding, H. E. Huppert and J. A. Neufeld, Phys. Fluids, 2013, 25, 036602 CrossRef.
- C. Li, L. Fu, J. Ouyang, A. Tang and H. Yang, Appl. Clay Sci., 2015, 115, 212–220 CrossRef CAS.
- H. Sun, Y. Bai, W. Jin and N. Xu, Sol. Energy Mater. Sol. Cells, 2008, 92, 76–83 CrossRef CAS.
- K. K. C. Ho, G. Beamson, G. Shia, N. V. Polyakova and A. Bismarck, J. Fluorine Chem., 2007, 128, 1359–1368 CrossRef CAS.
- Y. Cheng, H. Sun, W. Jin and N. Xu, Chem. Eng. J., 2007, 128, 127–133 CrossRef CAS.
- K. Peng, J. Zhang, H. Yang and J. Ouyang, RSC Adv., 2015, 5, 66134–66140 RSC.
- T. Wang, S. Wang, R. Luo, C. Zhu, T. Akiyama and Z. Zhang, Appl. Energy, 2016, 171, 113–119 CrossRef CAS.
Footnote |
| † Electronic supplementary information (ESI) available. See DOI: 10.1039/c7ra11016b |
| This journal is © The Royal Society of Chemistry 2017 |

